Falsification of the mathematical
models of methane reforming process
using generalized least squares method
Anna SCIAZKO
2015
A dissertation submitted in partial fulfilment of the requirements for
the degree of Doctor of Philosophy
Division of Regional Environment Systems,
Graduate School of Engineering and Science,
Shibaura Institute of Technology
Supervisors:
Acknowledgements
It is my great pleasure to express my sincere appreciation to all the people who supported me through the preparation of this dissertation in both the Shibaura Institute of Technology in Japan and AGH University of Science and Technology in Poland
I would like to convey my deepest appreciation to Professor Shinji Kimijima for accepting me in his laboratory, for his invaluable guidance, patience, sincere enthusiasm and advice in the field of experimental and numerical studies.
I would like to express my sincere gratitude to Professor Janusz S. Szmyd for his inestimable advices and supervision, encouragement to broaden knowledge and discover new areas in the fields of energy engineering and numerical modelling.
It is my pleasure to acknowledge Dr. Yosuke Komatsu and show my highest gratitude for his efforts and dedication during all stages of the preparation of this dissertation. His enthusiasm, motivation and patience for research and kind support during my exchange study in Japan can not be underestimated.
I appreciate the important contribution of Dr. Grzegorz Brus, for introducing me to the area of material issues in Solid Oxide Fuel Cells and all his ideas and support during the methane/steam reforming process studies. I would like to acknowledge the kind advice of Professor Zygmunt Kolenda in the subject of theoretical aspects of Generalized Least Squares Method, which improved the quality of this dissertation. Thanks are expressed here also to the members of the Professor Kimijima laboratory, especially to Mr. Nobuyuki Washio and Mr. Masayuki Ota, and to Mr. Marcin Mozdzierz and Mr. Marcin Zakrzewski for their research collaboration.
my knowledge during my research conducted at SIT. I would like also to express my sincere gratitude to Ms. Midori Yabe, Ms. Yuko Nishishita, Ms. Yumi Okada and Ms. Misa Nakamura from the International Section of Shibaura Institute of Technology for organizing my research internships and for the great amount of help and support I received during all of my stays in Japan.
Finally I would like to express my heartfelt acknowledgement for my family who supported me through the preparation of this thesis, for their understanding, motivation and constant encouragement,
Contents
Abstract ... vi! Nomenclature ... vii! Figure Captions ... xi! Table Captions ... xv! 1! Introduction ... 1!1.1! Introduction to syngas production ... 1!
1.1.1! Syngas production methodology ... 1!
1.1.2! Application to the power generation sector ... 9!
1.2! Solid Oxide Fuel Cells ... 11!
1.3! Fuel Processing for Solid Oxide Fuel Cell ... 14!
1.4! Models of SOFC coupled with reforming of fuel ... 17!
1.5! Methane/Steam Reforming kinetics investigations ... 24!
1.5.1! Nickel catalyst and SOFC applications ... 24!
1.5.2! Necessity of the reliable reforming kinetic description ... 25!
1.6! Goal of the Thesis ... 27!
2! Outline of the Generalized Least Squares method ... 29!
2.1! Approaches to mathematical modelling ... 30!
2.2! Applications of Least Squares Method ... 32!
2.3! Least squares method – Legendre formulation ... 35!
2.4! Least Squares Method ... 36!
2.5! Generalized Least Squares Method ... 39!
2.6! Covariance Matrix and errors of the solution ... 40!
2.7! Formation principles of constraint equations ... 42!
3! Mathematical methodologies of deriving the methane reforming kinetic ... 45!
3.1! Mathematical description of the methane/steam reforming process ... 45!
3.2! Power law expression adopted for the evaluation of the reaction kinetics ... 50!
3.3! Methane/steam reforming reaction in a Plug Flow Reactor ... 52!
3.4! Conversion of methane and basic definitions ... 54!
3.5! A standard approach for the analysis of the reaction order coefficients ... 58!
3.6! A modified approach for the analysis of reaction order coefficients ... 61!
3.7! The calculation of activation energy and Arrhenius constant ... 63!
3.8! An algorithm for the calculation of reaction kinetics ... 65!
4! Experimental studies ... 68!
4.1! Experimental setup and methodology ... 68!
4.2! Analysis of errors of the measuring devices ... 71!
4.3! Catalyst material ... 76!
4.4! Size of the catalyst particles ... 79!
4.5! Designed Experimental conditions ... 85!
5.2! The modified approach ... 96!
5.3! Comparison of the methods ... 103!
5.4! Model of the methane/steam reforming process ... 106!
5.5! Influence of the catalyst for the derived kinetics ... 111!
6! An application of the GLS Method ... 116!
6.1! An application of the GLS method to the methane/steam reforming process – a general approach ... 116!
6.2! The definition of the Equations ... 119!
6.3! The definition of the Variables ... 121!
6.4! The definition of the Model ... 124!
6.5! The calculation of the values of the initial approximation of the unknowns ... 125!
6.6! Criteria of applicability of the system of condition equations for co-ordination purposes ... 129!
6.6.1! Possibility of the reduction of the constraint equation set ... 129!
6.6.2! Determination of the validity of the constraint equation set for application of the GLS algorithm ... 130!
6.7! Results of the investigation ... 132!
6.8! Comparison of the result by the GLS and standard approach method ... 134!
7! Comparison of the reaction kinetics ... 139!
8! Validation of the various mathematical models by GLS ... 148!
8.1! Proposed mathematical models for methane/steam reforming process ... 148!
8.2! Results of validation of the models ... 150!
9! Conclusions ... 158!
9.1! General remarks ... 158!
9.2! Suggestions for future work ... 162!
References ... 164!
Appendix A: Details of the experimental apparatus ... 178!
Appendix B: Properties of investigated catalysts ... 180!
B.1 SEM images of catalyst powders ... 180!
B.2 Measurement of particle size ... 185!
Appendix C: Derivation of methane steam kinetic using the basic methodologies ... 188!
C.1 Results of the standard method ... 189!
Abstract
The presented research for methane/steam reforming process attempted to provide the comprehensive description of the methane/steam reforming process dedicated for Solid Oxide Fuel Cell (SOFC). Despite the fact that methane/steam reforming is currently one of the most popular industrial methods for hydrogen production, the kinetic of the reaction have not been fully described and the derived empirical models of the process are significantly divergent among themselves. In the classical approach to the mathematical modelling, the quality of the model of the physical phenomena is decreased because of the uncertainties derived from the model simplifications and uncertainties of the experimental measurements. The conducted research proposes the experimental and numerical analyses of the methane/steam reforming process using the Generalized Orthogonal Least Squares (GLS) method. The GLS algorithm is applicable for finding the most probable approximation of the unknown parameters, which define the reliability of the derived reforming reaction rate and provides a criteria for the objective quantifications of the mathematical models describing the physical process.
Nomenclature
For mathematical expression deriving reaction kinetics
A Pre-exponential factor, mol g-1 s-1 Pa-(a+b)a Reaction order coefficient on the partial pressure of CH4, - b Reaction order coefficient on the partial pressure of H2O, - E Activation energy, J mol-1
e- Electron
Fi Molar flow rate of the chemical i-th component, mol s-1
Fi_v Volumetric flow rate of the chemical i-th component, m3 s-1
fA Fractional conversion of substance A, -
GHSV Gas Hourly Space Velocity, h-1
∆G Change in Gibbs free energy, J mol-1
∆H0 Standard enthalpy of reaction, J mol-1
Kreaction Equilibrium constant for chemical reaction, -
K+reaction Forward rate constant for chemical reaction, -
K-reaction Backward rate constant for chemical reaction, -
k Reaction constant, mol g-1 s-1 Pa-(a+b)
mi Molar fraction of chemical component i, -
NC Nitrogen-to-Carbon ratio, - n Number of measurement points, -
P Pressure, Pa
∆P Difference in pressure between inlet and outlet, Pa
pi Partial pressure of the chemical component i, Pa
R Universal gas constant, 8.3144621 J mol-1 K-1
Rst Reaction rate, mol s-1 r Reaction rate, mol s-1 g-1
Vgas Gas velocity, mm3 h-1
Vcat Volume of the catalyst layer, mm3 wcat Catalyst weight, g
x Conversion rate of Methane Steam Reforming Reaction, -
y Conversion rate of Water Gas Shift Reaction, -
αline Arrhenius line coefficient, - βline Arrhenius line coefficient, -
Superscripts
i Inlet
o Outlet
* Active site of the catalyst
Subscripts ad Adsorption reaction CH4 Methane CO Carbon Oxide CO2 Carbon Dioxide H2 Hydrogen H2O Water sh Shift reaction
st Steam reforming reaction
For mathematical derivation of LS and GLS Methods
A J×K Jacobi’s matrixes of measurements
AB J×(K+N) Jacobi’s matrixes of variables
B J×N Jacobi’s matrixes of unknowns
CB A-priori covariance matrix for all variables; rank
(K+N)×(K+N)
σk
2 on the diagonal and 0 on the other positions; rank K×K
CSX A-priori covariance matrix with the variances of unknowns σ
n
2
on the diagonal and 0 on the other positions; rank N×N
CU A-posteriori covariance matrix for measurements rank K×K
CX A-posteriori covariance matrix for unknowns rank N×N
CVB A-posteriori covariance matrix for variables rank
(K+N)×(K+N)
F Auxiliary variable
G Auxiliary variable
fj j-th equation in the constraint equation set
I Unit matrix
J Number of constraint equations
k J-elements vector of Lagrange multipliers vector
K Number of measurements
L Lagrange function
N Number of unknowns
S Auxiliary variable
sk, sn Error characterizing k-th measurement and n-th unknown
u K-elements vector of measurements
uk k-th measurement
u* K-elements vector of real values of the quantities to be
measured
uk* k-th quantity to be measured
w J-elements vector of residuals of equations
wi Residual of j-th constraint equation
VK+N Volume of the covariance hyperellipsoid
VB (K+N)-elements vector of measurements
v K-elements vector of correction for measurement u
vk, Correction to k-th measurement uk
x N-elements vector of approximations of unknowns
xn Approximation of n-th unknown
xn* n-th unknown (quantity to be solved by numerical computation)
y N-elements vector of correction for unknowns x
yn Correction to n-th unknown xn
Γ Euler’s gamma function
σk
2
, σn
2
Variance of k-th measurement and n-th unknown
ϕ Function to be minimized in the co-ordination algorithm
Superscripts
Figure Captions
Figure 1.1 Schematic configuration of a Solid Oxide Fuel Cell in the tubular configuration
and its working principle ... 12!
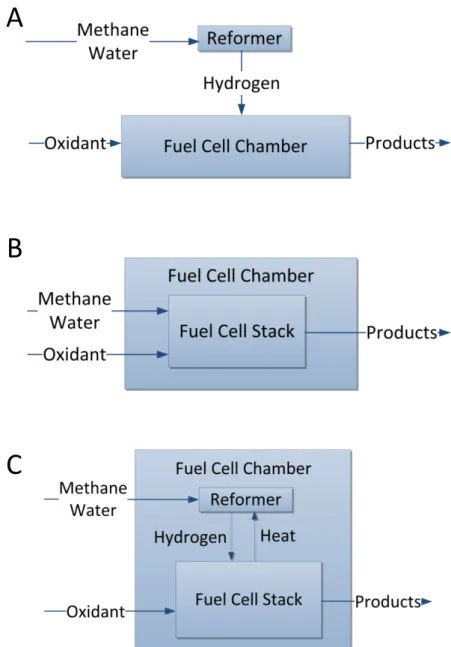
Figure 1.2 Fuel processing for Fuel Cell: A) External Reforming System, B) Direct Internal Reforming System, and C) Indirect Internal Reforming System ... 15!
Figure 1.3 Heat flow in advanced system of SOFC with internal reforming and by-product heat utilization ... 15!
Figure 1.4 Possible reaction pathways in A) SOFC with direct internal reforming system B) indirect reforming system coupled with SOFC ... 17!
Figure 1.5 Influence of the assumed reaction kinetic model for A) current density and Nernst voltage distribution, B) methane, hydrogen and carbon monoxide distribution, C) temperature distribution of IEA 2 gas D) temperature difference between the predicted temperature difference for IEA1 and IEA2 gases (reproduced from [100]) ... 20!
Figure 2.1 Approaches to mathematical modelling: A) classical problem definition, B) errors of mathematical models and C) models with supplementary data ... 31!
Figure 2.2 Hyperelipsoid of the bivariate normal distribution ... 42!
Figure 3.1 Sequence of the elementary steps for the methane steam reforming on the Ni catalyst according to Wei and Iglesia [32] ... 48!
Figure 3.2 Schema of plug flow reactor: a differential volume element dVr with flow rate F and fractional conversion f of the limiting reactant A [199] ... 53!
Figure 3.3 Methane flow rate in a function of catalyst weight [94] ... 57!
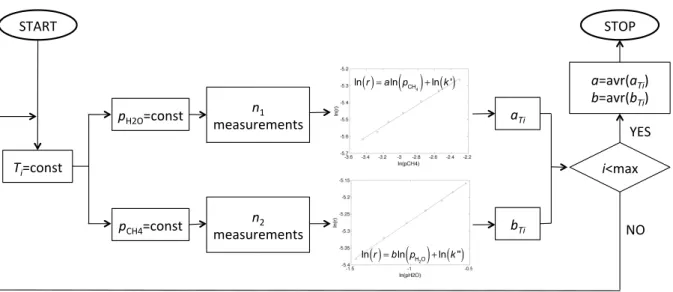
Figure 3.4 Algorithm of standard approach to evaluate reaction orders a and b ... 61!
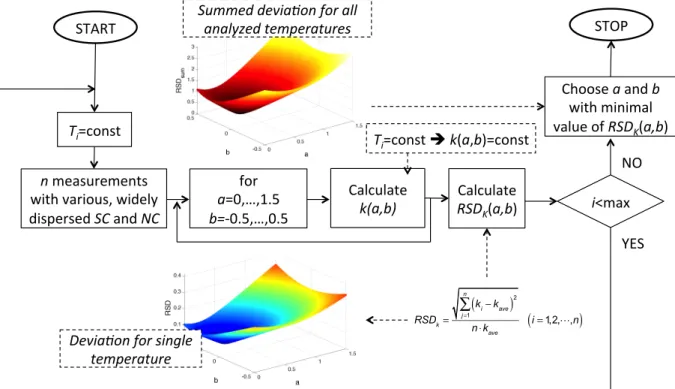
Figure 3.5 Algorithm of the modified approach to evaluate reaction orders a and b ... 63!
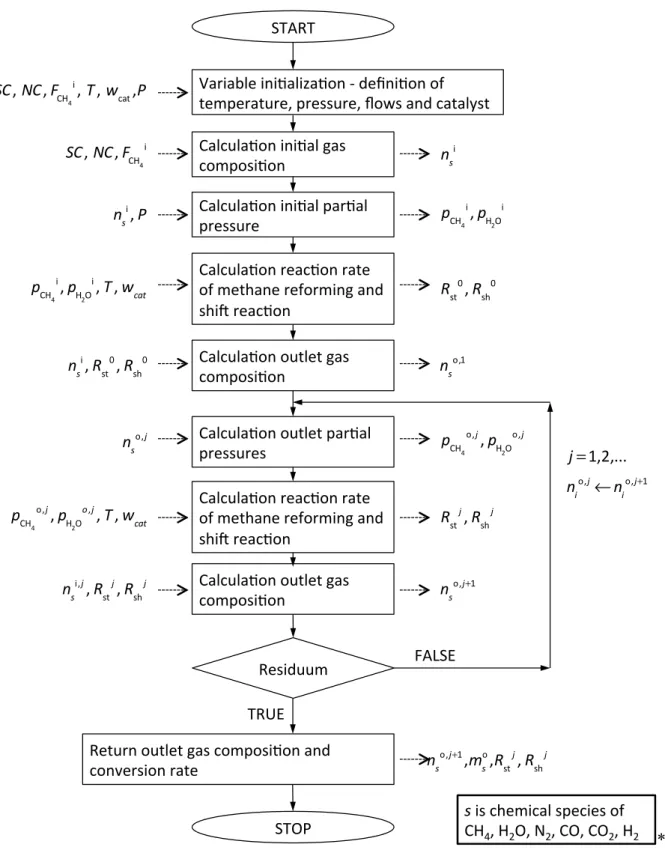
Figure 3.6 Arrhenius plot for calculation of activation energy and pre-exponential constant 64! Figure 3.7 Schema of the numerical algorithm for calculation of reaction kinetic from the derived kinetic equation ... 67!
Figure 4.1 Schema of A) reactor and B) experimental setup ... 69!
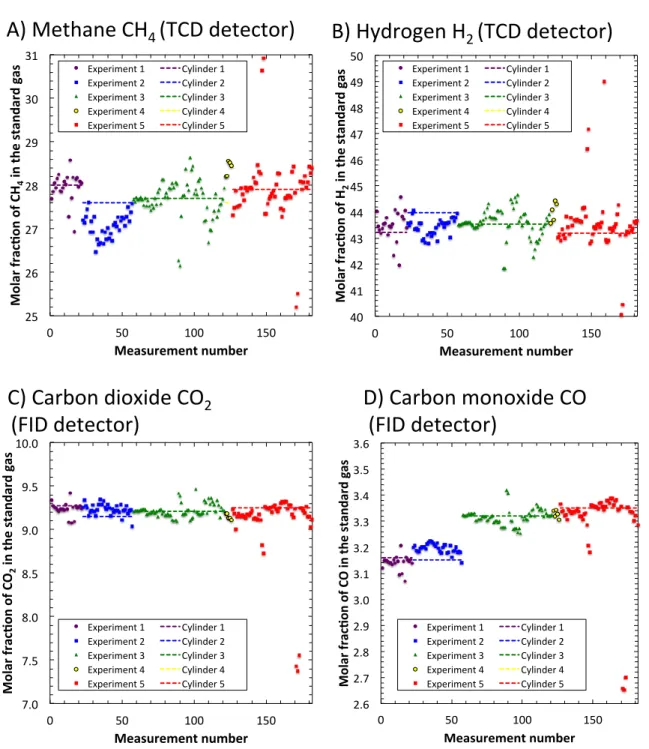
Figure 4.2 The measurements of standard gas composition and the expected value for A) methane, B) hydrogen, C) carbon dioxide and D) carbon monoxide ... 74!
Figure 4.3 Histogram of error distribution for the measurement of the composition of A) methane, B) hydrogen, C) carbon dioxide and D) carbon monoxide in standard gas ... 75!
Figure 4.4 Sintering an anode samples ... 78!
Figure 4.5.A) Anodes before sintering and B) Anodes after sintering ... 79!
Figure 4.6 Catalyst preparation schema ... 79!
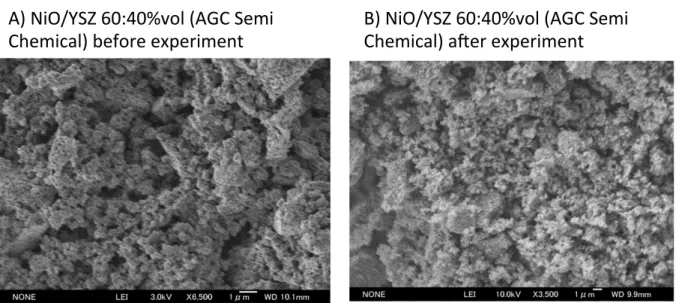
Figure 4.7 SEM measurement of the sample A) before and B) after the conducted experiment for industrial non-sintered catalyst ... 81!
Figure 4.8 SEM images of anodes: A) a unsintered NiO/YSZ (60:40vol.%) catalyst, prepared without a liquid dispersant, B) a sintered NiO/YSZ (60:40vol.%) prepared with the acetone dispersant and C) a sintered Ni/YSZ (60:40vol.%) catalyst prepared with the acetone dispersant ... 82!
Figure 4.11 Observation of the catalyst after the reforming experiment using the SEM
technique: NiO/YSZ (60:40vol.%) catalyst prepared with the acetone dispersant ... 83!
Figure 4.12 Size of the particles - probability density function ... 84!
Figure 4.13 Size of the particles - cumulative probability distribution ... 85!
Figure 4.14 Distribution of experimental condition for A) lower total molar flow rate and B)
higher total molar flow rate ... 89!
Figure 4.15 Conversion rate for the unsinterred NiO/YSZ (60:40vol.%) catalyst for A)
representative examples obtained from the experiment, B) in the correlation with the Gas Hourly Space Velocity (GHSV) at the condition (SC=3 and NC=3), C) in the correlation with the GHSV at the condition of the reaction temperature at 700 oC ... 91!
Figure 5.1 Experimentally obtained results of the conversion rate for the measurements with
the constant flow rates of methane and of water (standard approach) ... 93!
Figure 5.2 Experimental results obtained from the measurements conducted at 500oC for the
approximation of the reaction orders by the standard approach: correlations between the reaction rate and A) partial pressure of methane for the calculation of parameter a and B) partial pressure of water for the calculation of parameter b ... 94!
Figure 5.3 Correlation between partial pressures of methane and water at a test temperature
of 500 oC for the measurements at A) the constant flow of water and B) the constant flow of methane ... 95!
Figure 5.4 Experimental results of the methane conversion rate obtained at various flow rates
of methane and water (modified approach) ... 97!
Figure 5.5 An approximation of reaction orders using the modified approach with modified
experimental data: A) an exemplary result for the distribution of the relative standard deviation on reaction constant at a temperature of 600 oC and B) summed standard deviation for temperatures 500-700 oC ... 98!
Figure 5.6 The distribution of the relative standard deviation of reaction constant calculated
by the modified method using data from the measurement for the standard method (Series 1 and 2): all the experimental data (in A and D), data at the constant flow rate of water (in B and E), and one at the constant flow rate of methane (in C and F) at a temperature of 500 oC (in A-C) and of 700 oC (in D-F) ... 99!
Figure 5.7 The influence of the unstable partial pressure of methane for the approximation of
reaction orders by the modified approach with standard experimental data obtained at a temperature of 500 oC (in A-C) and 700 oC (in D-F) ... 102!
Figure 5.8 Conducted numerical analysis for standard and modified method with standard
and modified experimental conditions ... 103!
Figure 5.9 Arrhenius plot for the catalyst, of NiO/YSZ (60:40vol.%) prepared with ethanol
dispersant, calculated with the reaction orders calculated in accordance with the modified method ... 105!
Figure 5.10 Comparison of conversion rates obtained experimentally and calculated by
simulation for measurements in Series 1 – 3 ... 107!
Figure 5.11 Comparison of experimental and numerical molar fraction of species (in
condition of FCH4i=50 ml min-1, SC=3, NC=3); lines represent the numerical simulation
and dots present the experimental results ... 108!
Figure 5.12 Influence of temperature and the SC ratio on the methane conversion rate – a
comparison of experimental and numerical results (in conditions FCH4i=50 ml min-1,
Series 1); lines represent the numerical simulation and dots indicate the experimental results ... 108!
Figure 5.13 Influence of temperature and SC ratio for the chemical composition of outlet gas
Series 1) for A) methane, B) hydrogen, C) carbon dioxide and C) carbon monoxide; lines represent numerical simulation and the dots indicate the experimental results ... 109!
Figure 5.14 Experimentally obtained dry gas composition A) influence of temperature
(FCH4i=50 ml min-1, SC=3, NC=3), B) influence of SC rate (T=500oC, FCH4i=50 ml min-1,
Series 1) and C) influence of SC ratio (T=700oC, FCH4i=50 ml min-1, Series 1) ... 110!
Figure 5.15 An approximation of reaction orders by the modified approach with modified
experimental data: A) 550 oC, B) 600 oC, A) 650 oC and D) summed standard deviation for temperatures 550-650 oC ... 112!
Figure 6.1 Application schema of the Generalized Least Squares Method ... 117!
Figure 6.2 Schema of the GLS algorithm applied to the reaction kinetic calculations ... 118!
Figure 6.3 Structure of the variables vector with measurements u described in the front part
and unknowns x in the back part ... 123!
Figure 6.4 Fractional conversion measured experimentally over NiO/YSZ 60:40%vol
unsintered catalyst ... 126!
Figure 6.5 Preliminary calculations of the process parameters by the modified method:
analysis of standard deviation of the reaction constant at the temperature of A) 700 oC,
B) 725 oC and C) 750 oC and D) the sum of the Relative Standard Deviation (RSDsum)
with different values of parameters of reaction orders a and b for the unsintered NiO/YSZ (60:40vol.%) catalyst ... 127!
Figure 6.6 Arrhenius plot for catalyst NiO/YSZ 60:40%vol unsintered ... 128!
Figure 6.7 The outlet composition of the reformed gas over Ni/YSZ catalyst. Experimental
condition: SC = 3, NC = 3,
4
CH
i
m =50 mL min-1, wcat = 1.887 g ... 136!
Figure 6.8 Correlation plots of the measured against the calculated fractional conversions, A)
before the GLS method applied and B) after the GLS method applied ... 137!
Figure 6.9 Fractional conversion of CH4 along the reaction temperature ... 138!
Figure 7.1 The comparison of the obtained fractional conversion with ones obtained from the
proposed reaction kinetics in the published literature [32,81,116,147,148,153] in the conditions of SC = 3, NC = 3 ... 146!
Figure 7.2 The comparison of the obtained fractional conversion with the ones obtained from
the proposed reaction kinetics in the published literature [32,81,116,147,148,153] in the conditions of ... 147!
Figure 8.1 Conducted tests and the number of variables and equations included in the each
model ... 149!
Figure 8.2 Results of the analyzed tests presenting the obtained values of the parameters and
their uncertainties: A) reaction order a and B) reaction order b ... 153!
Figure 8.3 Results of the analyzed tests presenting the obtained values of the parameters and
their uncertainties: A) activation energy and B) Arrhenius constant ... 154!
Figure 8.4 Results of the analyzed tests presenting the obtained values of the parameters and
their uncertainties for the parameters of the reaction orders and the activation energy . 155!
Figure 8.5 Decrease in the volume of the covariance matrix in the projection over the axis
defining reaction order with respect to methane and activation energy ... 156!
Figure 8.6 Results of the analyzed Tests: a decrease in the final average uncertainty of the
compared with initial uncertainty of the unknown parameters of a, b, A and E ... 157!
Figure 8.7 Results of the analyzed Tests: sum of diagonal elements of the covariance matrix CVB after the application of the GLS algorithm for: A) measurements and B) unknowns:
Figure B. 1 SEM images of the catalyst powders from AGC SEIIMI CHEMICAL CO.
LTD.,: A) NiO/YSZ (60:40vol.%) and B) NiO/SDC (60:40vol.%) ... 181!
Figure B. 2 SEM images of the mechanically-crushed catalyst powders, prepared with
acetone dispersant, before conducting the experiment: A) NiO/YSZ (60:40vol.%), B) Ni/YSZ (70:30vol.%), and C) Ni/YSZ (60:40vol.%) ... 182!
Figure B. 3 SEM images of the mechanically-crushed catalyst powders prepared with acetone
dispersant, before conducting the experiment:, A) Ni/YSZ (50:50vol.%), B) Ni/YSZ (40:60vol.%) and C) Ni/YSZ (30:70vol.%) ... 183!
Figure B. 4 SEM images of catalyst powders prepared with acetone dispersant, mechanically
crushed, after conducting experiment: A) Ni/YSZ (60:40vol.%) and B) NiO/YSZ (60:40vol.%) ... 184!
Figure B. 5 Size of particles - probability density function and cumulative probability
function for catalysts: A) NiO/YSZ at the ratio of 60:40vol.%, B) Ni/YSZ at the ratio of 70:30vol.%, C) Ni/YSZ at the ratio of 60:40vol.%, D) Ni/YSZ at the ratio of 50:50vol.%, E) Ni/YSZ at the ratio of 40:60vol.% and F) Ni/YSZ at the ratio of 30:70vol.% ... 186! Figure B. 6 A) Average size of particles and B) Median of the size of the particles for laboratory prepared catalysts ... 187!
Figure C. 1 Approximation of the reaction orders by the standard approach A)-D) parameter
a and E)-H) parameter b in temperature 550oC (A, E), 575oC (B, F), 650oC (C, G) and 700oC (D, H) ... 189!
Figure C. 2 Correlation between partial pressures of methane and water at temperatures
550oC (A and E), 575oC (B and F), 650oC (C and G) and 700oC (D and H) for measurements A)-D) at the constant flow rate of steam and E)-H) at the constant flow rate of methane ... 190!
Figure C. 3 Approximation of the reactions orders using the modified approach with
modified experimental data at temperatures A) 500 oC B) 525 oC C) 550 oC D) 575 oC E) 625 oC F) 650 oC G) 675 oC and H) 700 oC ... 191!
Figure C. 4 Approximation of reaction orders using the modified approach with standard
experimental data at a constant flow rate of steam (A-C) and at a constant flow rate of methane (D-F) for the analysis in temperature 550oC (A and D), 575oC (B and E) and 650oC (C and F), ... 192!
Figure C. 5 Influence of the unstable partial pressure of methane for the approximation of
Table Captions
Table 1.1 Comparison of numerical models for SOFC ... 21!
Table 1.2 Investigations on the modelling of Solid Oxide Fuel Cells coupled with methane steam reforming systems with the approach to the reforming modelling ... 22!
Table 1.3 Comparison of the reaction kinetics parameter, reaction orders a and b, found in literatures for Ni/YSZ cermet [81,94,113,123,125,147,150–154] ... 26!
Table 3.1 Changes of the chemical species during the steam reforming process derived on the basis of the stoichiometry of the chemical reactions governing the process ... 55!
Table 4.1 Measurement uncertainty for the measured pressure difference and the averaged pressure ... 72!
Table 4.2 Composition of the standard gas used for the evaluation of the gas chromatography uncertainty ... 74!
Table 4.3 Average error and standard deviation for the measurement of the standard gas composition by gas chromatography ... 75!
Table 4.4 Details of the prepared samples with NiO and YSZ powders ... 78!
Table 4.5 Details of the experimental conditions with a lower total ... 87!
Table 4.6 Details of the experimental conditions with a higher total ... 88!
Table 5.1 Results of the calculation reaction orders a and b for different test temperatures by the standard approach ... 96!
Table 5.2 Comparison of the results of calculated reaction orders a and b by different approaches ... 104!
Table 5.3 Comparison of reaction orders parameters calculated by modified method ... 112!
Table 5.4 Comparison of reaction orders parameters calculated by standard method ... 113!
Table 5.5 Comparison of reaction orders parameters for various catalysts ... 113!
Table 5.6 Reaction orders with respect to methane a calculated by Mogensen [81] ... 115!
Table 5.7 Reaction orders with respect to methane a calculated by Iwai et all [151] ... 115!
Table 6.1 Experimental variables and correlated uncertainties ... 122!
Table 6.2 Defined unknown variables for the GLS algorithm ... 122!
Table 6.3 Analyzed results: unknown variables and variables for one of the measurement point (initial and corrected values). ... 133!
Table 6.4 Analysed results: variables for one of the measurement point (initial and corrected values and their uncertainties) ... 133!
Table 7.1 The used formula for the steam/methane reaction and derived reaction kinetics found in the literatures [4,8,11-15,17-20,22,36,40-45] ... 142!
Table 7.2 The reaction kinetics of the methane steam reforming on various catalysts derived by power-law expression by Mogensen [81] ... 145!
Table 7.3 Comparison of reaction kinetic parameters for various materials derived with respect to their microstructure by Iwai et al. [151] ... 145!
Table A. 1 Specification of devices used for building experimental setup ... 178!
Table B. 1 Results of the Free-Fall Type Dry Measurement for laboratory prepared catalysts
1 Introduction
1.1 Introduction to syngas production
In the twentieth century fossil fuels played extremely significant role, being the driving force for the development and stimulation global economies. Oil, of which the first commercial extraction is dated to 1859, rapidly dominated the transportation energy market and the chemical industry, becoming the supplier of raw material for the majority of the organic chemicals produced. The rapid development of the world economy with the leading growth in the Asian markets increased the global demand for accessible and cheap energy sources. This trend is especially immediate in the context of the depletion of extractable oil reserves. Moreover, the fact that the geographical location of 40% of the world's oil reserves lies in politically unstable regions of the Middle East is of concern for assuring the security of fuel supply. The big “oil shocks” caused by the Suez Crisis (1956), the OPEC oil embargo related to the Arab-Israeli war (1973), the Iranian Revolution and overthrow of the Shah (1979), the Gulf War (1991) and the oil price spike (2008) arise questions about the future of oil in the energy market.
Therefore, the significance of alternate fuels and emerging technologies providing novel solutions for increasing energy demand is one of the most urgent issues of modern society. One of the proposed fuels supplementary to oil is natural gas, with world wide reserves estimated at 187.1 trillion m3 (2014) [1]. Therefore, to promote and economize its applications, proper pathways to enable transportation and fluent incorporation to energy systems are necessary.
1.1.1 Syngas production methodology
processes will be introduced in the present section. There is also syngas productions considered from the gasification of biomass and coal lately. However, it will not be explained in this thesis, because it is not the major concern.
1.1.1.1 Steam reforming reaction
The steam reforming process used for hydrocarbon fuel is the most popular process adopted for syngas production. It is widely used in the industrial applications and is considered to be the largest source of produced hydrogen and synthesis gas (syngas) [2]. The steam reforming process can dedicate to other productions process of ammonia and methanol [3]. It is the gas-phase conversion of energy carrier, of which the predominant chemical composition is described by CxHyOz according to the formula provided in the following [4]:
CxHyOz+ x
( )
− z H2O→ xCO+ x − z + y 2 ⎛ ⎝⎜ ⎞ ⎠⎟H2 (1.1)The mixture of the product from the reaction is known as reformate. The reaction is endothermic and requires a supply of heat for maintaining the reforming process [4].
This methodology is used for the syngas production from various type of fuel, for example, methane [5], heavy hydrocarbon fuels such as ethane [6–10], propane [7,8,11–13] and butane [6,8,14,15] and etc. The syngas production from hydrocarbon is essentially important since the syngas is subsequently devoted to the basis of numerous chemical products and their industrial values are extensively remarkable [8]. The steam reforming of heavy hydrocarbon fuels in the production does not exist by itself and it can co-exist with numerous reaction mechanisms, dry reforming, oxidative reforming mechanisms. This is due to complex reaction steps. Thus, the development of an active catalyst to assist the reaction path and thus the process is primarily essential issue due to the occurrence of reaction hazards and catalytic deactivation due to sulphur poisoning, coking and etc.
reforming agent. The involvement of other reaction kinetics makes the syngas production process complicated. This will be introduced and explained later.
There are also attempts of the syngas production by means of steam reforming carried out on other types of fuel and those attempts are summarized in the following articles: phenol [18], methanol [19–22], ethanol [23,24], bio-ethanol [25], diesel [26], biodiesel by-product glycerol [27,28] and bio-oil [29] and etc. Dealing with this type of fuel in the steam reforming process easily invites a coking problem.
Most commonly, the steam reforming process is thus used for synthesis gas production from natural gas, in which a concentration of methane is predominant. The steam reforming reaction of methane and simultaneously occurring water-gas-shift reaction are indicated in the following formula:
Steam reforming of methane: CH4+H2O→ 3H2+ CO, ΔH0= 206.2 kJ mol-1
(1.2) Water-gas-shift reaction: CO+H2O→ H2+ CO2, ΔH0 = −41.2 kJ mol-1
(1.3)
By the summary, total reaction process can be expressed as:
CH4+2H2O→ 4H2+ CO2 (1.4)
The steam reforming reaction of methane is endothermic and the water-gas-shift reaction is mildly exothermic.
The kinetics of the steam reforming reaction has been widely and heavily studied over the years. Among such studies, Ni catalyst is the most attention-paid material due to the economical competitiveness and activity to promote the reaction [31], and numerous studies have been carried out to reveal the reaction mechanism [32] and develop reactor designs [33– 35]. Since investigations on the reaction kinetics of the steam reforming reaction on Ni catalyst have became a major interest, it is generally believed that the reaction process is dominated by the rate-determining steps. It is agreed that the reaction involves initial adsorption and decomposition of methane to “CHx (0<x<4)” species. This can be promoted by a reaction with the gas phase of H2O or adsorbed oxygen species, though disagreement can be
found over the specifics of the reaction mechanism and the nature of the rate-determining steps by methane chemisorption, surface reactions, gas phase reactions and/or the desorption of the product [3]. The first detailed study of this reaction mechanism can be found in the work of Bodrov et al [36]. Xu and Froment have developed Langmuir-Hinshelwood’s model, which is known as the classic mechanism of the steam reforming reaction [37]. They proposed that the rate-determining step is a reaction of absorbed carbon and oxygen species, and therefore reaction rate depends on partial pressures of water, methane and hydrogen. Recent works have mentioned that the rate-determining step of the process is dissociative adsorption of methane [32,38]. However, this modelling assumption is valid and constrained when the empirical expression is derived on the basis of assumed elementary steps. The detailed atomic mechanism of the steam reforming of methane is still not revealed to compensate to the perfection of Langmuir-Hinshelwood model. This means that the agreement of experimental data is not a definite proof of identifying the reaction mechanism [39]. Further work must be devoted to reveal the mechanism of the steam reforming reaction. Nowadays, the reaction rate of the methane/steam reforming reaction derived from the simplified Hinshelwood model or power law expression derived from data fitting are popularly used. More details are found in Section 3.1.
.
1.1.1.2 Dry reforming reaction
Dry reforming is an alternative methodology for syngas production instead of the steam reforming process. The following is the exemplary of drying reforming of methane indicated:
As a product of the reaction, hydrogen is produced with CO in the presence of CO2. This
further involves a water-gas-shift reaction and may cause a steam reforming reaction of methane as well.
Reaction (1.5) can occur in the presence of carbon dioxide with hydrocarbon fuel in the reaction site. The reaction is a highly endothermic and rate-determining step as the steam reforming reaction is. The heat and mass transfer limitation that can be involved in the reaction process can be treated equivalently in the same manner as the steam reforming is [3]. Several attempts can be found for the investigation of the reaction over metal and novel metal catalysts [40–50]. Ni catalyst seems to be effective catalytic components for this reaction in chemical activation [50–52], though the carbon deposition seems to be more influential on their chemical activation than that noble metals possess [40]. The reaction kinetics of the drying reforming process is studied [53–56] though the number of reported investigations is very limited compared to that of the steam reforming process [3].
This reforming process is often considered for the syngas production from biogas, mostly consisted of methane and carbon dioxide depending on the raw material used and the production conditions. Inexpensive catalytic material of Ni is often used for the dry reforming of biogas. It should be noted that there are two significant negative factors in using Ni catalyst that degrades the production efficiency of syngas and the deterioration of catalytic material; carbon deposition and the sulphur poisoning on metal and noble metal catalysts are the problems to be solved in addition to addressing the key role of dry reforming. Carbon deposition occurs over the surface of the catalyst on which the active reaction sites is kept. It is often observed in the experimentation that Ni apparently cause the deposition of carbon over the reaction site. Brus et al mentioned that the operating condition for the reactor must be carefully chosen to have a carbon free regime that can ensure the prevention of carbon deposition over the catalytic material from the thermodynamic point of view. In this way, the proposed solution is the addition of water to the reactor, which promotes steam reforming of methane in biogas together with the dry reforming [60]. There are also attempts of material development of the catalyst to avoid the carbon formation. Valenti et al suggested to add a small portion of vanadium to a Ni/Al2O3 catalyst to avoid the formation of the aluminate
spinel phase [61].
For biogas reforming over a Ni catalyst in the presence of H2S, often highly composed in
biogas, the active catalytic reaction site on the Ni catalyst is blocked by the sulphur sorption [62]. This deactivates the catalyst and is known as the most important root cause of sulphur poisoning. This chemisorption of sulphur on the Ni catalyst is considered as reversible process [63]. However, sulphur poisoning increases exponentially over the time with the reforming agents and this influences the catalytic activity of the material, of which the active surface is covered with the sulphur sorption [62]. Though its convergence at the saturated condition depends on the operating temperature, type of catalyst and partial pressure of the reactants. Catalysts with lower metal loading lose activity at a faster rate compared to catalysts with higher metal loading [64]. There is researches that report attempts on avoiding the sulphur poison problems. Quincoces et al investigated the dry reforming of methane over Ni/Al2O3 with the addition of small amount of Molybdenum (Mo). They found that the
poisoning issues. Adopting a bimetallic catalyst configuration such as Ni-Co is also considered for solving the problem connected with the sulphur poisoning [27].
As was mentioned earlier, that the dry reforming process may involve a reverse water-gas shift reaction and further the steam reforming reaction. The entire process becomes also more complicated. To properly address the problem of the fuel reforming process and optimize the operating condition are significant issues from the viewpoint of thermal engineering. For this purpose, the reaction kinetics of both steam and dry reforming reactions must be well studied.
1.1.1.3 Partial oxidation reaction
Partial oxidation is another way for syngas production. Partial oxidation reaction of methane occurs in the presence of oxygen. The reaction is slightly exothermic. The partial oxidation proceeds at high temperature (over 1100 oC), it is a so called thermal partial oxidation
reaction. Uneconomical operating conditions, at a high temperature, makes this methodology difficult to be commercialised, thus, instead, catalytically promoting the reaction process was considered, the so-called Catalytic Partial Oxidation (CPOX) reaction.
Investigations on partial oxidation reaction mechanisms have started in the middle of the XX century. However the problems connected the carbon formation in the reaction process, the difficultly of choosing operating conditions, restrictions in gas phase reaction mechanism and other hazards abandoned the development of partial oxidation technology, though it potentially could exhibit advantageous characteristics that steam reforming does not own hereditary [3], [65] . Several decades ago, activity related this topic gradually came back to the development due to the development of catalytic stabilities towards the temperature degradation and inhabitation to the carbon formation problem at a lower temperature [66–68]. However, Enger stated that the day of syngas production by means of partial oxidation mechanism is still far to be commercialized, though the catalyst development came to pre-commercialization phase [66].
popularly used catalysts, since it is believed that this enables the reaction reach to equilibrium conditions. Cobalt is the one that can exhibit active catalytic performance, yielding syngas production close to equilibrium conditions, considering the partial oxidation of methane at lower temperature, since high temperature operation causes large deactivation compared to nickel based catalysts [69].
The addition of promoters are considered a practical solution for increasing syngas production efficiency and bimetalic catalyst configuration is as well considered; All of those attempts reduce the risk of carbon formation in the active reaction site and to decrease operating temperatures.
The partial oxidation is mildly exothermic and very fast reaction. This enables the CPOX system to be more practical and beneficial in the light of building reactor plants, which are energy-efficient and wide range in scale. The partial oxidation reaction is denoted in the following formula:
CH4+1
2O2→ CO + 2H2, ΔH
0= −36 kJ mol-1
(1.6)
The reaction occurs at the condition in which the amount of oxygen is insufficient to decompose the entire amount of methane supplied. Prettre et al found that an over-supply of oxygen to methane results in the complete oxidation of methane [70]:
CH4+2O2→ CO2+ 2H2O, ΔH
0= −803 kJ mol-1 (1.7)
The yields of syngas, however, can not be predicted precisely from this observation. The DPO mechanism was found throughout the investigation done by Hickman and co-workers [71–75]. This mechanism is based on microscopic observation in the process; surface reactions that can occur on the reaction site of the catalyst, which heavily depending on the used metals or noble metals, is well taken into consideration [3].
The CPOX process can be affected by the carbon formation over the active surface area of a used catalyst. The unfavourable ratio of hydrogen-to-carbon monoxide can result in this particular problem. Increasing selectivity of hydrogen on the reaction site (carbon monoxide dominates hydrogen among the products of the process) is likely keen for preventing the carbon formation.
Devotion in the catalyst development can be noticeably found on this research topic. Investigating the reaction kinetics on those catalysts is also important, however, this process is faster and the conditioning of the operating setup seems to be more significant once the development reaches the commercialisation phase.
1.1.2 Application to the power generation sector
Syngas production from fossil fuel is usually applied in two different fields of industry: the chemical and the power generation sectors. As was mentioned earlier, syngas is an important source for numerous chemical productions. On the other hand, the syngas production becomes more significant today in light of power generation applications.
system, attention on the development of distributed power generation systems is being paid to increase energy security and to answer the complex demands of network. The advantage of a distributed network system is that it can use the already-existing infrastructure such as city-gas pipelines and etc. They can also use the potential benefits of fuel cells (FC), which are considered as the most expected and highly efficient power source.
Hydrogen and syngas production by means of the steam reforming process can greatly incorporate fuel cells for their installations in the distributed grid network, and is literally a key solution for introducing the commercialization phase of fuel cell technologies.
1.2 Solid Oxide Fuel Cells
The Solid Oxide Fuel Cells (SOFCs) systems, with their high operating temperature, fuel flexibility [76] and simplicity of connection with city-gas infrastructures, advertise their potential and promote themselves to have numerous application possibilities in different sectors of industries. As the devices, which directly convert the chemical energy of fuel into electricity, they have the potential to be economically competitive technology that can provide higher electrical efficiency in comparison to the commonly used solutions. The high efficiency is related with the principle of direct energy conversion with small losses and is supported by the high operating temperature of SOFCs. Exemplary applications include large scale projects such as cogeneration power plants [77], as well as smaller units applied to refrigerated tracks, hybrid ships or remote power generators [78].
The original idea of SOFC, the basic principle and materials were proposed by Nernst and his colleagues at the end of 19th century and the first application is dated from the beginning of
the 1960s, when NASA used SOFC on board of the Apollo space shuttle.
The principle of operation of Fuel Cells is similar to batteries with the combination of electrochemical reactions in order to generate electricity without the direct combustion of fuel as an intermediate step. Contrary to batteries, the power production in the fuel cells is continued as long as the supply of fuel and oxidant is provided.
The general electrochemical process dominant in SOFC is the oxidation of hydrogen via two half-cell reactions [80]: Anode reaction: H2+O2−→ H 2O+ 2e − (1.8) Cathode reaction: 1 2O2+2e −→ O2− (1.9)
The overall reaction in the cell is summarized as:
Overall cell reaction: H2+1
2O 2→ H2O (1.10)
Figure 1.1 Schematic configuration of a Solid Oxide Fuel Cell in the tubular configuration and its
SOFC provides only water and heat as by-products of the electrochemical reactions, makes it clean and environmentally friendly power source. However, if the cell is supplied by the fuel consisting carbon oxide and hydrocarbons (exemplary methane), the additional reactions occurs on anode side:
CO + O2−→ CO2+ 2e − (1.11) 1 2CH4+ 2O 2−→ H 2O+ 1 2CO2+ 4e − (1.12)
The maximum voltage provided by the preceding reactions is limited and with increasing current it significantly decreases [81]. In order to increase the voltage for the industrial application of SOFC, singular cells are connected into a cell stack by an interconnect.
The development of SOFC Systems is gradually shifting to the phase of initial commercialization (in the case of small-scale systems such as for residential use). Though there are still issues to overcome for commercialization of the larger-scale systems, which will take an important role in grid network. Current research on the topic is being carried out by both the industrial and academic sectors. Concerning commercial research and development projects, exemplary are the SOFC tubular cells for high efficiency hybrid power generation systems by Mitsubishi Hitachi Power Systems [82], SOFC for auxiliary units in automobiles and tractor-trailers developed by Delphi Automotive Systems [83,84].
1.3 Fuel Processing for Solid Oxide Fuel Cell
Low-temperature, proton-exchange membrane (PEM) fuel cells have very high requirements concerning the quality and purity of the supplied hydrogen. Therefore, in order to fuel them by hydrocarbons, a complex external reforming system, consisting of a fuel reformer, a shift reactor and clean-up devices, is necessary prior to the fuel cell [89].
On the other hand, the high operating temperature of the SOFC cell eliminates the necessity of the external heat source (in Fig. 1.2A) for the strongly endothermic reforming reaction. The high-temperature heat, which is a buy-product of SOFC (except for electrical power), is resulted from their elevated operating temperature and can be used directly to maintain reforming reactions. Regarding this advantage, coupling of the reforming process with SOFCs is a beneficial solution for hydrogen production in fuel cell technology and high exergy efficiency. Internal reforming of the fuel can be achieved by the indirect method using a separated reforming system installed within SOFC stack (in Fig. 1.2C) or by the internal direct reforming process which is conducted directly on the anode (in Fig. 1.2B). Internal reforming can be also constituted from both direct and indirect configuration, when part of the hydrocarbons is converted to synthesis gas by the separate module within the fuel cell with the balance of the fuel reforming occurring directly on the anode.
The internal reforming system is beneficial compared with the external configuration because of the great increase of the overall efficiency of the system compared with low-temperature fuel cells. An additional advantage is reducing the complexity of the system and hence reducing the initial and operational cost [78]. Moreover, the excess heat, not used in the reforming system, can be further applied for the gas turbine and finally in the combined heat and power (CHP) system. The maximum utilization of the heat induces further increases of system efficiency. Figure 1.3. shows a exemplary heat flow in the advanced internally reforming SOFC system with adsorption of heat by reforming. Regarding all of preceding points, many recent studies are focused on fuel reforming issues, which is a topic vital for the development of SOFC and their industrial applications.
of SOFC, makes them suited for both small-scale applications, stand-alone systems in remote areas and larger CHP and hybrid gas turbine systems.
A"
B"
C"
Figure 1.2 Fuel processing for Fuel Cell: A) External Reforming System, B) Direct Internal
Reforming System, and C) Indirect Internal Reforming System
Hydrocarbon*Fuel* and*Steam*
SOFC%Stack%
Internal* Reformer*
Heat* Heat* Gas*
Turbine*
Heat*(for*hot*water)*
Despite many advantages several issues have to be solved in order to couple of fuel reforming module and SOFC. A poorly designed system can suffer from the problems of deactivation and loss in cell performance, material failures and reduced cell durability. In the case of the internal reforming, hydrocarbon pyrolysis can occur and, as a result, the carbon deposition can affect the catalytic material. Methane and higher hydrocarbon steam reforming is a fast, highly endothermic reaction and when it is coupled with slow, exothermic fuel cell reactions, there can be potential instability. Additionally, during the start-up condition the reforming reactions can not be thermally self-maintained, because of the heat from stack is not sufficient to supply the fuel reforming requirements [89].
The direct internal reforming system can potentially assure the highest possible efficiency of the overall system by reducing the necessary energy transmission steps and the complexity of design [90]. However, the material requirements and thermodynamic management of the anode reaction are crucial issues. The anode composite has to fulfil the following points: it must to have catalytic properties for the reforming reaction, it has to be electrocatalyst, supporting the electrochemical oxidation of hydrogen and carbon monoxide to water and carbon dioxide and has to have proper electrical conduciveness. One of the major issues in this system configuration is the rapid cooling effect appearing in the inlet of the cell, which generates the step temperature gradient. The inhomogeneous temperature distribution along the cell is difficult to control and can cause the cracking of anode and electrolyte. In developing the internal direct reforming system the major challenge currently is the development and investigation focused on the material issues.
Hydrocarbon* fuel* Steam* Anode& Anode& CO+H2* C+H2* Anode&+O2*& Anode&+O2*& Carbon&deposi2on& H2O*+*Power* CO2+H2O*+*Power* Hydrocarbon* fuel* Excess*Steam* Internal& Reformer& CO+H2* Anode&+O2*& Anode&+O2*& CO2+H2O*+*Power* CO2+H2* +H2O& CO2+H2O*+*Power*
A&
B&
Figure 1.4 Possible reaction pathways in A) SOFC with direct internal reforming system B) indirect
reforming system coupled with SOFC
The potential reaction pathways deriving the effects observed in the internal direct and indirect reforming systems are presented in Fig. 1.4. Generally, when the hydrocarbons are used to directly fuel the SOFC stack, pre-reforming of the fuel to the form when only methane is remaining is necessary. Fuelling SOFC with higher hydrocarbons would cause the carbon deposition in the stack because of the susceptibility of the anode to the pyrolysis of higher hydrocarbons. The build-up of carbon on the anode leads to the deactivation of the cell [91– 93]. The probability of the carbon deposition is especially high in the low stem-to-carbon ratio [94], on the other hand, when the steam partial pressure is high, sintering of nickel anode particles can occur. This later causes a loss in the cell performance because of the decrease of the catalytic activity of the anode [95]. Therefore, in the case of SOFC development the biggest impact is on the methane/steam reforming kinetic and this process will be discussed within the scope of this thesis.
1.4 Models of SOFC coupled with reforming of fuel
are often used for the interpretation of experimental results [110] and determining the interest area for conducting future research [111]. In the case of a SOFC system it is difficult to measure the specific conditions for the temperature and distribution of the chemical species along the cells; the modelling techniques are indispensable tool to research those issues and predict the occurrence of hotspots [112–114] and the determination of optimal operation conditions and control strategies [115,116].
The modelling of all phenomena, which are influential for the behaviour of the SOFC stack, is very complex and numerical models are robust and require high computational power. Therefore, the usually proposed models focus on one or several issues and can be divided by their main interest into three general categories: micro models, cell/stack models and system models [39]. Properties of every approach with the exemplary studies are summarized in Table1.1.
the kinetic equation of methane/steam reforming a variety of assumed reaction kinetics can be observed. The most typical used kinetic equations are those derived by Achenbach and Riensche [123] and Lehnert et al. [110,124]. Unfortunately both of them are subjected to considerable inadequacies. Achenbach and Riensche kinetic equation was derived for the catalyst characterized by the relatively small, in the context of SOFC materials, 20% nickel content weight percentage (on ZrO2) and experimentation was conducted on the thick anode
that did not fulfil the electrochemical requirements for the SOFCs. This approach assumes first order dependency on methane partial pressure and no influence of partial pressure of steam for the reaction rate. It is consistent with the values of the reaction orders derived by Achenbach and Riensche: one for the reaction order with respect to the partial pressure of the methane and zero for the reaction order with respect to steam partial pressure [123]. Compared with other models, it gives a slightly higher than average results for the reaction rate [39]. Lehnert et al. expression on the other hand, assumes first order dependencies for both methane and water, what is rarely visible in other experimental studies and derived reaction kinetics [39].
Among the studies focused on the microstructure model of fuel cell, some incorporate reforming kinetic models based on the complete set of all 42 elementary reactions consisting on the process [128]. Every reaction is described by a separate kinetic expression. This method depends on the accuracy of the modelling of anode microstructure and gas diffusion [39]. The disadvantage of this methodology is the fact that kinetic data sets are taken from a variety of sources and have to be modified by optimizing procedures to assure thermodynamic consistency. In the case of complicated optimization problems and modelling of the system with an SOFC unit this approach is difficult to introduce because of its high computer power demand.
A"
B"
C"
D"
Figure 1.5 Influence of the assumed reaction kinetic model for A) current density and Nernst voltage
distribution, B) methane, hydrogen and carbon monoxide distribution, C) temperature distribution of IEA 2 gas D) temperature difference between the predicted temperature difference for IEA1 and IEA2
Table 1.1 Comparison of numerical models for SOFC
Micro model Cell/stack model System model
Principle Detailed analysis of physicochemical
phenomena
General model of single cell or stack of cells Analysis of performance in the complex system
Application Material research, Microstructure
optimization Concentration and temperature profiles, Identify hotspots and potential carbon deposition Design and optimization of the systems including SOFC
Complexity of the model
One dimension; detailed description including mass and heat transfer in porous electrodes and electrical conduction
Two or Three dimension; simplified description of electrodes and electrolyte; sometimes include microstructure
Zero or One dimension; high
simplification, focus on interaction with surrounding
Examples ! Experimental and modelling
investigation on methane reforming kinetics within Ni-YSZ SOFC anode support, Hecht (2005) [128]
! Prediction of tortuosity of SOFC anode from mass transport model and saturation currents, Brus (2014) [129] ! Review of simulation of composite electrodes for SOFC with example of calculation of methane reforming for Ni/YSZ cermet, Sunde (2000) [111] ! Effect of microstructure and thickness on performance of SOFC, Li (2014) [130]
! Macro/micro structure parameters influence for methane fuelled single
! 2D model of internal indirect reforming tubular SOFC, Nishino (2006) [131]
! Sensitivity analysis for SOFC with internal direct reforming fed by various fuels, Nagel (2008) [100]
! 3D model of planar SOFC with internal direct methane reforming for analysis of carbon formation and thermal stress, Nikooyeh (2007) [114]
! CFD 2D elliptic model of SOFC with direct internal reforming, Janardhanan (2006) [132] ! Comparison of Planar SOFC Models, Campanari (2005) [133]
! 3D model model of APU SOFC stack under transient operation, Al-Masri (2014) [134]
! SOFC model for system simulation, Bove (2005) [136,137]
! 0D planar SOFC model with internal direct reforming, Petersen (2006) [138] ! Energy analysis of SOFC system fed by syngas, De Lorenzo (2015) [139] ! Influence of reformer fault for SOFC system, Greco (2014) [140]
! SOFC triple combined cycle for natural gas with photovoltaic, Obara (2015) [101]
! SOFC-GT system fed by liquid fuels (internal and external reformer), Santin (2010) [102]
Table 1.2 Investigations on the modelling of Solid Oxide Fuel Cells coupled with methane steam
reforming systems with the approach to the reforming modelling
Study Focus of the study Approach to methane reforming
modelling Simplified approach
Costamagna (1996) [117]
Experimental and modelling on partial oxidation of CH4 in SOFC
Chemical equilibrium of the
reforming reactions into the gaseous anodic stream evaluated at solid temperature
Pfafferodt
(2005) [118] Prediction of suitable operating range of SOFC for an Auxiliary Power Unit
Chemical equilibrium of the gas phase reaction; finite reaction kinetic
fulfilling the thermodynamic equilibrium condition
Sidwell (2005)
[119] Limitation of electrical efficiency in hydrocarbon fuelled SOFCs Molar flow into volume reaches equilibrium immediately, rate at which every species is created is difference between entering and equilibrium mixture flows; Gibbs minimization
Apfel (2006) [121]
Thermal start-up and management of SOFC
75% of the remaining methane fraction is reformed in each of the 20 finite elements of stack
Chan (2003)
[120] Model of SOFC- gas turbine hybrid system Equilibrium conditions applied for the process Demin (1992)
[122]
Thermodynamic analysis of SOFC system fed by methane
Equilibrium conditions coupled with thermodynamic analysis
Petersen (2006) [138]
Zero dimensional model of planar SOFC with internal direct
reforming of methane
Chemical equilibrium conditions
Kinetic rate expression
Sucipta (2007) [141]
SOFC-MGT hybrid system fuelled by gasified biomass
Achenbach model [116,123] Komatsu
(2010) [103]
Analysis of system with SOFC and micro-gas turbine in part load operation
Achenbach model [116,123]
Komatsu
(2013) [115] Dynamic behaviour of SOFC with power output control scheme and load following operation
Study Focus of the study Approach to methane reforming modelling
Kinetic rate expression
Nagel (2008) [100]
Sensitivity analysis for SOFC fuelled by various fuels
Various calculation models: ! Equilibrium equation
! Achenbach model [116,123] ! Ahmed and Foger model [125] ! Leinfelder model [126]
! Drescher model [127] Nikooyeh
(2007) [114]
Analysis of carbon formation and thermal stress in planar SOFC with internal direct methane reforming
Achenbach model [116,123]
Sunde (2000) [111]
Simulation of electrodes in Fuel Cell
Achenbach model [123] Campanari
(2005) [133]
Comparison of models for simulating planar cell geometry
Achenbach model [116,123] Klein (2007)
[96] Modelling SOFC fuelled by methane Lehnert model [110,124] Klein (2008)
[142] Gradual internal reforming without coking in SOFC fuelled by methane Lehnert model [110,124] Haberman
(2004) [98]
Chemically reacting gas flow in the porous structure of SOFC
Lehnert model [110,124] Gemmen
(2006) [143]
Coal syngas transport in anode of SOFC
Lehnert model [110,124] Ni (2008)
[144]
Comparison of proton and ion conducting electrolytes for SOFC
Lehnert model [110,124] Ni (2008)
[145]
Pressure gradient in SOFC modelling
Lehnert model [110,124] Hosseini
(2013) [99]
Combined effects of macro/micro structure on methane fuelled SOFC
Ahmed and Foger model [125] Nagata (2001)
[146] Output characteristics of tubular SOFC with internal reformer Odegard model [147] Nishino
(2006) [131]
Numerical modelling of indirect internal reforming tubular SOFC
Odegard model [147] Nishino
(2010) [58]
Numerical simulation of cell-based indirect internal reforming tubular SOFC operated with biogas
Study Focus of the study Approach to methane reforming modelling
Kinetic expression measured for the specific cell
Yakabe (2001) [113]
3-D model of planar SOFC Power-law kinetic expression measured for Ni/YSZ cermet
Lehnert (2000) [110]
Gas transport phenomena in SOFC anodes
Volumetric reaction rate on Ni/8YSZ cermet anode; described in [124] Achenbach
(1994) [116]
3D time-dependent simulation of SOFC
The unity reaction order of CH4 and
no influence of vapour partial pressure; results form experimentation on nickel cermet
Brus (2012) [148]
Chemically reacting gas flow in the porous structure of internal reformer of SOFC system
Power-law kinetic expression measured on Ni/YSZ catalyst material by AGC Seimi Chemical CO
Kinetic model for complete set of 42 elementary reactions
Hecht (2005) [128]
Methane reforming kinetic within anode support
Kinetic data set taken from variety of sources modified by optimizing procedure to assure thermodynamic consistency
Janardhanan
(2006) [132] CFD analysis of SOFC with internal direct reforming – interactions of transport, heterogeneous catalysis and electrochemical processes
Chemical reaction mechanisms, in particular for heterogeneous (gas/solid) catalytic systems, developed by the research group of Olaf Deutschmann [149]
1.5 Methane/Steam Reforming kinetics investigations 1.5.1 Nickel catalyst and SOFC applications
application on the other hand, the most common support is YSZ. The Ni content is varied from around 5% in the industrial catalyst and around 40%vol in the SOFC anodes. Industrial high scale application usually uses the Ni particle size in the range 5-10 nm, while in the case of SOFC typical size of fine grains is about 1 µm [81]. All of those properties induce the differences in the performance and methane/steam reaction rate for both types of catalyst. Therefore, wide research [39] focused on the industrial catalysts, which were performed in the condition and material far from the SOFC typical standards, can not be directly transferred for the applications in the SOFC systems with internal fuel reforming [81]. Further, only a limited amount of research was focused on SOFC dedicated materials in the context of methane/steam reforming.
1.5.2 Necessity of the reliable reforming kinetic description
Widespread disagreements between kinetic of the reforming proceeded on the typical industrial catalysts in spite of the extensive research in the field and lack of suitable kinetic on real SOFC anode materials, induce the necessity for reliable data dedicated to SOFC design. It is crucial in the context of the great influence of the implemented reforming kinetic model for the properties and performance of the overall SOFC modelling [100].
The mathematical forms of expression describing the highly non-linear kinetics of the reforming process are not consistent among themselves. The kinetic description is addressed by the various numerical models, which can be divided into three basic concepts: [32,37,39,148]:
• General Langmuir-Hinshelwood kinetics [37],
• first order reaction with respect to methane [32,123,150]
• power law expressions derived from data fitting [113,125,147,148,151–153].

![Figure 3.1 Sequence of the elementary steps for the methane steam reforming on the Ni catalyst according to Wei and Iglesia [32]](https://thumb-ap.123doks.com/thumbv2/123deta/9766163.1850167/64.892.130.777.507.930/figure-sequence-elementary-methane-reforming-catalyst-according-iglesia.webp)
![Figure 3.2 Schema of plug flow reactor: a differential volume element dV r with flow rate F and fractional conversion f of the limiting reactant A [199]](https://thumb-ap.123doks.com/thumbv2/123deta/9766163.1850167/69.892.175.767.114.368/figure-schema-reactor-differential-fractional-conversion-limiting-reactant.webp)