Shibaura Institute of Technology
Distribution Network Loss Minimization via Artificial Immune Bee Colony
2014/SEPTEMBER
DISTRIBUTION NETWORK LOSS MINIMIZATION VIA ARTIFICIAL IMMUNE BEE COLONY
MOHD NABIL BIN MUHTAZARUDDIN
Supervisor Prof. Dr. Goro Fujita
A thesis submitted in fulfilment of the requirements for the award of the degree of
Doctor of Engineering
Shibaura Institute of Technology
Specially dedicated to my beloved family:
Muhtazaruddin, Rismawaty,Zaredah, Mohd Hadri, Husna Asila, Husna Najiha, Husna Nabiha, Muhammad Zahin, Husna Kamilah, Muhammad Luqman Hakim,
Danish Hakim, Muhammad Naufal, Marissa Elyna You are both my strengths and inspirations.
ACKNOWLEDGEMENTS
In the name of Allah, most Gracious and Merciful. I am very grateful with his permission; I was able to accomplish my Doctoral thesis.
A special thanks to my supervisor, Prof. Dr. Goro Fujita from Department of Electrical Engineering, Shibaura Institute of Technology. His insightful comments, guidance and all the useful discussion are very much appreciated. Without his encouragement and persistent help, this thesis would not have been possible. Not forgetting my defense committee members: Prof. Dr. Satoshi Matsumoto, Prof. Dr. Harukazu Igarashi, Prof. Dr. Hiroshi Takami and Prof. Dr. Yoshikazu Fukuyama. Thank you for your attention, advices and constructive feedback.
Very special thanks to Shibaura Institute of Technology and Universiti Teknologi Malaysia for giving me opportunity to carry out doctoral program for their scholarship support and also to all my friends; Dr. Jasrul, Ariff, Dan vu, Dr. Tuyen and those who supported me during the completion of the thesis. Thank you so much.
ABSTRACT
TABLE OF CONTENTS
CHAPTER TITLE PAGE
ACKNOWLEDGEMENTS iii
ABSTRACT iv
TABLE OF CONTENTS v
LIST OF TABLES viii
LIST OF FIGURES ix
LIST OF SYMBOLS xi
LIST OF ABBREVIATIONS xii
LIST OF APPENDICES xiv
1 INTRODUCTION 1 1.1 Research Background 1 1.2 Research Questions 2 1.3 Problem Statement 3 1.4 Research Objectives 4 1.5 Scope of Work 5
1.6 Significance of the Research 5
1.6 Thesis Organization 6
2 LITERATURE REVIEW 7
2.1 Introduction 7
2.2 Network Reconfiguration 7
2.3 Installation of Distributed Generation in Distribution System
8 2.4 Previous Research Works on Distributed
Generation Coordination
11 2.5 Previous Research Works on Network
Reconfiguration
2.6 Previous Research Works on Network Reconfiguration network with DG Coordination
17
2.7 Conclusion 18
3 ARTIFICIAL IMMUNE BEE COLONY 20
3.1 Introduction 20
3.2 Overview of Meta-Heuristic Method 20
3.3 Artificial Bee Colony 22
3.4 Artificial Immune Bee Colony 25
3.5 Conclusion 28
4 DETERMINATION OF OPTIMAL OUTPUT
POWER AND LOCATION OF DG BY USING AIBC
29
4.1 Introduction 29
4.2 Problem Formulation to minimize Power Losses
29 4.3 Related Data for 33-bus and 69-bus Test
System for DG Coordination
37 4.4 Comparison of Performance between AIBC
and ABC
38 4.5 Comparison between Simultaneous and
Separate Analysis in DG Coordination
45
4.6 Comparison with other Methods 51
4.7 Conclusion 52
5 LOSS MINIMIZATION VIA NETWORK
RECONFIGURATION WITH DISTRIBUTED GENERATION COORDINATION
53
5.1 Introduction 53
5.2 Problem Formulation for Minimal System Power Losses
5.3 Related Data for 33-bus and 69-bus Test System for DG Coordination with Network Reconfiguration
55
5.4 Solutions for Harmonization between DG and Network Reconfiguration
57
5.5 Conclusion 65
6 CONCLUSIONS AND RECOMMENDATION 66
6.1 Overall Conclusion 66
6.2 Contributions 67
6.3 Future Work 67
REFERENCES 69 -74
LIST OF TABLES
TABLE NO. TITLE PAGE
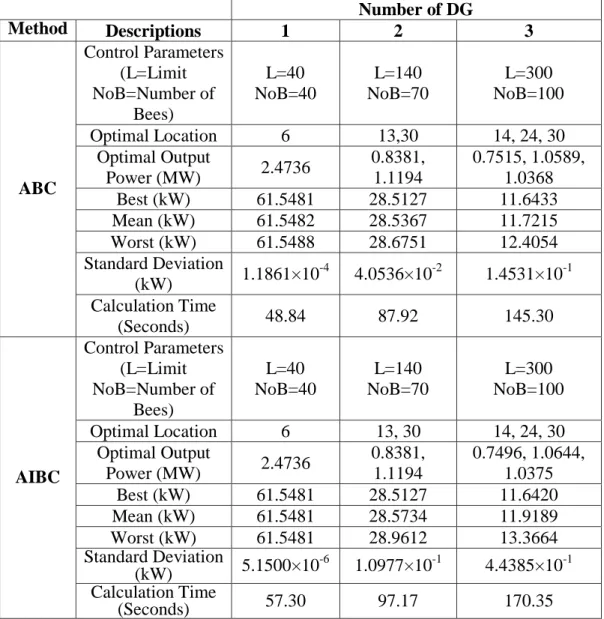
3.1 Comparison of pseudo code for each algorithm 28 4.1 Summary of Results between ABC and AIBC for
33-bus system
39
4.2 Summary of Results between ABC and AIBC for 69-bus system
42
4.3 Description for case studies in comparison of simultaneous and separate analysis
46
4.4 Summary of results of 33-bus system for comparison of simultaneous and separate analysis
46
4.5 Summary of results of 69-bus system for comparison of simultaneous and separate analysis
49
4.6 Comparison with other methods for 33-bus and 69-bus test system
52
5.1 Description for case studies in DG coordination with Network Reconfiguration
58
5.2 Summary of results of 33-bus system for DG coordination and network reconfiguration
59
5.3 Comparison of different parameter settings for Case 5 63
5.4 Comparison with other method available in literature review
LIST OF FIGURES
FIGURE NO. TITLE PAGE
2.1 An example of network reconfiguration process 8
2.2 An example installation of DG 10
3.1 Behavior of bees finding the food sources 22
3.2 Basic flow chart of ABC 23
3.3 Example of bees finding the foods 25
3.4 Basic flow chart of AIS 27
3.5 Basic flow chart of AIBC 27
4.1 Simple test system 30
4.2 Simple test system with DG 32
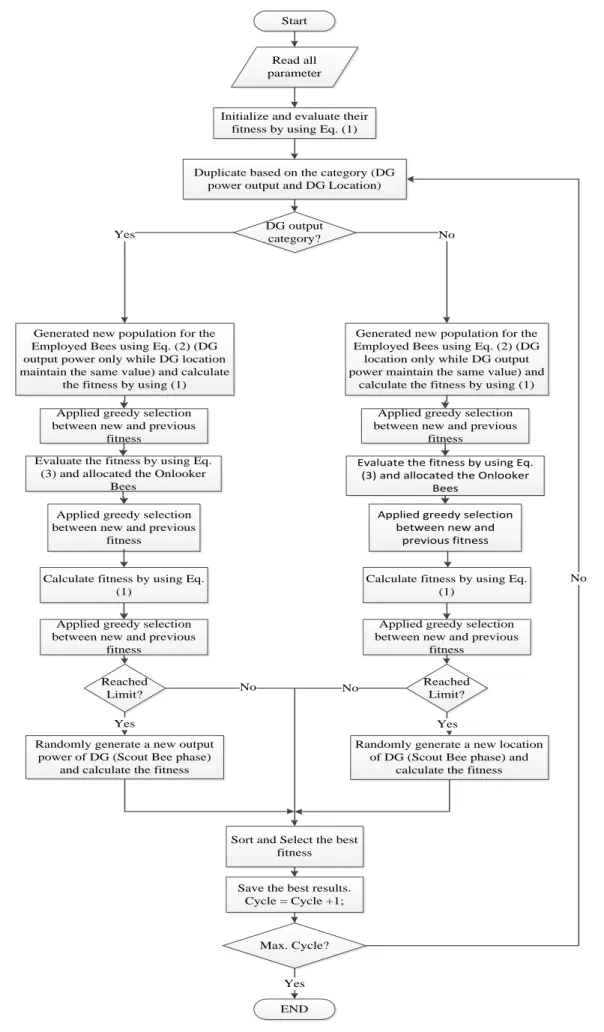
4.3 Flow chart of AIBC to determine optimal DG coordination
36
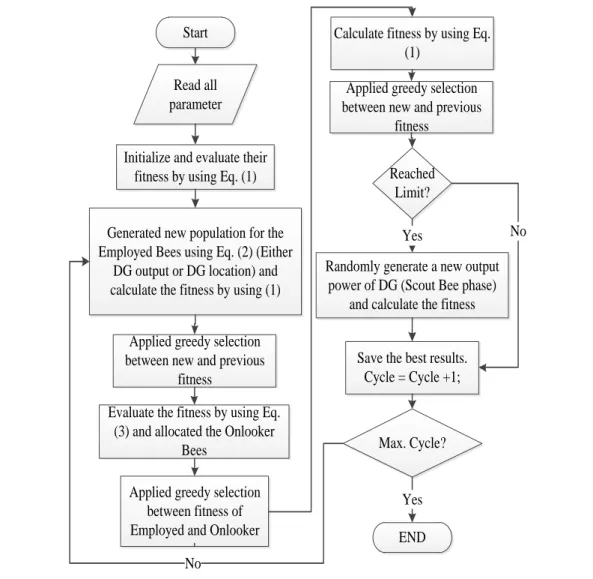
4.4 Flow chart of ABC to determine optimal DG coordination
37
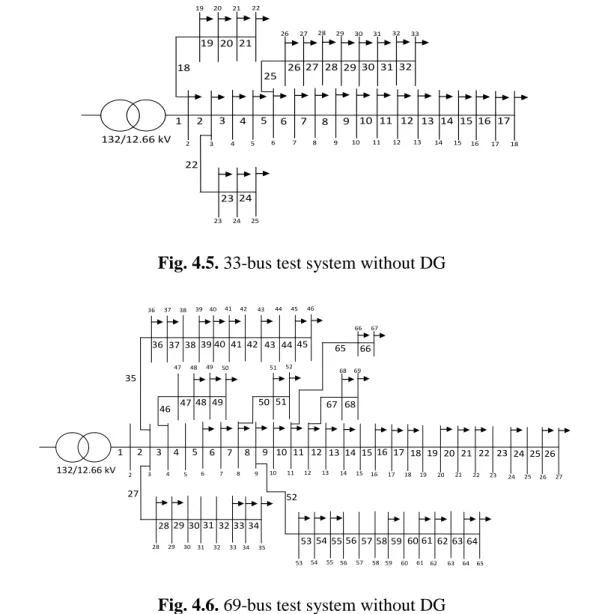
4.5 33-bus test system without DG 38
4.6 69-bus test system without DG 38
4.7 Comparison of convergence curves between ABC and AIBC on 33-bus
40
4.8 Comparison of voltage profiles between ABC and AIBC on 33-bus system
41
4.9 Comparison of optimal location of DG between ABC and AIBC on 33-bus system
4.10 Comparison of convergence curves between ABC and AIBC on 69-bus
43
4.11 Comparison of voltage profiles between ABC and AIBC on 69-bus system
44
4.12 Comparison of optimal location of DG between ABC and AIBC on 69-bus system
44
4.13 Comparison of optimal location of DG between case 2 and case 3 on 33-bus system
47
4.14 Comparison of voltage profiles for all cases on 33-bus system
47
4.15 Line losses of 33-bus 48
4.16 Comparison of optimal location of DG between case 2 and case 3 on 69-bus system
49
4.17 Comparison of voltage profiles for all cases on 69-bus system
50
4.18 Line losses of 69-bus 51
5.1 Flow chart of AIBC to determine optimal DG coordination with network reconfiguration
56
5.2 33-bus test system with optional lines 57
5.3 Final results for case 5 60
5.4 Comparison of voltage profiles for all cases on 33-bus system
61
5.5 Comparison of stability index for all cases on 33-bus system
LIST OF SYMBOLS
FV - Fitness Value
Ob. Func - Objective Function
xijnew - New value of variable
xijold - Old value of variable
xkj - Neighbour value that is selected randomly
range(0,1) - Random value between 0 and 1
probi - Probability value
N - Total number of employed bees
x1 - DG output power x2 - DG location nbr - Number of lines I - Current i - Line number R - resistance n - Bus number
PDG,min - Lower bound of DG output power
PDG,max - Upper bound of DG output power
PDG - DG output power
Vn,min - Minimum allowable voltage
Vn,max - Maximum allowable voltage
Vn - Voltage at each bus
tdg - Total number of DG
tl - Total number of load
Pload - total amount of load consume at each bus
Psubstation - Power from substation
LIST OF ABBREVIATIONS
ABC - Artificial Bees Colony ACO - Ant Colony Optimization AIS - Artificial Immune System AIBC - Artificial Immune Bee Colony ANN - Artificial Neural Network ACSA - Ant Colony Search Algorithm BPSO - Binary Particle Swarm Optimization C-VSI - Combined-Voltage Stability Index DDG - Dispatchable Distributed Generation DE - Differential Evolution
DG - Distributed Generation EP - Evolutionary Programming
EP-ACO Evolutionary Programming-Ant Colony Optimization FA - Firefly Algorithm
GA - Genetic Algorithm
GA-PSO - Hybrid Genetic Algorithm - Particle Swarm Optimization HDE - Hybrid Differential Evolution
HSA - Harmony Search Algorithm
NDDG - Non-Dispatchable Distributed Generation
PQ - Power-Reactive
PSO - Particle Swarm Optimization
PV - Power-Voltage
QIEP - Quantum-Inspired Evolutionary Programming RPF - Reverse Power Flow
SA Simulated Annealing
TS - Tabu Search
LIST OF APPENDICES
APPENDIX TITLE PAGE
A Comparison of Mutation Process Between ABC and AIBC
75
B Data for 33-bus Test System 76
C Data for 69-bus Test System 78
D Data for 33-bus Test System Including Tie Lines
80
CHAPTER 1
INTRODUCTION
1.1 Research Background
The classic power system model consists of three important components, namely generation, transmission line and distribution system. The components are interdependent to ensure the generated power can be transmitted from the generation to the distribution system/demand via the transmission line. In addition, the power system is designed to works with unidirectional power flow due to lack of power source except in the generation component only. However, as the demands are expected to escalate in the future, one of the possible solutions could be done is to ameliorate the entire power system performance [1]. Concerning to this solution, it will require intensive planning to all the components; thus, increasing the overall cost of the power system. On the contrary, introduction of micro grid concept [2] offers an interesting solution to integrate small capacity of Distributed Generation (DG) in the distribution system instead of rely solely on centralized generation schemes, thereby reducing the necessary improvements made in the generation and the transmission lines.
be done to maintain the efficiency of the distribution system. There several approaches which are commonly proposed by researchers to reduce the power losses; either network reconfiguration or installing capacitors or installing DGs. However, the advantage of these approaches can be achieved if they are carefully coordinated in the distribution system.
There are several groups which have been used to solve coordination problems such as analytical, heuristic and meta-heuristic technique, where each of the groups has its own advantages and shortcomings [6].Among these groups, the meta-heuristic are more prominent in solving the coordination problems due to robustness and simple to implement [6]. There are several of methods that have been introduced under the meta-heuristic group such as Simulated Annealing (SA) [7], Genetic Algorithm (GA) [8], Particle Swarm Optimization (PSO) [9], Ant Colony Optimization (ACO) [10] and Artificial Bee Colony (ABC) [11]. Additionally, some authors have also proposed hybridized optimization methods by combining two optimization techniques to cancel out the discrepancies of each for achieving better solutions. Almost all of these methods were inspired by natural life [12].
Recently, some studies have been done by a number of researchers to harmonize between the two approaches as an example to solve coordination between the DG and the capacitors, simultaneously. Means, the location and size of the DG and the capacitor are determined simultaneously by using one approach. One significant advantage when combining this approach is the reduction of the power loss can be obtained more than if executed separately. Nevertheless, the proper method needed to solve the problem of combination of the two approaches so that a better solution can be obtained. Therefore, investigation of optimal coordination between the DG with network reconfiguration should be carried out to achieve better performance in distribution system.
1.2 Research Questions
load demands, which increase significantly year by year. However, the progress in enhancing the efficiency of the system is hindered by one major factor that is the existence of high real power losses. Furthermore, the current trend of electrical energy tariff is showing signs of increment and it is expected to escalate in the future; hence, increasing the significance of power reduction. Consequently, many researchers have devoted their effort to find the possible solution to minimize the power losses whilst retaining the stability and security of the system.
There are several approaches suggested by researches to deal with the reduction of power losses such as determining optimal DG coordination (output power and location), capacitor coordination (size and location) and network reconfiguration. However, the incorrect use of these approaches might deteriorate the system’s performance and appear operational and planning problems of the distribution system. The aim of this research is to find a solution that can harmonize the network reconfiguration with DG coordination in order to further reduce the power loss in the distribution network.
Several research questions that will arise when analyzing the effect of combining the approaches on the distribution system are listed below:
i. What is the appropriate method that can be applied to solve the coordination problems?
ii. Which combination gives the best impact to the distribution system?
iii. What happens to the performance of voltage profile and stability index when the coordination is performed on the system?
All the questions raised will be analysed and discussed later.
1.3 Problem Statement
challenges faced by engineers is to achieve a more economical distribution network through reduction of power loss. In addition, basic nature of the distribution network itself that has a low X/R ratio lead the distribution system have more impact on the power loss and voltage profile compared with the transmission line [3, 13].
As previously discussed, there are several approaches have been done to solve the problem. Generally, these solutions are done separately, which means power losses reduction is achieved either by using network reconfiguration or via DGs coordination or via capacitors coordination. Thus, the solution might be trapped in a local optimum (meaning that there is a better solution - the global optimum) since the solution to determine one approach (for example: DG coordination) is not based from another approach (for example: network reconfiguration), and vice versa. Latterly, some researchers have proposed a solution to harmonize any of the two approaches into single solution so that it can provide better results than the separate analysis. However, this solution consists of many variables and wrong coordination can inflict negative effects on the system especially in power losses, voltage deviation as well as stability index.
As a result, this research will focus on a new hybrid optimization to handle on simultaneous approach and at the same time to alleviate such problems.
1.4 Research Objectives
The objectives of this research are as follows:
i. To improve the performance of ABC by combining with Artificial Immune System (AIS) in order to solve specific high dimensional problem.
ii. To investigate the effectiveness of the simultaneous approach analysis compared with the separate analysis.
1.5 Scope of Work
The scopes of the research are listed below:
i. The total output of the DG unit must be less than the summation of total load and power losses in the test system, in order to avoid reverse power flow to the main grid.
ii. The maximum amounts of the DGs are only three units.
iii. The objective function for all case studies only focuses on single objective which is total power losses.
iv. All the results obtained in this thesis is in the context of operational planning division only, except the results obtained for DG coordination is a suggestion to construction planning division for their references.
1.6 Significance of the Research
The main motivation of this research is to determine the optimal network reconfiguration with DG coordination, in order to enhance distribution system performance in terms of total power loss reduction, voltage profile improvement as well as increase the stability.
Installation of the DG in the distribution has helped to improve the overall system efficiency especially reduction of power losses. Another approach that can be used to increase system performance is to install the capacitors or reconfigure the network by controlling tie and sectionalize switches. In addition, further improvements in the system can be obtained by combining any of these approaches rather than solve using single approach.
units of DG are used with five tie switches (for network reconfiguration process) in the test network. Hence, the total variables involved are 11, Xi= [Location1 Location2
Location3 DG Output1 DG Output2 DG Output3 Switch1 Switch2 Switch3 Switch4 Switch5]. Thus, hybridization between the ABC and the AIS is proposed to solve the problem and subsequently give minimum total power losses.
Overall, the analysis simultaneously provides a positive impact on distribution system especially for the reduction of the power loss. Furthermore, the use of optimization method assists and facilitates utilities in the planning division to provide optimal coordination.
1.7 Thesis Organization
This thesis is organized in six chapters. The first chapter begins with an overview of the research background and problem statement. It includes the most important aspects for overall research including the objectives and scopes. Chapter two presents a collection of literature from previous research work to tackle the problems in coordination. Next, in the chapter three describes a new hybrid optimization methods based on the ABC and the AIS algorithm.
Chapter four focuses on comparison between the ABC and the proposed method in solving DG coordination. In addition, the proposed method will be compared with a separate analysis that use single DG placement algorithm to determine the location and using the AIBC to determine the output of the DG. Chapter five discusses the effectiveness of simultaneous approach by combining the DG coordination with network reconfiguration. Furthermore, a comparison with other optimization methods will be performed.
CHAPTER 2
LITERATURE REVIEW
2.1 Introduction
In the first chapter, the overview of research background and other important aspects to define this research have been touched. As previously discussed, there are various approaches that have been used to reduce overall total power losses in the distribution system. Hence, in this chapter, previous related research works on network reconfiguration and DG coordination will be discussed.
2.2 Network Reconfiguration
Network reconfiguration is a common practice that performed by the utility to change the topology of the distribution system. This process is done by closing and opening the switches that exist in each branch. However, searching process for optimal combination of opened/closed switches is a complicated task that needs to be done properly.
As an alternative of loss reduction, the network reconfiguration also offers other advantages that can be leveraged by the distribution system. In ref. [14-16], they have listed several advantages of network reconfiguration in the distribution system, as listed below:
ii. Restrain the distribution line from being overloaded. iii. Improve the voltage profile at all network buses.
iv. Help to restore supply to the demands when fault occurred.
Figure 2.1 illustrates an example of the basic concept of network reconfiguration process by controlling sectionalize and tie switches to change the topology of the distribution system.
Besides network reconfiguration, another different approach to reduce power loss is by installing the DG. In the next section, the importance of installation the DG will be discussed.
2.3 Installation of Distributed Generation in Distribution System
As the power system become more complex and challenging, the need for advanced technology on the system become a priority for electrical utilities in order to ensure power is supplied to the demands without any interruption. Furthermore,
(a) Before reconfiguration process (b) After reconfiguration process
Fig. 2.1.An example of network reconfiguration process
with more concern to achieve high reliability and efficiency of distribution network, introduction of the DG concept seems as an interesting solution by integrating small scale of generator in the distribution system. Followed by the expected increase in energy consumption in the near future, the importance of DG installations has attracted the attention of many parties, especially electrical utilities.
A recent report conducted by Synapse Energy Economics, Inc. comprised of several organizations comprised of several organizations estimate that DG capacity in 2013 will increase by 191% at the end of 2021 in several states in New England, United State of America [17]. Meanwhile, another report released by the California public utilities commission on the 18th of March, 2013 stated that the state was targeting a total DG capacity of 12 GW to be installed by 2020 [18]. Based on these reports indicate that the installation of DG is indispensable in the future.
There are numerous definitions to describe the DG and until now there are still long arguments to justify the meaning. Not only that, term and rating of the DG also have various understanding depending on the region and the institutes [13]. Although there are different interpretations exist, the purpose of this small capacity of DG is still same. It will act as an additional power support to the system instead of depending solely on centralized generation; hence, power sharing between them can benefit the entire power system. In refs. [5, 19-22], they explain in detail the impact of the DG when connected to the network. Based from these studies, they pointed out that installation of the DG offer many benefits, especially to the distribution network. Some of the advantages as mentioned earlier are as follows:
i. Minimize total power losses at the distribution network. ii. Enhance performance on voltage profile.
iii. Improve stability index and security of the distribution system. iv. Help in improving the efficiency and reliability of the system.
v. Help in saving costs due to less expansion plan on generation and transmission lines.
According to a report issued by the International Energy Agency in 2012, the percentage of power losses that occur in the transmission lines and distribution system was 8.78% from the total power supplied [23]. Therefore, in accordance with one of the advantages that previously mentioned, the installation of DG can contribute in reducing the amount of losses that occur in the power system. However, the advantage can only be obtained if the DG properly coordinated in the system. Furthermore, one of the issues still faced by utilities is uncertainty in determining the output power and location of the DG. Figure 2.2 shows an example of installation of single DG in the distribution system at the specified bus.
Improper coordination of the DG can deteriorate the distribution system performance. Several studies have been conducted by researchers to see the impact on the system when the location and power output wrongly selected [24-26]. Based on their findings, different locations and sizes of the DG can affect the total power losses as well as voltage profiles. Hence, proper methods are needed to address the problems in determining the location and output power of the DG optimally.
(a) Before installation of DG (b) After installation of DG
Fig. 2.2.An example installation of DG
2.4 Previous Research Works on Distributed Generation Coordination
The power loss is one of the constraints to achieve a more reliable and economic distribution system. This problem exists due to the nature of the system which only depends on the generation that located far away to transmit power supply. In addition, characteristic of the distribution system in which has a low X/R ratio makes further increment of power losses. One of available solution is by install the DG in the existing problem where it is close to the load to help reduce dependence on the generation; hence, minimize the power losses. The presence of DG in the system without a proper sizing and location will actually worsen the problem. Therefore, many researchers have studied the effects of optimizing the location and size of the DG.
There are many methods published in the literature to determine location and size of DG, which can be categorized into several groups namely analytical, numerical, heuristic and meta-heuristic [6, 27]. Each of these groups has its own advantages and disadvantages. In ref. [6], the author has briefly discussed the comparison of each group in solving the DG coordination problem. Based on their findings, they concluded that meta-heuristic and heuristic methods are more robust and easier to implement in solving the complex problems.
Previously, calculations of location and size of DG are treated independently, which means different method is applied to each of them. Candidate of DG location can be determined either by using voltage sensitivity factor [28-30] or loss sensitivity factor [31, 32] or analytical method [33-35] or suggested by the authors [36]. Basically, the voltage and the loss sensitivity factor are operate by placing a DG at each node in the test system and choose the node which has a high sensitivity on the changes of power losses. Meanwhile, computation of the DG size is using optimization approach. However, when the analysis is done separately, the objective function or goal of the study is not in best solution due to predetermined location and considered as fixed parameter when to optimize the size of DG. Thus, it could lead the solution trapped in local optimum.
the sensitivity gives different optimal location for installing the DG. This shows that these two methods do not provide consistent results to determine the optimal location of the DG. In addition, there is no further explanation given by the authors which method should be preferred. In ref. [29] work has proposed a novel optimization method based on EP, which is known as Quantum-Inspired Evolutionary Programming (QIEP) to determine optimal size of DG. Conversely, determination of optimal location is not included in the QIEP, but based on the voltage sensitivity index. Based from the obtained result, proposed method showed better performance compared to the EP. However, the analysis had only focused a single mode of DG, which is PQ (Power-Reactive) mode. In ref. [34], the determination of the optimal location of DG is based on analytical approach which is known as single DG placement algorithm, whereas size of DG by using the PSO. The basic concepts of the algorithm is by insert a DG at each bus one by one and select the bus that give maximum value of power losses reduction as a candidate for best location. This process is repeated for the next DG. In another study proposed by ref.[35], the same concept in ref. [34] have been used to determine the location of DG, but using different optimization method which is ABC to calculate the size of DG. Although both of these references successfully provides better results compared to other analytical approach, but it does not guarantee to give the best solution due to the analysis in the DG coordination is done separately.
Recently, some authors have proposed a solution to determine both the location and size of the DG in simultaneous that means using one method to solve the DG coordination problem. Some of the aforementioned methods are Genetic Algorithm (GA) [37-39], Particle Swarm Optimization (PSO) [40, 41], Artificial Bee Colony (ABC) [42], Evolutionary Programming (EP) [43] and Firefly Algorithm (FA) [44].
compared to the EP. In ref. [44], the authors propose to solve coordination of DG by using the FA. This method imitate behaviour of fireflies communicate with others through the brightness of flashing light. In this study, they tested the proposed method using two units of DG and compare with the GA method. From the analysis of the simulation results, they concluded that the proposed method gives similar results with the GA and shows that there is no improvement in the quality of solutions. Another ref. [42], they propose ABC for the coordination of DG. The authors consider two types of scenarios for the load conditions, which are normal load and increase the load up to 50% of the normal value. Furthermore, in the analysis, they optimize the power factor and consider the DG in the PQ mode. Nevertheless, based on the proposed method, only one variable is chosen during the “mutation” process and the selection is done at random (for example randomly selects either DG location or DG size). Hence, in case of high dimension problems, the ability of the ABC algorithm to search all possible solution area might be limited due to the aforementioned construction.
Some authors have also proposed hybridized optimization methods by combining two optimization methods to cancel out the discrepancies of each method for achieving global or near global optimal solutions [45, 46].In ref. [45], the authors propose a hybrid optimization method which combines the PSO and the GA. Each of these optimization methods has different functions where PSO and GA are used to determine optimal size and optimal location for DG, respectively. Although the proposed method succeeded in giving the best answer compared to the PSO and GA methods, but the solution is divided into two stages, and it is probable that the solution is trapped in local minimum due to the calculation of the location depends on the size determined by other method. Similarly, in ref. [46] the authors propose a combination between Fuzzy logic and ABC. The solution is divided into two phases where the focus on the first part is to solve the optimal location for DG by using Fuzzy logic, while in the second phase; the ABC method is used to solve the DG size. Based on the results obtained, it was found that the proposed method gives the same power loss reduction with PSO method for all case studies that have been conducted. In addition, the authors only consider the type of DG in PQ mode.
number of iterations, easy to get trapped in local optimum when solving the complex problems [47] and weak at local search [48]. For the GA method, the basic operation is similar to PSO, but the GA has a filtering process (crossover and mutation), thus it makes the GA process a bit complicated than the PSO [49]. In addition, it stability depends on the crossover and mutation rates [47]. Unlike the PSO, the AIS shows a good performance to avoid the local optima [48], however, one of the disadvantages of AIS, it have many parameter to tune [47]. Another method which is known as ABC show better performance compared to other methods such as the PSO and the GA [50]. One of the clear advantages of the ABC, it only have two parameter that need to be tuned and thus make it easier to implement. However, one of drawbacks of ABC comes when solving problems with high dimensions. Therefore, in this thesis a new hybrid optimization based on ABC and AIS, known as Artificial Immune Bee Colony (AIBC) was introduced to improve the ABC method.
Overall, the coordination of DG can be divided into two groups of analysis, which are separate and simultaneous analysis. As previously discussed, the separate analysis is performed by determine location and size of DG separately. On the other hand, the simultaneous analysis is based on the location and size is determined simultaneously by using single calculation. The methodology for both analyzes is typically comprised of several groups of methods such as analytical, numerical, heuristic and heuristic. However, most of recent work focused on meta-heuristic optimization either for single DG or multiple DG. In addition, simultaneous analysis preferred over the separate analysis because it provides an opportunity for the optimization method to search all possible solutions and thus quality of solution can be achieved. Moreover, to obtain more reliable results and consistency in the determination of DG coordination, some researchers have combine two types of optimization to produce better results than the original optimization.
2.5 Previous Research Works on Network Reconfiguration
open and close positions respectively, whilst maintaining radiality of the system and network constraints. The appropriate protection scheme for over current relays demands the radial topology of the system.
There are several methods that have been used to solve the problem of network reconfiguration. Same as the coordination of the DG approach, these methods can be divided into several groups such as mathematics, heuristic, optimal flow pattern and meta-heuristic [14, 15].Based on ref.[51], most of the methods chosen by the researches to solve the network reconfiguration are heuristic and meta-heuristic.
One of the early researchers who worked on network reconfiguration is in ref. [52]. They proposed a simple formula to estimate the loss reduction when transmitting a cluster of load from one feeder to another feeder. It is further followed by the authors of the study [53] who introduced approximation of power flow based on concept presented by the study [52]. In addition, the authors also take into account the load balancing in their analysis. There are researchers that were based on the paper [52] and published the studies in ref. [54-56]. All of these solutions are known as heuristic algorithm.
Recently, modern optimization methods have been applied to network reconfiguration by many authors. Ref. [57] implements GA to solve the reconfiguration problem. Later on in ref. [58], they proposed Artificial Neural Network (ANN) to solve network reconfiguration problem. In the analysis, the authors use seven ANNs, which have a different topology for each of them. However, this method has a problem because it depends on the size of the system. If the size used is large then the amount of time taken to train the ANN takes time. To solve the problem, the authors in ref. [59] determine the amount of ANN based on number of sensitive switches where only four ANNs involved for the same test system. Therefore, the amount of time needed to train the ANN can be greatly reduced. Further investigation on implementation of ANN in network reconfiguration has been done in ref. [60]. They use clustering technique to divide the loads based on load level, which is used as inputs to the ANN. Furthermore, the training set used does not depend on the size of the test system and only one ANN is applied to solve the problem.
similar performance in terms of loss reduction and minimum voltage, but faster in computation time when compare with SA and TS, separately. Besides that, the authors in ref. [62] consider Hybrid Differential Evolution (HDE) to solve the network reconfiguration. One of the advantages of the proposed method compared with Differential Evolution (DE) is be able to reduce the amount of population; thereby reducing the computational time. To test the effectiveness of the proposed method, they make a comparison with SA method and based on the results obtained it was found that their method gives faster results. In another research work done by the authors in ref. [63] has used Ant Colony Search Algorithm (ACSA). The proposed method is inspired from the ants through the process of finding food. In the study, they were compared with the GA and SA. Based on their findings, the proposed method provides more consistent results compared with other methods when the simulation is repeated 100 times.
In ref. [64], the authors have proposed method that combines between the EP and Ant Colony Optimization (ACO). In the analysis, they take into account the impact of changes in load on the network reconfiguration. The authors have divided each day into several slots, where each slot comprises a maximum load current. Therefore, information on the number of switch conversions that occur for each slot can be obtained. Another ref. [65], Selective Particle Swarm Optimization (SPSO) is proposed to solve the network reconfiguration problem. The proposed method is a result of some modifications in the updating (mutation) process on Binary Particle Swarm Optimization (BPSO) that enables it to search in selected space. Furthermore, to facilitate the conversion process in finding the appropriate switches, they close all the switches (tie and sectionalize) on the test system and as a result several loops are formed. During the process of searching, only switches that are in these loops will be considered for network reconfiguration process.
2.6 Previous Research Works on Network Reconfiguration with DG Coordination
Ref. [66] is among the earliest researchers examined the impact of DG on the network reconfiguration. In the study, they used TS method to determine the appropriate configuration when DG included in the test system. In addition, they also investigate the effect of Reverse Power Flow (RPF) caused by the DG due to amounts of power generated exceeds the load requirements. Later on in ref. [67], they suggest PSO to solve distribution feeder reconfiguration with DG. In this paper, the authors make a comparison between Dispatchable Distributed Generation (DDG) and Non-Dispatchable Distributed Generation (NDDG). Based on the results obtained, they concluded that DDG gives better results in terms of reduced power loss compared to NDDG. Furthermore, it also managed to reduce conversion process between switches.
In ref. [68], they propose a heuristic method that is based on sensitivity and branch exchange to determine the best configuration of the test system. In this paper, they consider four DGs unit with various capacities. Based on their analysis, it was found that the reconfiguration of the network in the presence of DG can help to reduce power loss almost half from the initial power losses. In another study carried out by the ref. [69], they apply ACO method to determine optimal network reconfiguration includes several DG units with different capacities and power factor. Aside from the reduction of power loss, the authors also consider load balancing in their analysis. In the meantime, the authors in ref. [70] also used ACO to resolve network reconfiguration with DG. In addition, they also study the ability of network reconfiguration to ensure that all the loads can be supplied by the DG when test system is disconnected with main substation (islanding).
thus, harmonization between DG coordination and network reconfiguration can provide opportunity to find a better solution.
In ref. [71], the authors attempted to solve optimal DG coordination with network reconfiguration. Nevertheless, the solution proposed by them is not carried out simultaneously due to the location of DG is determined first by using sensitivity factor. Based on acquired location, they only optimize the size of the DG and the reconfiguration of the system by using Harmony Search Algorithm (HSA). Therefore, there is a possibility that the proposed solution fails in finding better results because the search process for DG size and network reconfiguration depending on the particular location (fixed location).
Overall, previous studies as described in sections 2.4 and 2.5 are only focusing on one approach (either DG coordination or network reconfiguration) to reduce power loss in the distribution network. This will cause the main objective of which is to further reducing power loss become limited. To solve the problem, several studies as explained in refs. [66-71] have been conducted by combining two approaches, but still do not provide the best solution due to not solve both approaches, simultaneously. Since, there are no research works solve the coordinate between DG coordination and network reconfiguration, in this thesis, the effectiveness of combination of both approaches will be examined so that the results obtained are better than the approach conducted separately. In addition, due to combination between DG coordination with network reconfiguration involve with high dimension problem (high number of variables), the AIBC is chosen to solve the problem.
2.7 Conclusion
28 CHAPTER 3
ARTIFICIAL IMMUNE BEE COLONY
3.1 Introduction
In the previous chapter, the significance of the DG and the network reconfiguration to minimize the power loss was discussed briefly. The power loss is one of important aspects need to be considered by the utilities during planning stage. This matter is essential in order to achieve high efficiency of distribution system. Nevertheless, one of the issues still faced by them is uncertainty to determine the best coordination. Improper coordinate the approaches can deteriorate the system performance. Therefore, many researchers have suggested various tools to alleviate such problem.
At the beginning of this chapter, some discussions related to meta-heuristic methods will be discussed. Thereafter, the Artificial Bee Colony (ABC) algorithm will be discussed. Finally, the proposed method which is hybridization of ABC and Artificial Immune System (AIS) will be explained in details.
3.2 Overview of Meta-Heuristic Method
meta-heuristic is the best decision, due to simplicity of the algorithm in solving complex system [72].
According to the Oxford dictionary, the word “meta” is referring to the “beyond”, while the definition of the heuristic refer to engage in the process of learning something for themselves. In some sense, meta-heuristic is a refinement from heuristic algorithm in searching of near-optimal solutions [47]. In general, meta-heuristic can be categorized into two types which are trajectory-based and population-based. The difference between these types can be seen in the initial solution where for the trajectory starts with single point and replaced with another point (the best solution so far) during the iterative process, whereas the population-based have multiple point during the initial solution [47].
Under the population-based, there are two classes of algorithm which are evolutionary and swarm intelligence [50]. Among the examples for the population-based optimization that has extensively used in wide range of engineering problems are Genetic Algorithm (GA) [8], Particle Swarm Optimization (PSO) [9], Firefly Algorithm (FA) [73], Ant Colony Optimization (ACO) [10], Artificial Immune System (AIS) [74], Harmony Search Algorithm (HSA) [75] and Artificial Bee Colony (ABC) [11].
In ref. [47], the authors have made brief overview on related to several meta-heuristic methods. In addition, they also make a comparison for each method and list all the advantages and disadvantages. Based from their observations, they conclude that none of these methods can solve all engineering successfully. This conclusion is known as “No Free Lunch Theorem” [76] which means that for certain types of engineering problem, the optimization approaches may not gives similar results from each others. Therefore, some improvement or modification must be made to the original method for solving specific problem.
In the literature review, there are various recommendations that have been suggested by researchers to improve performance of the original method in solving a specific problem. Typically, this is done through some modifications on the original formula or by integrating (hybrid) two methods to become a new method. Some examples available in the literature review are QIEP [29], GA-PSO [45], Hybrid TS-SA [61], HDE[62], EP-ACO [64], and SPSO [65].
functions and simulation results showed that the ABC method gives better performance compared with other methods. Therefore, in the thesis, Artificial Bee Colony (ABC) will be the main focus of the study. Overview of theory for ABC and mathematical formulation will be covered in the next section.
3.3 Artificial Bee Colony
Artificial Bee Colony or simply known as ABC optimization was proposed by ref. [11] in 2005. The effectiveness of ABC algorithm had been tested at various engineering applications and better performance compared to other algorithms [77-82]. Basic principle of this method describes the replicating activities swarm of bees in searching for food source around hive [50, 77] as depicted in Fig. 3.1.
In general, the ABC consists of three types of bees, which are employed, onlooker and scout, where each type of bees represents different phases and task. This algorithm can be divided into four phase which are initialization phase, employed phase, onlookers phase and scout phase as shown in Fig. 3.2. There are
Fig. 3.1. Behavior of bees finding the food sources [77]
Food Area Hive
two important parameters involved to tune the ABC optimization which are size of colony and limit. The size of colony is defined as total number of onlooker bees and employed bees, whereas; for the limit is total numbers of onlooker’s bees multiply by size of dimensional parameter to be optimized [11].
The analysis is started by the scout bees; they are deployed out randomly in the possible search solution area to find the food source. After the acquisition of food sources, there will be an information exchange between scout bees and employed bees, according to Eq. 1. Specifically, the employed bees will find new food sources that are positioned near to the location given by previous scout bees by using Eq. 2. Based from this new location, they calculate the new fitness to be compared with the
Fig. 3.2. Basic flow chart of ABC
Start Initialization Employed Bees Stage Reached Limit? Reached Max. Cycle? End
Onlooker Bees Stage
Scout Bee Stage
Yes
Yes Yes
No
old fitness (obtained during the initialization phase) by using greedy selection. In the greedy selection process, only the higher of fitness value will be memorized by the bees and used in the onlooker bee phase.
i
i Ob.Func FV 1 1 (1)where FVi is the fitness value and Ob.Funci is the objective formula of the study’s
problem.
kj
old ij old ij new ij x range x x x (0,1) (2) where xijnew and xijold are the new and previous value of variable, respectively. xkj is aneighbor value that is selected randomly from jth dimension and range(0,1) is a random value between 0 and 1.
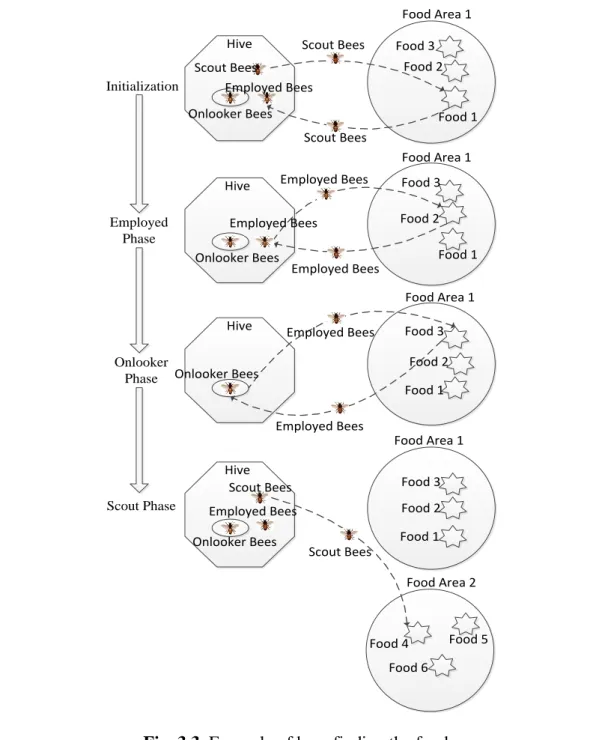
The obtained information about the amount of food will be share with the onlooker via dancing area. However, the possibility for the onlooker bees to be chosen for extracting the food at the area where given by the employed bees is dependent on the amount of nectar available as in Eq. 3. If the food in the area is exhausted, the onlooker will be change to scout bees and search for new food source locations. The process is repeated until the maximum cycle that has been set by the user is reached. However, if the fitness value didn’t improve for a specified number of times (until it reaches a certain predetermined limit), they will abandon the food source and assign a scout bee to explore new food source location randomly. Figure 3.3 shows an overall process of bees finding the foods.
N i i i iFV
FV
prob
1 (3)3.4 Artificial Immune Bee Colony Optimization
In original ABC, mutations process (Eq. 2) for new value of variables are determined randomly for one variable at one time (for example either location or output power of DG) for each cycle. However, for a problem that involved with many variables, hence, the ability of the ABC algorithm to search all possible
Fig. 3.3. Example of bees finding the foods
solution area might be limited due to the aforementioned construction. Therefore, some modifications are done to the original ABC algorithm. The Artificial Immune Bee Colony Optimization, which is a combination of ABC and AIS, is introduced for solving the specific high dimensional problem. An example of comparison for mutation process between ABC and AIBC is explained in Appendix A.
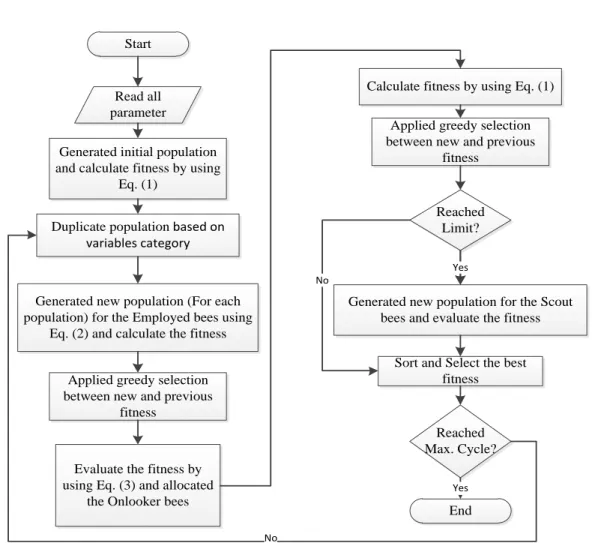
The AIS is an algorithm that imitates the behavior of the immune system (human particularly), a natural defense mechanism to protect the human body from foreign substances [74]. Fig. 3.4 shows the general flow chart of AIS in searching optimal solution. Based from that figure, it can be observed that the AIS method involves several processes which are the initialization process, the duplication process, the mutation process, the sorting process and the selection process. The incorporation of the AIS method (duplicate, sort and selection) to the ABC algorithm implies that the hybrid optimization can gives reliable results than the original ABC algorithm. The basic flow chart of AIBC algorithm is depicted in Fig. 3.5. The main difference between AIBC and ABC is searching process, according to the comparison of the Fig. 3.2 and the Fig. 3.5.
Fig. 3.5. Basic flow chart of AIBC
Start
Generated initial population and calculate fitness by using
Eq. (1)
Generated new population (For each population) for the Employed bees using
Eq. (2) and calculate the fitness
Reached Limit? Reached Max. Cycle? End Read all parameter
Applied greedy selection between new and previous
fitness
Evaluate the fitness by using Eq. (3) and allocated
the Onlooker bees
Generated new population for the Scout bees and evaluate the fitness
Yes
Yes Yes No
Duplicate population based on variables category
Calculate fitness by using Eq. (1) Applied greedy selection between new and previous
fitness
No
Sort and Select the best fitness
Fig. 3.4. Basic flow chart of AIS Start Generate parent population Duplicate parent population Achieved convergence criterion? End Read all parameter
Mutate the duplicate parent population
Sort and Select the best fitness
No
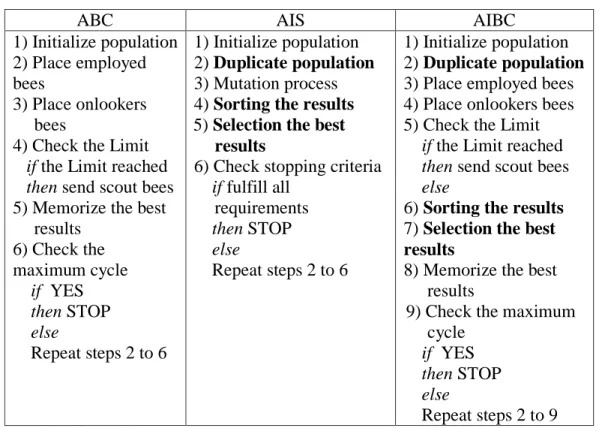
Table 3.1 shows comparison of pseudo code for each algorithm. It can be observed that the differences between the ABC and the AIBC are on duplication, sorting and selection process taken from the AIS algorithm.
3.5 Conclusion
In this chapter, an overview of various methods under meta-heuristic that is widely used to solve engineering problems have been discussed. In addition, the ABC method which also the main focus of this study is discussed briefly. This method is the replication of foraging activity of bees around the hive. To improve the performance of this method, some modifications were made to the ABC by incorporating with the AIS. In the next chapter, the proposed method will be used to determine the coordination of DG in the distribution network.
Table 3.1: Comparison of pseudo code for each algorithm
ABC AIS AIBC
1) Initialize population 2) Place employed bees
3) Place onlookers bees
4) Check the Limit
if the Limit reached then send scout bees
5) Memorize the best results 6) Check the maximum cycle if YES then STOP else Repeat steps 2 to 6 1) Initialize population 2) Duplicate population 3) Mutation process 4) Sorting the results 5) Selection the best
results
6) Check stopping criteria
if fulfill all requirements then STOP else Repeat steps 2 to 6 1) Initialize population 2) Duplicate population 3) Place employed bees 4) Place onlookers bees 5) Check the Limit
if the Limit reached then send scout bees
else
6) Sorting the results 7) Selection the best
results
8) Memorize the best results
9) Check the maximum cycle
if YES then STOP else
CHAPTER 4
DETERMINATION OF OPTIMAL OUTPUT POWER AND LOCATION OF DG BY USING AIBC
4.1 Introduction
In this chapter, the advantages of the proposed method will be tested to determine the DG coordination on the designated test systems. The analysis will be divided into two parts. For the first part, the proposed method will be compared with the ABC in solving the location and output power of the DG, simultaneously. This comparison will be done on two test systems that have different sizes which are 33-bus and 69-33-bus. Multiple units of DG will be imposed on that system in order to investigate at various dimensional problems. In the next section, a comparison between the simultaneous analysis (same as proposed method in the first part) and separate analysis will be done. The separate analysis is a combination between single DG placement algorithm and Artificial Bee Colony (ABC).
4.2 Problem Formulation to Minimize Power Losses
j n j ij i Y V I
1 (4)where Yij is the nodal admittance and Vj is bus voltage at bus j.
Transform the Eq. 4 into polar form and thus the new equation can be expressed as follows: j ij j n j ij i Y V I
1 (5)where ij is the angle of nodal admittance, whereas δj is voltage angle at bus j.
The complex power at the bus i can be compute as in Eq. 6 and substitute the equation into the Eq. 4. The complex power at bus i can be expressed as below:
j ij j n j ij i i i i jQ V Y V P
1 (6) Separating the real and imaginary and the equations can be expressed as follows, ) ( cos1
j
i
ij
ij
j
n
j
i
i
V V Y P
(7)Fig. 4.1. Simple Test System
) sin ( 1 j i ij ij j n j i i V V Y Q
(8) After the Eqs. 7 and 8 are computed; the values of voltage and phase angle can be determined by using formula below.) ( ) ( ) 1 ( k i k i k i V V V (9)
)
(
)
(
)
1
(
k
i
k
i
k
i
(10) where ΔVi(k)and Δδi(k) can be calculated from Jacobian matrix as shown in Eq. 11. V J J J J Q P i i i 4 2 3 1 (11)
The power losses at each line and total power losses can be determined as in Eqs. 12 and 13, respectively.
ij
ij
ij
I R Plineloss 2
(12)
nbr i i i ij I R PTotalloss 1 2 (13) where nbr is total number of line/branch.
nbr
i
i
i
ij
I R PTotalloss1
2
' (15) where Iij’ and Ii’ are the new current flow at line between two buses after DG isconnected.
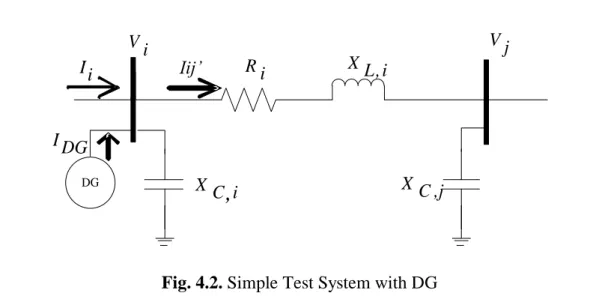
For the optimization process, coordination of DG can be formulated as a mixed-integer nonlinear optimization which is involved with continuous state variable (DG output power) and discrete state variable (DG location). Since, the aim of this study is to reduce the total line losses in the distribution system, while maintaining all constraints within permissible limit. Therefore, objective function of the problem formulation can be expressed in Eq. 16
i nbr i i R I x x f
2 1 2 1, min (16) where,x1 continuous variables (DG output power),
x2 discrete variables (DG location),
nbr number of lines,
Ii current at line, i of distribution system.
Ri resistance at line, i of distribution system.
Fig. 4.2. Simple Test System with DG
Four constraints are considered in the optimization process to ensure all parameters in the distribution network are within allowable limit. The lists of constraints are shown below:
a) DG operation constraint (continuous variable):
max , min , DG DG DG
P
P
P
(17)All DG units must operate within the tolerable value where PDG,min and PDG,max are
minimum and maximum limit of DG output power. In this study, all DGs are assumed to have the same minimum and maximum output.
b) Bus voltage constraint
max , min , n n n
V
V
V
(18) The voltage value for all buses in the network must be within the acceptable limit where Vn,min and Vn,max are minimum and maximum allowable voltage at bus n.c) Total power injection constraint
i nbr i i tl n n load tdg k k DG P I R P
2 1 1 , 1 , (19)The total power output from all DG units in the system must less than the total load and total power loss in the test system. Therefore, the reverse power flow to the main can be avoided with this constraint. The tdg and tl are total number of DG and total number of load, respectively. PDG is size of DG and Pload is total amount of load
d) Power balance constraint i nbr i i tl n n load tdg k substation k DG
P
P
I
R
P
2 1 1 , 1 , (20)The total power injected into the system which is from the DG unit and main substation, Psubstation must be same with total load and the total power loss (power
equilibrium concept).
In order to solve this problem, DG power output and DG location are selected as variable x1 and x2, respectively. Total power losses of the system are selected as
objective function, Ob.Funci, whereas, the fitness value, FVi can be obtained from
the Ob.Funci by using the relation as in Eq. 1. At the first step of solution process,
initial population, xi, is randomly generated that consists of DG output power and
location with the size of the population is N number. Based from this initial population, the fitness value is calculated. After that, the population will be duplicated based on the number of categories involved (For example DG location and DG output power) and new population will be generated by using Eq. 2 and then new fitness is calculated. Since, x2 is considered as a discrete value, so the results
obtained from the Eq. 2 will be rounded off to the nearest real number. In this “mutation” process, only variable that belong to each category will be modified by using Eq. 2, whereas other variable retained at previous value.
done. This process is repeated until maximum cycle is reached. The proposed of DG coordination by using AIBC is summarized as follows:
Step 1: Randomly generated initial population, xi consisting of DG output
power and location with size of N number of Employed bees. Step 2: Calculate fitness value, FVi by using Eq. 1 for each solution of xi.
Step 3: Duplicate the population based on number of category (DG output power and DG location).
Step 4: Compute new value of DG output and DG location by using Eq. 2 on each population and calculate the new FVi.
Step 5: Apply greedy selection (Only higher FVi is saved) between old and
new FVi.
Step 6: Calculate probability, Probi value by using (3) and assigned the
onlooker bees.
Step 7: Calculate new FVi for the new population.
Step 8: Apply greedy selection and save the best fitness value.
Step 9: If the number of trial (limit) had been exceeded, one scout bee is assigned by randomly generate new value of both parameters and replace the solution, xi with the new ones.
Step 10: Sort all population and select only N number of best fitness Step 11: Memorize the best results so far.
Step 12: Repeat the process from step 3 to 11 until maximum cycle.
Fig. 4.3. Flow chart of AIBC to determine optimal DG coordination Start
Initialize and evaluate their fitness by using Eq. (1)
Generated new population for the Employed Bees using Eq. (2) (DG output power only while DG location maintain the same value) and calculate
the fitness by using (1) Applied greedy selection between new and previous
fitness
Evaluate the fitness by using Eq. (3) and allocated the Onlooker
Bees
Applied greedy selection between new and previous
fitness
Sort and Select the best fitness
Max. Cycle?
No
END Yes Save the best results.
Cycle = Cycle +1;
Duplicate based on the category (DG power output and DG Location)
DG output category? Yes
Read all parameter
Calculate fitness by using Eq. (1)
Applied greedy selection between new and previous
fitness
Generated new population for the Employed Bees using Eq. (2) (DG
location only while DG output power maintain the same value) and
calculate the fitness by using (1) Applied greedy selection between new and previous
fitness
Evaluate the fitness by using Eq. (3) and allocated the Onlooker
Bees
Applied greedy selection between new and
previous fitness
Calculate fitness by using Eq. (1)
Applied greedy selection between new and previous
fitness Reached
Limit?
Randomly generate a new output power of DG (Scout Bee phase)
and calculate the fitness Yes
No Reached
Limit?
Randomly generate a new location of DG (Scout Bee phase) and
calculate the fitness Yes No
4.3 Related Data for 33-bus and 69-bus Test System for DG Coordination
All the case studies are applied to the 33-bus and 69-bus test system as shown in Fig. 4.5 and Fig. 4.6, respectively. The 33-bus system consists of 33 buses and 32 branches, whereas for the 69-bus system have 69 buses with 68 branches. Both of the test system connected to the main substation of 132/12.66 kV. All data related to the test systems can be obtained in Appendix B [83] and C [84]. The power and voltage base values are 100 MVA and 12.66 kV, respectively. In addition, all the DGs assumed to function in Power-Voltage (PV) mode whilst the loads are presumed to be power constant.
Fig. 4.4. Flow chart of ABC to determine optimal DG coordination
Start
Initialize and evaluate their fitness by using Eq. (1)
Generated new population for the Employed Bees using Eq. (2) (Either
DG output or DG location) and calculate the fitness by using (1)
Applied greedy selection between new and previous
fitness
Evaluate the fitness by using Eq. (3) and allocated the Onlooker
Bees
Applied greedy selection between fitness of Employed and Onlooker
Max. Cycle?
No
END Yes Save the best results.
Cycle = Cycle +1; Read all
parameter
Calculate fitness by using Eq. (1)
Applied greedy selection between new and previous
fitness
Reached Limit?
Randomly generate a new output power of DG (Scout Bee phase)
and calculate the fitness
4.4 Comparison of Performance between AIBC and ABC
To test the effectiveness of proposed method at various dimensional problems, comparison with original ABC has been conducted for both the test system. In this comparison, both of techniques are runs independently for 50 times (100 cycles for each run) to determined output power and location for various number of DG.
Table 4.1 shows summary of the results between ABC and AIBC in solving coordination problems for multiple DG on 33-bus system. Based on the results obtained, both methods give similar results when the amount of DG installed on the
Fig. 4.6. 69-bus test system without DG
39 36 37 38 28 29 30 1 2 3 4 5 6 7 8 9 10 11 12 13 14 15 16 17 27 28 29 8 35 36 37 38 48 49 47 46 50 51 2 3 4 5 6 7 9 10 11 12 13 14 15 16 17 18 47 48 49 50 51 52 132/12.66 kV 8 18 19 20 21 22 23 24 25 26 19 20 21 22 23 24 25 26 27 30 8 31 8 32 33 34 31 32 33 34 35 54 55 53 54 55 56 57 58 59 56 57 58 59 60 53 61 62 63 64 60 61 62 63 64 65 40 41 42 44 45 40 41 42 43 44 45 46 67 68 68 69 39 43 52 65 66 66 67 2 3 4 5 6 7 9 9 8 7 6 5 4 3 2 1
Fig. 4.5. 33-bus test system without DG

![Fig. 3.1. Behavior of bees finding the food sources [77]](https://thumb-ap.123doks.com/thumbv2/123deta/9766165.1850169/37.893.177.780.573.993/fig-behavior-bees-finding-food-sources.webp)