A method of graph information
extraction and retrieval for academic
literatures by use of semantic
relationships
by
Sarunya Kanjanawattana
A dissertation submitted in partial fulfillment for the degree of Doctor of Philosophy
in the
Division of Functional Control System Graduate School of Engineering and Science
To my family for encouraging me to do my best.
To my friends for supporting me in everything I do.
To teachers who kindly advise and motivate me to accomplish
Though only my name appears on the cover of this dissertation, many great people have supported to the contribution and cooperated until it has been suc-ceeded. I would like to convey my heartfelt gratitude and sincere appreciation to all people who has made this dissertation possible and because of whom my graduate experience has been one that I will cherish forever.
My experience at Shibaura Institute of Technology (SIT) has been unforgeable. I have felt a warm welcome since my first day in Japan. I have been given unique opportunities and taken advantage of them. Definitely, this dissertation would not have been accomplished without the scholarship of Shibaura Institute of Technology and Japanese Government (Monbukagakusho or MEXT) Scholarship.
My deepest gratitude is to my supervisor, Prof. Masaomi Kimura. He has been supportive since the days I joined his laboratory. I have been incredibly fortu-nate to have a supervisor who gave me inspiration and motivation. Ever since, he has supported me not only by providing a research assistantship throughout three years but also academically and emotionally through the rough road to finish this disser-tation. He guided and helped me when I faced problems during the study. Thanks to him I had the opportunity to practice and acknowledge the research process for my career. In the future, I would follow his step and become a good supervisor to my students as he has shown to me.
I would like to extend my gratitude to my dissertation committees: Prof. Toru Sugimoto, Prof. Michiko Ohkura, Assoc. Prof. Ryota Horie, and Prof. Hideaki Takeda, for precious comments, including the questions which intended me to widen my research from various perspectives. I am gratefully indebted to them for their very valuable comments on this dissertation.
cussions, evaluations, and for all the great time we have had. Further, I would like to show my thank to my friends in Suranaree University of Technology for their encouragement.
Finally, I must express my very profound gratitude to my parents and to my sister for providing me with unfailing support and continuous encouragement throughout my years of study and through the process of researching and writing this thesis. This accomplishment would not have been possible without them. Thank you very much.
Abstract
Graduate School of Engineering and Science Division of Functional Control System
Doctor of Philosophy by Sarunya Kanjanawattana
Information retrieval is a fundamental technique for modern search engines. This technology is designed to advocate information discovery. Generally, the data used by this technology is text descriptions. However, images, especially graph images, typically contain much useful information. In academic literature, the graph images are very important to summarize and represent experimental results and statistical data. Therefore, a search engine system to discover the graph images and their information is definitely necessary for researchers to obtain precise and concise knowledge. However, to utilize both graphical and literal information, the problem of the semantic gap should be addressed. To do so, it is necessary to give meaning to the graphical information and link it to the linguistic information; thus, a proper solution is to use an ontology to bridge the gap. Regarding the necessity of my dissertation, the users necessitate employing the proposed system because it provides precise and concise information from relevant graphs with less ambiguity. This should advocate their studies and fulfill their academic inquiries.
tion, I also introduced several systems: graph-type classification, graph components extraction and identification, OCR-error correction, and graph information extrac-tion. After their processes were completed, much of knowledge have been acquired from the graphs. An ontology and a database were constructed to store the obtained knowledge for utilizing in the search engine systems.
This system contributes several benefits and usefulnesses to society, particu-larly in academics. Researchers need accurate and reliable information to support their studies. This system can fulfill their requirements by providing the relevant graphs and concise information. The ontology also offers new knowledge; though, a relational database cannot surpass this benefit. The main contribution is that the novel ontology-based search engine system applicable to the new design of ontology storing graph information.
All systems had been tested and presented results, including new findings. The results showed that the performance of each system proposed in this dissertation was highly effective. The F-measure reached to 0.7, which was much higher than the traditional search engine system. It clarified that the ontology-based search engine system provides precise and concise information outperforming than the ES-based search engine system. To sum up, the objectives of each study have been achievable proven by their evaluations.
Acknowledgements v
Abstract vii
List of Figures xiii
List of Tables xvii
Abbreviations xix
1 Introduction 1
1.1 Background . . . 1
1.2 Ontology definition of this study . . . 4
1.2.1 A theoretical definition . . . 4
1.2.2 A practical definition . . . 5
1.3 Problem Statement . . . 6
1.4 Objectives . . . 7
1.5 Outline of the dissertation . . . 8
1.6 Contribution . . . 10
1.7 Novelty of the Study . . . 11
1.8 Structure of This Dissertation . . . 11
2 Related works 15 2.1 Classification On Image data . . . 15
2.2 OCR Error correction . . . 18
3.1 Background . . . 24 3.2 Methodology . . . 27 3.2.1 Definition of my datasets . . . 27 3.2.2 A proposed method . . . 30 3.2.2.1 Preprocessing step . . . 30 3.2.2.2 Application of classification . . . 33
3.3 Experiments and results . . . 37
3.3.1 Comprehensive tests . . . 37
3.3.2 Results . . . 40
3.4 Discussion . . . 43
3.5 Conclusions . . . 51
4 Graph Components Extraction and Identification 53 4.1 Background . . . 54
4.2 Methodology . . . 55
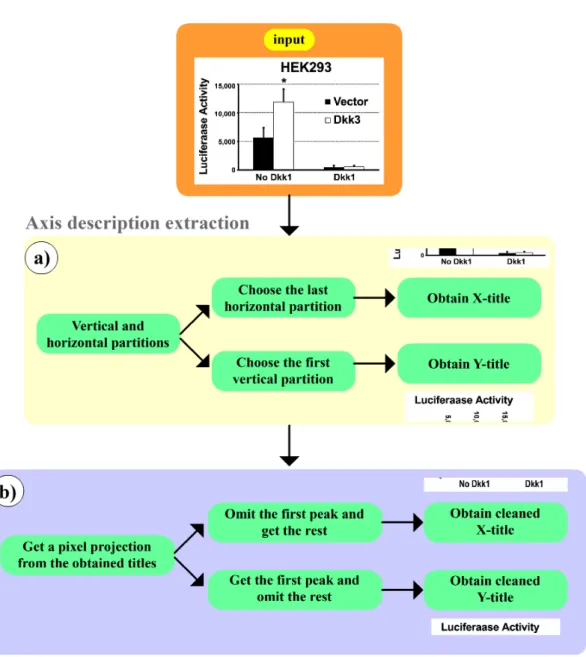
4.2.1 Axis description extraction . . . 55
4.2.2 Legend extraction . . . 57
4.3 Experiments and results . . . 62
4.4 Discussion . . . 64
4.5 Conclusions . . . 66
5 Graph-based Optical Character Recognition-error Correction 69 5.1 Background . . . 70
5.2 Methodology . . . 71
5.2.1 Data collection . . . 72
5.2.2 OCR-error correction . . . 73
5.2.2.1 Candidate selection . . . 73
5.2.2.2 Ontology design and creation . . . 74
5.2.2.3 Error correction . . . 75
5.3 Experiments and results . . . 79
5.4 Discussion . . . 84
5.5 Conclusions . . . 88
6 Graph Information Extraction 91 6.1 Background . . . 92
6.2 Methodology . . . 93
6.2.1 Ontology . . . 93
6.2.2 Extraction of graph information . . . 96
6.2.2.1 Data content identification . . . 96
6.3 Simulations . . . 100
6.4 Discussion . . . 103
6.5 Conclusions . . . 104
7 A Prototype of Ontology-Based Search Engine System 105 7.1 Background . . . 106 7.2 Methodology . . . 107 7.2.1 Database design . . . 108 7.2.2 Ontology design . . . 111 7.2.3 System implementation . . . 111 7.3 Conclusions . . . 120
8 Experiment and Evaluation 123 8.1 System Evaluation Background . . . 124
8.2 Experiment configuration . . . 125
8.3 Experiment procedures . . . 126
8.4 User Feedback Evaluation . . . 129
8.4.1 Participants . . . 129
8.4.2 Results and Analysis . . . 129
9 Discussion 139 9.1 Findings of this dissertation . . . 140
9.2 Discussion of this dissertation . . . 145
9.3 Limitations and possibilities of the study . . . 146
10 Conclusions and Future Works 157 10.1 Conclusions . . . 157
10.2 Future works . . . 160
A List of Publications 163 A.1 International Journal Papers . . . 163
A.2 International Conference Papers (Peer-reviewed) . . . 164
A.3 Workshop . . . 165
B Background of generic search engines 167 B.1 System Evaluation Background (Appendix part) . . . 167
1.1 Content structure of this dissertation . . . 13 3.1 Example displaying two scatter plots with different characteristics and
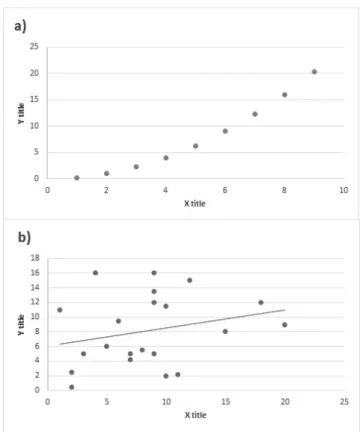
patterns: (a) scatter plot containing only points and (b) scatter plot containing points in different positions than (a) and a line . . . 26 3.2 Illustrating the core process of one-dimensional image construction
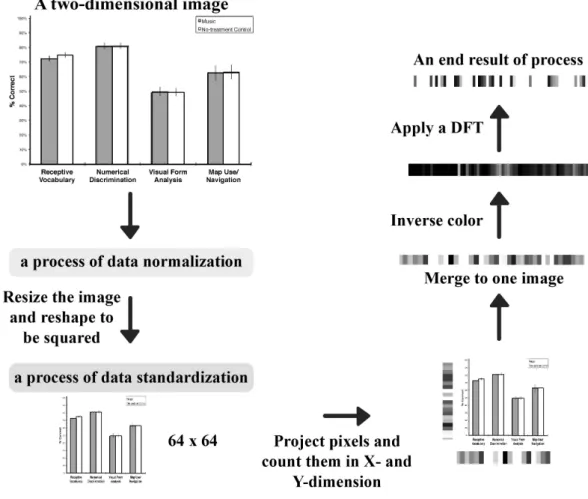
accomplished by applying a DFT . . . 31 3.3 Demonstrating the process of classification by applying the ANNs,
then the SVMs . . . 34 3.4 Processes of all experiments: (a) applying the CNNs to 1Dimg and
2Dimg in CNN 1Dimg and CNN 2Dimg respectively, (b) applying the SVMs to WLHT in SVM WLHT, (c) applying the ANNs to WLHT in ANN WLHT, (d) applying the SVMANN to WLHT in SVMANN WLHT, and (e) applying the ANNSVM to all datasets in ANNSVM 1Dimg, ANNSVM 2Dimg, ANNSVM WL, ANNSVM HT, and ANNSVM WLHT . . . 38 3.5 Results from CNNs and ANNSVM that used 1Dimg and 2Dimg:
(a) table statistically showing summarized results and (b) bar graph graphically illustrating results from these experiments . . . 40 3.6 Results from ANNSVN that used WL and HT a) table statistically
showing summarized results and (b) bar graph graphically illustrating results from these experiments . . . 41 3.7 Results from SVM, ANN, SVMANN, and ANNSVM that used WLHT:
(a) table statistically presenting summarized results, (b) bar graph graphically illustrating results from SVM WLHT and ANN WLHT, and (c) bar graph graphically showing results from SVMANN WLHT and ANNSVM WLHT . . . 42 3.8 Simulation of Coiflet 1 [73], analyzing as one-dimensional images . . 45 3.9 Illustration of three different wavelets [73] with three waves that have
3.10 Detailed accuracy separated by classes and a confusion matrix which
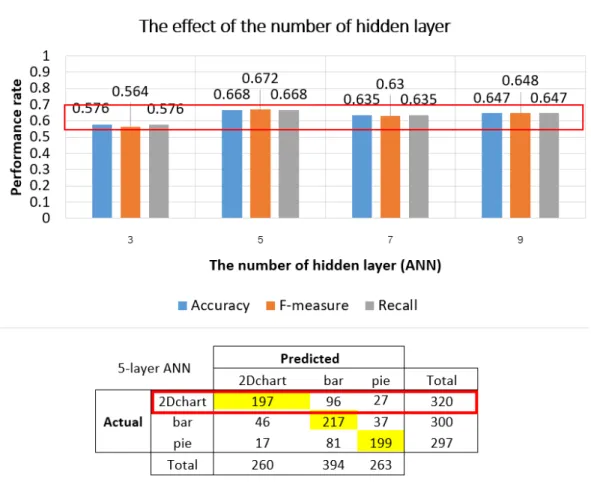
belongs to the dataset of Coiflet 1 applied by my main method (ANNSVM) 48 3.11 Results of the tests for checking an impact of the number of hidden
layers . . . 50
4.1 Process to extract X- and Y-titles from graph images based on their location: (a) image partitioning process; (b) pixel projection . . . 56
4.2 Overall legend extraction procedures . . . 57
4.3 Epsilon estimation to analyze the densities of each quarter to obtain the smallest distance to be valued as Epsilon . . . 58
4.4 Examples of DFT results that present the difference between an image (a) with and (b) without a legend . . . 60
4.5 Data transformation from a 2D-DFT image to a single-row numeric dataset used for classification . . . 60
4.6 Performance rates of axis description extraction . . . 64
5.1 Illustration of graph components . . . 72
5.2 Steps of candidate selection . . . 73
5.3 Demonstration of my ontology structure describing entities, proper-ties, and relations . . . 74
5.4 Example of grammar dependency parsing, including POS tags and typed dependencies, and NER classes of each token . . . 76
5.5 Demonstration of OCR-error correction covering possible conditions to filter and correct errors . . . 77
5.6 Illustration of accuracies and noise ratios of all experiments . . . 82
5.7 Illustration of precision, recall and F-measure of all experiments . . . 82
5.8 The number of tokens, including accuracy rates of each condition . . 83
6.1 Representation of my ontology structure describing classes, proper-ties, and relations . . . 94
6.2 Overall of proposed system . . . 96
6.3 Bar height extraction using pixel projection and a step function . . . 99
6.4 Pixel proportion calculation . . . 99
6.5 SPARQL query command and answers for Question 1 . . . 101
6.6 SPARQL query command and answers for Question 2 . . . 101
6.7 SPARQL query command and answers for Question 3 . . . 101
6.8 SPARQL query command and answers for Question 4 . . . 102
6.9 SPARQL query command and answers for Question 5 . . . 102
7.3 A part of database storing feedback data for the search engine system
(a final system) in Feedback mode . . . 110
7.4 Illustration of the updated ontology, i.e., observing at read arrows, used in this system . . . 112
7.5 A user interface of search page with three sections . . . 113
7.6 Selectable conditions for results filtering . . . 114
7.7 Selectable features that can be presented at the result section . . . . 114
7.8 Question 1 and its settings . . . 116
7.9 Example of result performed by Question 1 . . . 116
7.10 Question 2 and its settings . . . 117
7.11 Example of result performed by Question 2 . . . 117
7.12 Question 3 and its settings . . . 118
7.13 Example of result performed by Question 3 . . . 118
7.14 Question 4 and its settings . . . 118
7.15 Example of result performed by Question 4 . . . 119
7.16 Question 5 and its settings . . . 119
7.17 Example of result performed by Question 5 . . . 120
7.18 Question 6 and its settings . . . 120
7.19 Example of result performed by Question 6 . . . 121
8.1 System flow in feedback mode . . . 127
8.2 User page . . . 127
8.3 Illustrating the results of query in feedback mode . . . 128
8.4 Questionnaire page . . . 128
8.5 Selected keywords for each participant and experiment iteration . . . 130
8.6 Statistical results analyzed by three performance models: precision, recall, and F-measure . . . 131
8.7 Average precision, recall, and F-measure from ES-based and ontology-based search engine systems . . . 133
8.8 Mean of scores . . . 134
8.9 List of questions . . . 134
8.10 Standard deviation of scores . . . 135
8.11 Scores of each question in Questionnaire page provided by 10 partic-ipants . . . 135
4.1 Evaluation results of classification for METHOD 1 . . . 63
5.1 Settings of my experiments . . . 81
9.1 List of studies and their core findings . . . 140
9.2 List of limitations of all proposed systems. . . 149
Abbreviations
2D-DFT Two-dimensional Discrete Fourier transform 2Dchart Two-dimensional charts
ANNs Artificial neural networks
API Application programming interface CNNs Convolutional neural networks
DBSCAN Density-based spatial clustering of applications with noise DFT Discrete Fourier transform
DSL Domain specific language ES Elasticsearch
GPU Graphics processing unit IDF Inverse document frequency LSI Latent semantic indexing NER Named-entity recognition NLP Natural language processing OCR Optical character recognition
OPTICS Ordering points to identify the clustering structure P-value Probability value
PCA Principal component analysis POS Part of speech
RBF Radial basis function
SQL Structured query language SVMs Support vector machines TP True positive rate
Introduction
The aim of this chapter is to introduce background and motivation that lead readers to comprehend an importance of this dissertation, which entitled “A method of graph information extraction and retrieval by use of ontology”. Existing problems and proposed solutions will be tentatively presented in this chapter. Further, I will suggest beneficial contributions and provide some examples. Finally, a summary of this chapter and a structure of this dissertation will be described.
1.1
Background
parts of documents; however, only descriptive detail is inadequate to clearly demon-strate whole information to the readers. Thus, images are used to highlight essential information, particularly graph images.
To extract graphical information from the images, it is unavoidable to manipu-late image features, such as shape and texture. However, a way to obtain information from graph images differs to generic photo images, because needed information are data interpretable by human rather than image shapes or colors. Several publica-tions have appeared in recent years documenting about an extraction of low-level image features [24], but a few studies have focused on graph images [38, 54]. In-deed, the extractable information from graph images should be productive to users because they obviously obtain concise knowledge or the main point of a document relating to the graphs.
find the shortest path. Another example is an ontology. It uses a graph to show relationships among concepts as a network. The graphs used in this research are collected from the scientific literature, especially in computer science and biology, with this following types: bar graph, line graph, and plot graph. The kind of the graph is a general graph representing a means of representing data. In academics, researchers created them to present data summaries from their experiments or some comparisons; thus, many kinds of information can be expressed in the scientific graphs, such as statistical data, category names, a comparison among data, and some critical changes along continuous data tendency.
Only the information graphically extracted from the graph images may be insufficient to acquire completed information. Definitely, descriptions of the graphs also provide necessary information that thoroughly explains about the graphs them-selves. To fulfill this requirement, not only graphical but also literal contents should be used. It should be analyzed by a dependency parser, which is a tool for parsing sentences and expressing their relations [65]. This extractable information directly involves to the graphs and be also useful to the users.
However, a critical problem, called semantic gap, has been addressed if both graphical and literal information are utilized together. Generally, the gap should be bridged by using ontology. For several years, great effort has been devoted to discovering solutions of semantic gap [88, 93]. In this dissertation, I propose a novel method of ontology-based search engine system that attempts to narrow the semantic gap by introducing solutions to extract and use graph information presented graphically and literally.
from the graphs, which is extracted from graphical and literal information, without confusion. They obtain fast and elaborate knowledge that helps to instantly capture the main points of the graphs. Hence, the major motivation of this research is to support researchers and students by providing essential knowledge from the graphs precisely. Here, I decide to extract information from the graphs because it is sim-ple to retrieve information from data analysis rather than other kinds of images; in addition, users should acquire useful information much easier.
1.2
Ontology definition of this study
1.2.1 A theoretical definitionOntology, which originates from philosophy, is a term meaning a study of things of existence [7]. For example, I observe the nature of a thing and identify relative objects belonging to a group of abstract concepts. During recent years, com-puter science introduces technical definitions of ontology, which is different from the original meaning. A definition by Gruber [33] proposed the most referenced defini-tion: ‘an ontology is an explicit and formal specification of a conceptualization’. He explained the ontology as a formal description of existed concepts and relationships. In this context, a specification is a way to acquire to obtain knowledge from a specific domain. A conceptualization represents a way to organize and structure knowledge by using a finite list of terms (concepts or classes of objects), which are described a domain of discourse, and relationships among terms (hierarchies of classes) [16]. Zhong et al. [94] provided the definition of ontology: ‘An ontology is a specification of an abstract, simplified view of the world’. As reviewed a study in [5], the author summarized some definitions of ontology existing in the previous studies such as Guarino [34].
expression such as a taxonomy. Moreover, it expresses implicit data because it bridges among a variant of concepts which may belong to a different domain but contain partial term similarity.
In conclusion, my ontology means an explicit knowledge structure discoursing collaborating representations such as textual and graphical representations for this research.
1.2.2 A practical definition
An upper ontology is used to support the semantic interoperability and facil-itate the semantic integration of domain-specific ontologies by providing a common starting point for the formulation of definitions. It contains very general terms, e.g., object and relation, that are applicable across multiple domains. According to an assumption, when this generalization is performed in ontologies of multiple domains, a small set of generic terms that is the same in all these domains will be come up. For example, the Suggested Upper Merged Ontology or SUMO is an upper ontology intended as a foundation ontology for a variety of computer information processing systems. Commonly, SUMO concerned itself with meta-level concepts, i.e., general entities that do not belong to a specific domain, and thereby would lead naturally to a categorization scheme for encyclopedias. Moreover, a mapping from WordNet synsets to SUMO has also been defined [71].
The design of my ontology composed of textual and graphical representations. For textual information, the ontology here described words terms or contextual usage of words as entities and word dependencies as relations. The definition of this textual part is additional information explaining graph images. On the other hand, the definition of graphical representation in this ontology is the realization of the existing data inside the graphs. The ontology describing the graphical representation was created based on the fundamental structure of the graphs. For example, the graph consists of axis titles, a legend, and data section. Moreover, the data section contains some explanation about data such as slope and bar height.
In conclusions, the definition of my ontology is the explanation about the graph image in the scientific literature.
1.3
Problem Statement
There is now ample research on an area of information retrieval, which is the baseline of search engine system. Many systems have been currently developed based on full-text and image searches. After users queried some specific keywords to sys-tems, they returned relevant information to users, such as a list of documents and a collection of images. Those existing studies have registered tremendous success effi-cient methods to retrieve relevant data [92]. However, they provide only documents or images but do not include further information that may be needed by users, for example, data tendency or the highest data value. A combination of image informa-tion extracinforma-tion and search engine systems should be a proper soluinforma-tion to solve this difficulty.
existing studies is the semantic gap that is the main cause of user misunderstanding. It characterizes the difference between linguistic and graphical representations. If the gap reduces, the ambiguity also diminishes. This problem is also found in the image search [19]. To literately analyze the images, the problem of misunderstanding may occur, because user thoughts turn to mislead author’s intention. A number of researchers have addressed the problem of the semantic gap and propose several so-lutions. [22, 35, 45, 93]. In this dissertation, I introduce the idea to utilize ontology containing both graphical contents from graphs, e.g. graph components and graphi-cal data appeared in data sections, and high-level representation, e.g., captions and cited paragraphs, in order to minimize the problem wisely. This should be a proper solution to minimize the gap of semantic.
1.4
Objectives
The major purpose of this dissertation is to introduce a novel graph search system integrating several techniques that I proposed in the past, such as graph type classification, graph component and information extraction, and OCR-error correction. Therefore, a list of major objectives of this dissertation is presented as follows:
1. To minimize the problem of the semantic gap between linguistic and visual representations by proposing an ontology-based graph search engine system. 2. To design my ontology structure to support the search engine system.
The target of the study is to address the problem of semantic gap by using my ontology. However, only utilizing ontology is inadequate to efficiently mitigate the problem; therefore, I must propose some methods to deal with information from the graphs. The list below describes minor objectives related to proposed systems.
2. To identify locations of graph components appearing in the graphs by using clustering as well as extract information residing in the components by using OCR.
3. To cope a limitation of DBSCAN clustering with automatic Epsilon estimation. 4. To propose the OCR-error correction system to suggest correct recognitions
by utilizing both local and external ontologies.
5. To extract information located in the data section of the graph in graphi-cal form to quantitative data, including finding extend information such as a relationship of axes titles.
6. To design a database to record primary graph description and user feedback. 7. To determine an effectiveness of my ontology-based search engine system by
comparing to a traditional search engine system by using the same data col-lection.
The performance and efficiency of the ontology-based search engine system are evaluated by users. They must assess the obtained results by deciding them as for whether relevance or irrelevance and response questionnaires. A traditional search engine system, which is an open source software, is selected for a purpose of evaluation comparison; hence, the users clearly examine a difference between both systems. After the evaluation process, I measure and present the performance of the systems, e.g. F-measure, precision, and recall.
1.5
Outline of the dissertation
graph. Note that the plot and line graph are recognized as two-dimensional charts (2Dchart) because I analyze primary structures of both graph types and find several similarities. For example, data are usually displayed on two-dimensional axes with a periodic scale. Moreover, both graph types provide a similar mean of information, because a line is comprised by multiple plots located in data space. A bar graph shows rectangular bars with lengths proportional to the representing values. To compare significant characteristics between the bar graph and 2Dchart, the bar graph presents continuous data at Y-axis and discrete data at X-axis; meanwhile, 2Dchart shows continuous data on both axes.
This dissertation reports the findings of a thorough study and introduces novel methods, including their evaluations. The experimental results have proven that the methods have been effective and succeed to achieve goals of this research. I herein proposed four studies to resolve different problems.
The first method was graph image classification [48] whose main goal was to distinguish different types of graphs based on their characteristics extracted by using discrete Fourier transformation (DFT) and Hough transformation.
Second, I proposed the graph component extraction and identification [52]. The graph components represent X-title, Y-title, and legend. Note that the legend means data labels that should be presented on the graph with multiple data. This proposed system utilized to identify the position of the graph components, espe-cially the position of legend, which might establish in different locations depending on authors’ attention. Density-based spatial clustering of applications with noise (DBSCAN) had been used to identify the legend’s position.
Finally, to obtain significant information from the data section of graphs, I introduced the graph information extraction [50]. It could detect and transform the graphical data (such as bars and plots) to quantitative values. Moreover, this disclosed explicit and implicit knowledge by the ontology. Note that the explicit information was provided purposely that could easily realize data intention such as bar heights. The implicit information could be acknowledged by using the ontology to investigate relationships or concepts such as graph relationships.
Hence, my entire studies are assembled into one main system, called the ontology-based search engine system for graph images. This search system pro-vides not only graph images but also graph information. A common evaluation method dealing with a search engine system is to collect user feedbacks [5, 78]. For my evaluation, ten participants have been gathered in order to validate the system. User feedbacks and suggestions are collected for evaluation. Further, system perfor-mance is computed and represented by perforperfor-mance models, such as F-measure and precision. Note that the participants who attend my evaluation process should have experience about computer or biology.
1.6
Contribution
The graph search engine system offers social benefits, as it can give access to implicit and explicit knowledge. Moreover, it provides extraordinary features because not only relevant images but also new information collected from extraction process and discovered from ontology have been acquired from my ontology-based search engine system. This system has a range of applications, for example in image interpretation system. It also can be applied to other kinds of the image such as color photos and extract such information based on their low-level features.
graphs that are relevant to their studies, such as a bar graph presenting experimen-tal results of a study. For example, after the researchers completely conducted their experiments and obtained some results. For discussion, they may need results from other related studies to make a comparison. Further, users can specify a graph type for filtering relevant results.
1.7
Novelty of the Study
The method developed here has never been used in previous attempts to ex-tract knowledge from graphical and literal contents in graph images. The novelty of the study are described as follows:
• New method of ontology-based search engine system.
• New ontology and database design supporting the search system.
• New methods of the graph-type classification system, graph component ex-traction, OCR-error correction using ontologies and graph-content extraction. There are a lot of existing studies focusing on ontology design to solve the problem of semantic gap, as similar to this study. However, this study focuses on the graph information extraction and designing the new ontology to mitigate the semantic gap problem. Obviously, this is the first trial to use both visual and textual contents from graphs which are recorded into the ontology.
1.8
Structure of This Dissertation
Related works
In the previous chapter, I described the introduction of this dissertation to describe what my inspiration was and explain what problems were herein addressed, including this research’s objectives and contributions. This chapter surveys existing works related to the topic of this dissertation. The review given in this chapter intends to provide an idea of the state of the art of the corresponding areas.
I will review works and thoroughly discuss their studies’ solutions and prob-lems. This chapter is organized into three sections: classification on image data, OCR Error Correction, and use of ontology for image information retrieval.
2.1
Classification On Image data
The image regularly includes a large amount of information; therefore, to use it properly, a suitable approach that can transform the image to usable data should be proposed. Several techniques have been applied to image classification to extract image information and characteristics. During the past few decades, considerable attention has been paid to extending the ideas of extracting image features. A popular method was to extract low-level features instead of using their actual pixel values. Low-level features (e.g., color, texture, and shape) have been reported in many literatures [24, 86, 87]. The visual features were extracted and used as inputs of classification. Sergyan [77] proposed a color histogram based classification approach and contributed to an image search system; however, traditional methods involved the low-level features, are insufficient for my target images, even if the idea of using low-level features was effective in the previous studies, because to classify the graph types, I did not focus on the low-level features, but only the presence of objects in the graphs, such as rectangles and scatter plots, was adequate for graph-type classification.
hash kernels and data encoding with product quantizers. I realized that the image analysis process was an important procedure for classification because images con-sist of raw data in an inappropriate input form for existing classification systems. Thus, a preprocessing step used to prepare and construct input data in a ready form became an important procedure in extracting dominant image features. Fan et al. [29] presented a method for classifying of medical images based on their regions by using a nonlinear Support vector machines (SVMs). They built adaptive regional feature extraction and feature selection procedures that consolidate robust features from high-dimensional morphological measurements obtained from brain MR im-ages. Their robust feature selection removed irrelevant and redundant features to improve classification. However,
To enhance image classification, data mining and machine learning algorithms have been gaining importance in recent years. As such, there are some well-known algorithms usually applied to image classification given their simplicity and perfor-mance characteristics; these algorithms include Artificial neural networks (ANNs), SVMs, and Convolutional neural networks (CNNs), each of which is described below. The ANNs is an information-processing paradigm inspired by human neural networks. Veluchamy et al. [87] proposed blood cell classification prediction for normal and abnormal cell classes. They extracted images of blood cells, sorting gray level statistics and algebraic moment invariants, then classified the target images using an ANNs. Frate et al. [30] used an ANNs to remotely sense to distinguish among areas made of artificial coverage including asphalt or buildings, and open spaces, such as bare soil or vegetation. They attempted to apply their classifica-tion system to high-resoluclassifica-tion images from satellites. These previous studies show that ANNs can handle problems involving high-dimensional images and can work perfectly with nonlinearly separable data.
skin, vegetation, snow, water, ground, and buildings, or as an unknown. They used image histograms as be feature vectors. SVMs are effective when handling with low-level features [2], but I concerned about SVMs efficiency when applied to my data because the extracted features of this system were different from existing studies.
In recent years, CNNs have been developed by extending the classical ANNs. Here, CNNs have great potential for image classification and are also faster if a computer conditionally supports a graphics processing unit (GPU) [83]. CNNs can be proficiently applied to large image databases [57]. For example, Kang et al. [47] presented a novel classification based on CNNs to classify document images presented in different layouts. They also employed a technique called dropout to reduce overfitting in the fully connected layers [82]; however, CNNs here had an obvious drawback. Inputs to CNNs should be images comprised edges because the CNNs can give fully effort to analyzes the image by using Gabor filters [66]. In this study, I convolved the input image into one-dimensional images without edges or any objects. Therefore, I needed to conduct experiments to evaluate the performance of CNNs applied to my constructed data.
Finally, from my observations during the existing study, I acknowledge that traditional methods suffered from a problem of parametric, i.e., parameters were very sensitive to changing the value of a parameter changed the results either for the better or for the worse. In this study, I solve this obstacle and obtain the best results that can be produced by my current system.
2.2
OCR Error correction
To obtain information in the graph components basically written by text char-acters, symbols, and numbers, OCR is unavoidably used. It is a technique to recog-nize graphical alphabet characters and transform it into digital characters. However, OCR may provide wrongly recognition due to many obstacles, for example, low im-age quality and unsupported languim-age packim-age for OCR. A great deal of effort has developed many approaches to correct the OCR errors over several years. Nagata [69] emphasized his work to correct misrecognized characters using character shape similarity and statistical language model. He attempted to challenge to Japanese whose sentences did not include word delimiters (e.g., space). However, I realized that this previous study cannot correct such items as acronyms and transliterated foreign words because they often show in English (such as ISO and SONY) that cannot recognize by OCR included by Japanese language package. It differs from my method because ours can correct words universally as long as they appear in the source document.
Semantic-based techniques (e.g., context-based analysis and ontology) are proper solutions addressing the OCR problem. Wick et al. [89] realized that conventional systems identified low-confidence outputs that were insufficient to correct misrecog-nition errors. They used topic models automatically detecting the semantic context of scanned documents and specified the word frequency to correct the errors. How-ever, a limitation of topic models is high training time required, because users must classify documents to acquire their corresponding topics prior applying OCR. An interesting method related to correct OCR errors is also described in [12]. They developed a context-based method based on Googles online spelling suggestion to correct the OCR errors. They avoided using an offline dictionary because a huge volume of terms needed to gather in a source computer, which consumed a lot of resources. Google is a massive online database containing a large collection of word sequences. It is suitable to be a data source of correcting word suggestion. How-ever, this technique is limited to use via online that need to concern about network availability and efficiency, e.g., speed and bandwidth.
identification between words in Rogets Thesaurus. This knowledge source contains explicit links between words and related vocabulary items for each part of speech, unlike an ordinary dictionary. Their method depended on Relation algorithm that located semantic relations between words and calculated a relatedness score of each word. However, this technique possibly encountered a difficulty, if dealing with words in a sentence. They may obtain a real-word error in the same category or cross reference. To solve this problem, not only word categories but also sentence dependencies should be used, because each word in the sentence definitely contains at least one dependency linking to some other words in the same sentence. Zhuang et al. [95] introduced an OCR post-processing method based on multiple forms of knowledge, for example, language knowledge and candidate distance information given by the OCR engine. They focused on Chinese characters. A similarity be-tween this existing study and my study is to find candidates depended on similarity distances. However, this previous study was limited to long sentences containing many dependencies, because it used an n-gram supportable contiguous sequence of n items from given sentences.
2.3
Use of Ontology for Image Information Retrieval
Furthermore, not only text [68] but also images can be searched by using on-tology. Semantic web ontology and image information extraction offer a new way to annotate and retrieve image data [40]. As presented in [39], Hyvonen et al. con-sidered several situations when users were encountered complicated and semantical images and knew how ontology can be used to realize them. To prove their con-cept, they implemented a system for image annotation depended on ontology and the same conceptualization. Finally, their system provided a recommendation of semantically related images to users. However, most system dealing images often face the problem of the semantic gap.
Graph-type classification
In the previous chapter, I mentioned about related works and their addressed problems. Many state-of-art studies attempted to propose solutions to solve existing obstacles effectively.
Here, in this chapter, I present the background of graph-type classification including a process of the method. Next, I will describe experiments and results. Finally, I will discuss new findings and conclude the study.
3.1
Background
In past decades, there has been a growing interest in image classification. In much of literature, researchers have encountered problems with image classification and have attempted to find solutions by utilizing a variety of classification tech-niques, such as SVMs [11, 20] and ANNs [30, 87], as well as including image analysis techniques, such as wavelet transformation. Typically, a large input dataset size is a serious problem in the study of image classification because images, which are inputs of a system, generally contain many features and attributes, in particular, two-dimensional images. In fact, the performance of a classification system is in-verse to the size of the input dataset. Many existing studies have developed image classification methods based on large-scale datasets, attempting to somehow miti-gate the problem of high-dimensional data, as two-dimensional images [75]. If the two-dimensional images are used in an inappropriate way, this may significantly de-crease the classification performance. Therefore, a plausible solution needs to be proposed due to effectively solve this problem.
in graph characteristics. Naturally, the same type of graph may include several different objects and characteristics. For example, there are many points in a scatter plot (e.g., see Figure 3.1a), but the positions of these points are certainly different from one scatter plot to another (e.g., compare to 3.1b) depending on the real data. Moreover, there is also a line in the scatter plot shown in Figure 3.1b. Unfortunately, these uncertain characteristics of graphs cause difficulties for traditional classification systems [6, 48]. Assuming that I use convolution neural network CNNs to classify the example images showing in Figure 3.1. Based on a basic process on CNN, it convolves the images using multiple filters and feature maps. A typical random kernel is similar to an edge detector; hence, the edge is an important feature for CNN. Moreover, a result of convolution process provides an output matrix containing edge characteristics. However, it is the inessential property for graph-type classification, yet dominant objects, such as lines and circles. I realize that CNN may be unsuitable for graph images. Regarding my proposed method, I also convolve the graph images from two-dimension to one-dimension, still include significant characteristics, such as a profile of pixel appearance and the focused objects in the graphs. I emphasize to classify the images based on their essential characteristics rather than image features. This system classifies graph types based on the presence of dominant objects in images. For example, it checks a presence of plots in data space to classify plot graph but does not focus on their plots’ positions or direction of correlation because I do not currently emphasize data interpretation, but only classify the types. Concisely, I address the problem of classification with images containing particular characteristics, even they are grouped in the same category. Further, I realize a difficulty of the curse of dimensionality that always occurs when handling to image data. Thus, to minimize the problems, a productive classification method has been introduced to create a new data representative that replaces the two-dimensional image that can handle problems of dimensionality and different characteristics.
Figure 3.1: Example displaying two scatter plots with different characteristics and patterns: (a) scatter plot containing only points and (b) scatter plot containing
points in different positions than (a) and a line
image information extraction system [50] and acquire widen and specific information. For example, as the simulated case showing above, its results should be displayed in a bar graph because the bar graph can impliedly express categorized data (e.g., their accuracies corresponding to each software) much better than a line graph. On the other hand, a line graph should be a better choice when dealing with continuous data, such as vehicle speed. The graph-type classification possibly applies to a range of applications, such as search engine and image interpretation systems.
The major objectives of my study are (1) to propose a novel method for clas-sifying graph types with greater accuracy, (2) to extract dominant characteristics of graphs to be a new data representative suitable for identifying graph types, and (3) to indicate what features make my data separable, which improves the quality of a classification system.
To evaluate my proposed method, I conducted several experiments to compare my approach with classical methods, for example, ANNs, CNNs, and SVMs. Both ANNs and SVMs are extensively recognized as being high-potential tools for classi-fication. The important part of ANNs are their ability in learning iterations, which defines how weights of each neuron should be periodically adjusted. The SVMs use a boundary to isolate data that is different depending on a kernel. Here, the ker-nels tested in this study are RBF and linear kerker-nels. The CNNs is a powerful tool to categorize images by analyzing image edges. The CNNs is based on the ANNs with more one additional step called a convolution step. Typically, the CNNs pro-vides great results as shown in previous studies [61], particularly when working with two-dimensional images containing low-level image features, e.g., image edges, as dominant characteristics.
3.2
Methodology
3.2.1 Definition of my datasets
and 2Dchart, the latter including line graphs, plot graphs, and area graphs. I merge and set them to the two-dimensional chart because the regular graph structure from those graph types was similar. For example, the line graph and plot graph’s structure contains titles that appear on both axes, and there are lines and plots presented in a data section. Note that lines in line graph can be recognized as continuous data plots; thus, it can be likely identified as another kind of plot graph. The graph types also contain apparently own characteristics. For example, for a pie chart, at least one circle should be apparent and reside in the graph; further, axis titles do not appear. For a bar graph, its main structure is comprised of a title along the y-axis and categories along the x-axis. For a 2Dchart, its structure contains titles that appear on both axes. Further, this system is a part of graph information extraction [50]; thus, to precisely extract information, I must use particular methods to extract knowledge depending on the types that contain their own general structures, such as a presence of axis titles and dominant objects. I realize that the same method can be used to extract information from both the line and plot graphs; whilst, another particular method is also specifically applicable to the type of bar graph. Therefore, in other words, I choose the graph types and limit them to three particular types because not only they contain separable graph type characteristics, but it is also convenient for my graph information extraction [50] to accurately extract their information.
In my previous study [48], I performed experiments with these image sizes, including other bigger image sizes. As reasonable results, It is found that these sizes (i.e., 64 x 64 and 1 x 64) provided the most accurate results as compared to other sizes because they contain adequate information for classifying. Image sizes that were too large were inappropriate for my experiments because of the curse of high-dimensional data and the problem of sparsity. Similarly, I avoided using image sizes that were too small due to the difficulty of unclear image expression.
To create numeric datasets, I use a wavelet transformation to analyze the one-dimensional images and acquire the sequences of wavelet coefficients based on several wavelet families applied in this study, i.e., Coiflet1, Coiflet3, Coiflet5, Daubechies2, Daubechies10, Daubechies20, Haar, Symlet2, Symlet10, and Symlet20. I select them for two reasons. First, the coefficients can provide significant characteristics for the classification. Each wavelet family has a different oscillation. If the level of the wavelet increases, the wavelet provides much better compression results [43]. Second, they are used in several previous studies [10]. Overall, they have proven to work well for image classification.
All datasets used in this study are summarized below. • 1Dimg dataset: the original one-dimensional images • 2Dimg dataset: the converted two-dimensional images
• WL dataset: the numeric datasets that contain only results from the wavelet transformation
• HT dataset: the numeric datasets that contain only results from the Hough transformation
The main dataset I currently emphasize in this study is WLHT, i.e., the nu-meric datasets that include results from both the wavelet and Hough transforma-tions. To classify images, conventional methods directly use 2Dimg, i.e., the two-dimensional images, as inputs to the systems. Hence, for evaluation, I applied my proposed method to images in 1Dimg and 2Dimg, then compare to my main dataset, WLHT. Finally, I use WL and HT to evaluate which is better for yielding separable data. Note that the method was not applicable to all data in the world. Only bar graphs and 2Dchart were available to the system.
3.2.2 A proposed method
In this subsection, I explicitly propose a new method for graph-type classi-fication using a combination of SVMs and ANNs that include several techniques, such as the discrete Fourier transform (DFT), Hough transformation, and wavelet transformation. I divide my system into two major steps, i.e., a preprocessing step and an application of classification.
3.2.2.1 Preprocessing step
The preprocessing step is a crucial part of my approach. It is used to construct one-dimensional images (i.e., 1Dimg) and numeric datasets containing wavelet coef-ficients and Hough transformations (i.e., WLHT). To generate the one-dimensional images, the essential procedures are shown in Figure 3.2. Initial inputs of this pro-cess are two-dimensional graph images that have already been cleaned and converted to grayscale. My proposed method consists of four steps, each of which is described below.
Figure 3.2: Illustrating the core process of one-dimensional image construction accomplished by applying a DFT
Second, I examine each image pixel, each of which contains one color value. After each pixel is projected along the x- and y-axes, the number of projected pixels are counted, if a color value is greater than zero, to reduce image dimensionality. Therefore two one-dimensional images should be acquired from the x- and y-axes.
Third, the one-dimensional images acquired from the previous step are com-bined into one piece by concatenating the one-dimensional image of the x-axis to the one-dimensional image of the y-axis.
high values along axes, which are represented as white or light colors, that obviously present existing information. Ordinarily, white color indicates no information, while in contrast, a black or dark color instinctively represents meaningful information. Therefore, the process of inverting colors helps to clarify the data expression and prevent confusion in the interpretation.
A DFT is used for two reasons. First, the DFT can uncover dominant infor-mation from images but does not need to concern itself with the position of how the objects changed. For example, an important part of pie charts is located in the low-frequency domain because the level of pixel distribution is low. On the contrary, the high-frequency domain presents an important part of plot graphs. Second, a reg-ular factor for classifying graph types is a similarity of characteristics in each type of graph, but my target inputs probably offer different characteristics, even though they are of the same type, because some objects represented in the graphs depend on real data, as shown in the example cases of Figure 3.1.
After completing the process of one-dimensional image construction, numeric datasets including wavelet coefficients and results from the Hough transformation (i.e., WLHT) should be generated. The one-dimensional DFT images are presented in the form of frequencies by the procedure illustrated in Figure 3.2; therefore, they are regarded as signals that can be analyzed via wavelet analysis, which ana-lyzes and decomposes signals into elementary forms at different scales and positions. The prospective results of wavelet analysis here are sequences of wavelet coefficients that represent the similarity extent comparing the examined section of signals to the scaled and shifted wavelets. Note that the wavelet coefficients are calculated at every possible scale and along every position of time. Further, a variety of wavelet families is used to obtain the corresponding coefficients. I apply the wavelet transformation in my study because correlated information in signals is obtained by using wavelet families. Moreover, a sequence of wavelet coefficients is substantially divergent in dif-ferent images and is considered to characterize images. Thus, the dominant patterns are acquired from various types of images based on different wavelet families.
single plots. The basic Hough transformation identifies lines in an image, but the later Hough transformation has been extended to be able to identify arbitrary shapes, most commonly circles and rectangles. Moreover, it can deal with the scatter plots in plot graph. Detected objects are counted and collated into the object detection attributes of the given dataset. To reduce variations, I categorize the number of detectable objects into five categories, i.e., C0, C1, C2, C3, and C4. If the number of
detectable objects is between zero and five, I assign its number as C1. If it is between
six and 10, C2 is assigned. If it is between 11 and 15, C3 is assigned. If it is greater
than 16, I assigned C4. Otherwise, it is set to C0. Further, to determine the graph’s
containing areas, I recognize that the filled areas are often located from middle to bottom with horizontal alignment. Thus, I allocate a specific region inside the image and calculate area density, which is measured by counting the number of color pixels divided by the total number of pixels in the given region. If the density exceeds a predefined threshold the value of the area attribute is set to C1. Conversely, if the
density is lower than the threshold, the value of the area attribute is set to C0.
Comparing 2Dimg and WLHT, the characteristics of WLHT should be more reasonable for my classification system, as opposed to ordinary images, for two key reasons. First, the sizes of images from WLHT are smaller, because I construct my numeric datasets based on the one-dimensional images, thus the number of di-mensions certainly decreases. Indeed, the image classification system often provides better results if working with smaller image-scaling sizes [75]. Further, processing time should be substantially less since the number of pixels correlates to the amount of information to be processed. Second, my data can handle problems of different graph characteristics better than ordinary images due to the benefits of DFT. 3.2.2.2 Application of classification
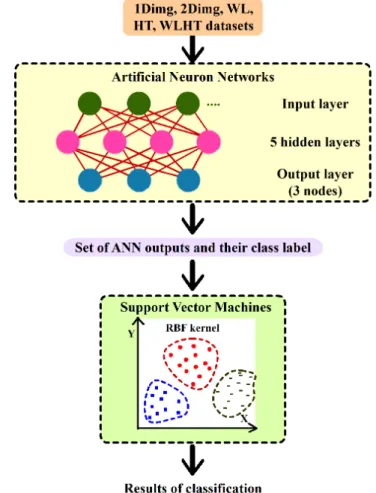
Figure 3.3: Demonstrating the process of classification by applying the ANNs, then the SVMs
three because there are three different class labels (i.e., 2Dchart, bar, and pie) in my datasets.
I used the ANNs here because my datasets have nonlinear separation, and the ANNs is also highly applicable to nonlinear modeling. Thus the ANNs with multiple hidden layers was an optimal candidate; however, since the ANNs is a black box learning approach, it is difficult to interpret implicit relationships between inputs and outputs.
After this first stage, I used three outputs from the ANNs as new temporary datasets. Note that the three numeric outputs here are the results from three output nodes of the output layer. Typically, these values represent a classification result by justifying a predicted class. For my case, the system must forward proceed to the second classifier, i.e., SVMs; since the system did not justify a predicted class yet but kept the numeric results for being an input of SVMs. Via a training process, I combined them with a class label to obtain training datasets.
from a practical viewpoint, the SVMs has a high algorithmic complexity that causes the testing phase to be longer.
I used a SVMs classifier for three reasons. First, the SVMs guarantees a global optimum solution, i.e., it can capture the lowest values from a given domain. Second, the dimensionality of the input space does not explicitly affect to computational complexity, still, the smaller data size is surely outperformed. I preferred to use a smaller size of data because this system was a combination of two classifiers. Even though the problem of high dimensionality slightly affects to SVMs, but it might cause bad results to the entire system, in both cases of speed and generation performances. Third, there is a sparse density of pixels in an image, i.e., a low density of pixels that describes information in my one-dimensional image. The SVMs automatically gives a sparse solution, because the Lagrange multipliers are equal to zero for the non-support vector; therefore, the corresponding input vector can be omitted in the summation.
3.3
Experiments and results
3.3.1 Comprehensive testsIn this study, I conducted several experiments to address the various ques-tions of this study, which are described below. The experiments should support a feasibility of the method.
• Which method is the best solution for classifying graph types?
• Which features of the data improve the performance of my proposed method and cause the data to be separable?
• What is the most appropriate dataset to serve as a new representative for classification?
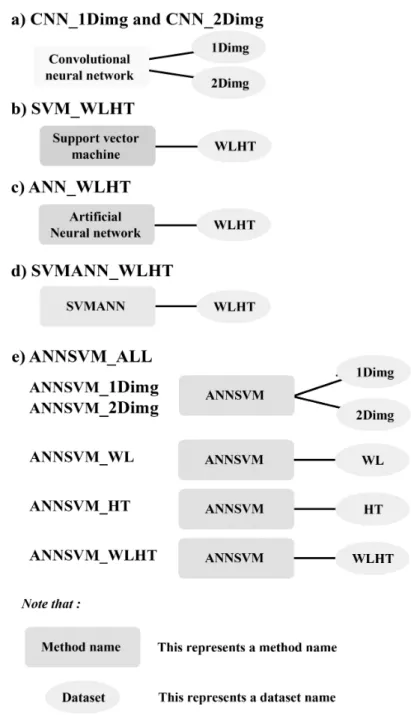
• What significant differences of results exist in my experiments?
Figure 3.4: Processes of all experiments: (a) applying the CNNs to 1Dimg and 2Dimg in CNN 1Dimg and CNN 2Dimg respectively, (b) applying the SVMs to WLHT in SVM WLHT, (c) applying the ANNs to WLHT in ANN WLHT, (d) applying the SVMANN to WLHT in SVMANN WLHT, and (e) applying the ANNSVM to all datasets in ANNSVM 1Dimg, ANNSVM 2Dimg, ANNSVM WL,
for this method because it often provides good results when performing with compli-cated information, and my datasets are nonlinear data. After I combined the outputs of the SVMs with a class label, I applied the ANNs to the outputs and obtained classification results. The last experiment was ANNSVM ALL (i.e., Figure 3.4e) in which I used my proposed method, i.e., the ANNSVM. Note that ANNSVM ALL represents the experiments conducted by ANNSVM with all datasets used in this study. In ANNSVM 1Dimg and ANNSVM 2Dimg, the ANNSVM was applied to 1Dimg and 2Dimg to compare results with those of CNN 1Dimg and CNN 2Dimg. In ANNSVM WL and ANNSVM HT, I also applied the ANNSVM to WL and HT because I needed to evaluate how data affected the system. Further, the most signifi-cant experiment was ANNSVM WLHT, in which I presented the performance of my main method applied to WLHT to indicate the effectiveness of my proposed idea. To evaluate my approach, I compared results to other experiments that also used WLHT. Regarding SVMANN WLHT and ANNSVM WLHT, I conducted experi-ments to show the difference of performance in a case that I switched their orders. A motivation for rearranging the order of algorithms was to examine whether the results had been influenced by algorithms switched.
In this study, accuracy values of each dataset showed the performance of each method. These values represent are the proportion of the total number of predictions that were correctly classified.
Note that I trained the ANNSVM models individually. Each model used independent parameters estimated by SVMs and ANNs parameter estimations. In practice, I applied ANNs to my data. Then, I obtained a new dataset from ANNs outputs, it will be an input for SVMs for classification.
3.3.2 Results
Figure 3.5: Results from CNNs and ANNSVM that used 1Dimg and 2Dimg: (a) table statistically showing summarized results and (b) bar graph graphically
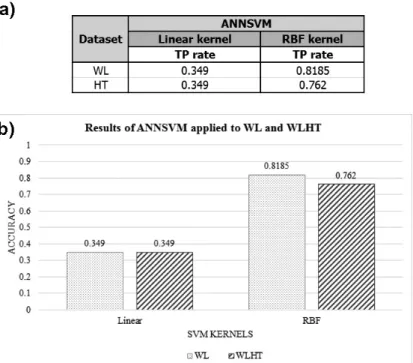
illustrating results from these experiments
Figure 3.6: Results from ANNSVN that used WL and HT a) table statistically showing summarized results and (b) bar graph graphically illustrating results from
these experiments
results of ANNSVM 1Dimg and ANNSVM 2Dimg with the linear kernel, i.e., ap-proximately 0.35; however, the experiment of my proposed method (i.e., ANNSVM with the RBF kernel) presented largely different results. In 1Dimg, the accuracy increased to 0.79. Comparing this results to those of 2Dimg applied to my proposed method, the accuracy was approximately 0.56. Thus, compared to two-dimensional images, the one-dimensional images were a better candidate for graph-type classifi-cation using ANNSVM with the RBF kernel.
Figure 3.7: Results from SVM, ANN, SVMANN, and ANNSVM that used WLHT: (a) table statistically presenting summarized results, (b) bar graph graph-ically illustrating results from SVM WLHT and ANN WLHT, and (c) bar graph
I conducted SVMs, ANNs, SVMANN, and ANNSVM with WLHT constructed from my preprocessing method. Results are shown in Figure 3.7.
The results of SVM WLHT showed accuracy for a RBF kernel as slightly better than that of a linear kernel as indicated in Figure 3.7b. They were on average 0.85 for the linear kernel and 0.86 for the RBF kernel. As for the outcome from ANN WLHT, it was moderately 0.83. Apparently, accuracy in SVM WLHT which used the SVMs was slightly more appropriate.
In SVMANN WLHT, I found accuracies for WLHT were stably high, with an average of 0.9, independent of wavelet families. The highest accuracy in SV-MANN WLHT was 0.905 in the case of Symlet 2. As for ANNSVM WLHT, the average accuracy was 0.87 for the RBF kernel (i.e., my proposed method) and 0.35 for the linear kernel. Though the average accuracy for my proposed method was slightly lower than that of the SVMANN in SVMANN WLHT, the highest accuracy among all experiments was 0.91 in the case of ANNSVM WLHT in which ANNSVM was applied to data obtained by Coiflet 1 (i.e., Figure 3.7c).
3.4
Discussion
information. During a convolution process, I possibly obtained the similar convolved images to used in a CNNs classification. This is because the values of pixels in the one-dimensional images roughly substitute for the location of objects in the two-dimensional images. For example, if black pixels, which stand for a larger number of counted pixels, are continuously concatenated in a portion of a one-dimensional im-age, the DFT decomposes them as low frequencies. As results of ANNSVM 1Dimg and ANNSVM 2Dimg showed, I obtained highly accurate results from my proposed method, particularly with a RBF kernel. my datasets were not linearly separable, thus a linear kernel did not work well. my proposed method offered substantially better results when it was applied to 1Dimg, whose dimensionality was reduced but the important information was preserved.
Using only the wavelet coefficients was inadequate for classification. For ex-ample, for the pie chart, I obtained large wavelet coefficients located in the low-frequency domain; however, if I changed a circle in the pie chart to other shapes, such as a radar chart, the wavelet transformation gave results that were similar to those of the original pie chart. The Hough transformation can solve this problem since it detects the shapes of objects.
I therefore assembled these two features in order to make my data more sep-arable.
Figure 3.8: Simulation of Coiflet 1 [73], analyzing as one-dimensional images
Further, I interpreted results from SVMANN WLHT and ANNSVM WLHT, which were the combination of a SVMs and an ANNs. In SVMANN WLHT, I consistently received good accuracy values, but the highest accuracy was provided by my proposed method. To analyze results from ANNSVM WLHT, I compared the linear and RBF kernels. Results showed that the linear kernel was not appropriate for my proposed method because my datasets are not linearly separable, whereas the RBF kernel provided higher accuracy values. The RBF kernel generally outperforms the linear kernel because the linear kernel is suitable if the number of features is larger than the number of instances or a dataset is a very large-scale dataset; however, in general, to obtain a good model, many instances should be employed for training. In this study, WLHT contained 198 attributes and 917 instances, and the temporary datasets produced by my proposed method contained four features and 917 instances. Because of these, the linear kernel was not appropriate. Results of ANNSVM WLHT suggested that the most suitable wavelet family was Coiflet 1 because the wavelet functions resemble the distribution of frequency in the one-dimensional images, as illustrated in Figure 3.8. Statistical analyses via ANOVA and the T-test showed that there was no significant difference between the results of SVMANN WLHT and ANNSVM WLHT with the RBF kernel. Therefore, based on this statistical evidence, I do not need to be concerned about the order of these methods. In other words, both ANNSVM and SVMANN can effectively classify graph images.
Figure 3.9: Illustration of three different wavelets [73] with three waves that have high amplitude values, as indicated in the dashed red circles: (a) mother wavelet of Coiflet 5, (b) mother wavelet of Symlet 10, and (c) mother wavelet of Symlet 20
wavelets also had a similar shape as that of Coiflet 5. For similar reasons, the Haar wavelet was not proper because it is a step function.
because the highest accuracy and an acceptable average value were obtained, both outperforming results of SVMANN WLHT.
Figure 3.10: Detailed accuracy separated by classes and a confusion matrix which belongs to the dataset of Coiflet 1 applied by my main method (ANNSVM)
With regard to accuracy values of each class as presented in Figure 3.10, I observed that the accuracy of the two-dimensional chart class was the lowest (i.e., 0.875), while others were over 0.9. Results here suggested that both the bar and pie classes have their own unique characteristics, as opposed to the 2Dchart class. For example, the graph images that contained some rectangles were individually categorized in the bar graph class. A similar phenomenon occurred for circles in the pie chart class. In contrast, the 2Dchart class contained mixed types of graphs; hence, the graph characteristics belonging to the 2Dchart class varied.
Our proposed method is a combination of the ANNs and the SVMs, thus called the ANNSVM. I used the ANNs to construct a temporary dataset, then applied the SVMs for graph-type classification. Results from my proposed method showed that my approach outperformed the traditional methods because when I concurrently use two effective algorithms the strengths of both are encouraged and the weaknesses mitigated. For example, the ANNs suffered from a problem of local minima, but the SVMs strategy solves this problem; hence, the results from my proposed method guarantee the global optimization.


![Figure 3.9: Illustration of three different wavelets [73] with three waves that have high amplitude values, as indicated in the dashed red circles: (a) mother wavelet of Coiflet 5, (b) mother wavelet of Symlet 10, and (c) mother wavelet of Symlet 20](https://thumb-ap.123doks.com/thumbv2/123deta/9766061.1850065/67.893.215.715.229.651/figure-illustration-different-wavelets-amplitude-indicated-circles-coiflet.webp)