Doctoral Dissertation
Shibaura Institute of Technology
A Study on User Behavior for
Assessing Symptoms of
Excessive SNS Usage
September 2018
A STUDY ON USER BEHAVIOR FOR
ASSESSING SYMPTOMS OF
EXCESSIVE SNS USAGE
PLOYPAILIN INTAPONG
A DOCTORAL DISSERTATION SUBMITTED IN PARTIAL FULFILLMENT OF THE REQUIREMENTS FOR
THE DEGREE OF DOCTOR OF ENGINEERING
IN THE
FUCTIONAL CONTROL SYSTEMS GRADUATE SCHOOL OF ENGINEERING SHIBAURA INSTITUTE OF TECHNOLOGY
i
Declaration of Authorship
I, Ploypailin INTAPONG, declare that this thesis titled, “A study on user behavior for assessing symptoms of excessive SNS usage,” and the work presented in it are my own. I confirm that:
This work was done wholly or mainly while in candidature for a research degree at Shibaura Institute of Technology.
Where any part of this thesis has previously been submitted for a degree or any other qualification at Shibaura Institute of Technology or any other institution, this has been clearly stated.
Where I have consulted the published work of other, this is always clearly attributed.
Where I have quoted from the work of others, the source is always given. With the exception of such quotations, this thesis is entirely my own work.
I have acknowledged all main sources of help.
Where the thesis is based on work done by myself jointly with other, I have made clear exactly what was done by others and what I have contributed myself.
Signed: ___________________________________ (Ploypailin INTAPONG)
Abstract
In this doctoral dissertation, I study on user behavior for assessing symptoms of excessive Social Network Site (SNS) usage.
With the emergence of SNSs, their usage has become a global consumer phenomenon. People are spending unexpected and unprecedented amount of time online. Such often excessive and compulsive use has been categorized as a behavioral addiction. Understanding how users behave on SNSs creates the opportunity for assessing the symptoms of excessive SNS usage to increase the awareness of excessive SNS usage. Therefore, I set my research goals as follows: designing and implementing a data collection application, clarifying the relationship between SNS usage and SNS addiction, identifying the effective factors associated with addiction components, and assessing symptoms of excessive SNS usage.
To achieve my first research goal, I design and implement the data collection application as a tool for aggregating SNS usage data from questionnaire and SNSs. Modified Internet Addiction Test (IAT) and Bergen Facebook Addiction Scale (BFAS) were employed as a part of questionnaire to measure SNS addiction and reflect addiction components. APIs were used for directly retrieving data from SNSs.
iv
To achieve my third research goal, I identified the effective factors associated with addiction components. I recruited additional participants and statistically analyzed their questionnaire and Facebook data to clarify the factors associated with addiction components, which are reflected by the question items of IAT and BFAS. The analytic results indicated the candidate of effective factors associated with each addiction component. Nevertheless, the effective factors were different for each addiction component, some were shared, and common effective factors were associated with both IAT and BFAS addiction components.
To achieve my last research goal, I proposed a new method used for assessing symptoms of excessive SNS usage. This new method is the combinations of the data collection application used for aggregating SNS usage data and the analysis methods used for identifying the effective factors associated with SNS addiction and those associated addiction components.
The method used for assessing the symptoms can be applied for developing appropriate prevention strategies for individual to increase the awareness of excessive SNS usage.
vii
Acknowledgements
I wish to express my appreciation to many people who have helped and inspired me during my research study in Shibaura Institute of Technology.
First, I would like to sincerely thank my supervisor, Prof. Michiko Ohkura, for her contribution of time, valuable advice, guidance, understanding, and patience during my research study. She was always accessible and willing to help her students with their researches and their lives. Her perpetual energy and enthusiasm had motivated me not only to my academic life but also to my personal life. With her valuable advises and help research life become smooth and rewarding for me.
Second, I would like to express my sincere gratitude to Prof. Tiranee Achalakul of Department of Computer Engineering of King Mongkut’s University of Technology Thonburi (KMUTT) who has provided an excellent opportunity for me to pursue my doctoral degree. I would not have been here without her support and encouragement. I would also like to extend my gratitude to my dissertation committees: Prof. Eiji Kamioka, Prof. Masaomi Kimura, Prof. Masahiro Inoue, and Prof. Toshi Kato for serving as my committee members even at hardship.
Next, I would like to thank Dr. Saromporn Charoenpit, Dr. Thongchai Kaewkiriya, Dr. Chitapong Wechtaisong, Suphaphorn Rungkrae, Penpitcha Prakaiborisuth, and friends of my elder brother for data collection. I would also like to thanks the participants who volunteer for my experiment.
viii
ix
Contents
Declaration of Authorship ... i
Abstract ... iii
Acknowledgements ... vii
List of Figures ... xiii
List of Tables ... xvii
Abbreviations ... xxvii
Chapter 1 Introduction ... 1
1.1 Motivation ... 1
1.2 Research Questions ... 4
1.3 Research Goals and Contributions ... 5
1.4 Organization of Dissertation ... 7
Chapter 2 Background Knowledge and Literature Review ... 9
2.1 Social Network Site ... 9
2.2 SNS Addiction ... 10
2.2.1 Definition of SNS addiction ... 10
2.2.2 Negative consequences of SNS addiction and symptoms ... 11
2.3 Measurement of SNS Addiction ... 14
2.4 Data Collection Methods ... 16
2.4.1 Self-reported data ... 16
2.4.2 SNS measurement ... 16
2.4.3 Application Deployment ... 17
CONTENTS
x
Chapter 3 Data Collection Application ... 21
3.1 Conceptual Design ... 21
3.2 Application Design ... 22
3.3 Design Detail and Implementation ... 24
3.3.1 Questionnaire design ... 24
3.3.2 Preliminary Experiment for Questionnaire Design ... 26
3.3.3 Implementation of questionnaire ... 28
3.3.4 Implementation of Twitter quiz ... 29
3.3.5 Implementation of Facebook quiz ... 31
3.3.6 Scheduling data collection for Twitter and Facebook ... 32
3.4 Database Design ... 33
3.5 Discussion ... 35
3.6 Summary ... 36
Chapter 4 SNS Usage and Its Relationship with SNS Addiction ... 37
4.1 Data Preparation ... 38
4.1.1 Data obtaining by application ... 38
4.1.2 Web log data ... 39
4.2 Data Pre-Processing ... 40
4.3 Questionnaire Results ... 41
4.3.1 Descriptive statistics ... 41
4.3.2 Relationships among questionnaire variables ... 45
4.3.3 SNS addiction ... 45
4.3.4 Correlation between IAT and BFAS ... 46
4.3.5 Difference between excessive and normal users ... 46
4.4 Facebook Results ... 52
4.4.1 Facebook usage ... 52
4.4.2 Relationships among Facebook variables ... 53
4.4.3 Facebook usage and SNS addiction ... 55
4.5 Twitter Results ... 56
4.5.1 Twitter usage ... 56
CONTENTS
xi
4.5.3 Twitter usage and SNS addiction ... 59
4.6 Web Log Results ... 59
4.6.1 SNS usage ... 59
4.6.2 Relationships among variables ... 62
4.6.3 SNS usage and addiction ... 63
4.7 Discussion ... 65
4.7.1 SNS usage ... 65
4.7.2 IAT and BFAS for SNS addiction ... 66
4.7.3 Effective factors associated with SNS addiction ... 66
4.7.4 Data limitation. ... 69
4.8 Summary ... 69
Chapter 5 Effective Factors Associated with Addiction Components ... 71
5.1 Addiction Components as Background Knowledge ... 72
5.2 Data Preparation ... 74
5.3 Comparison of Excessive and Normal Users between Addiction Components .. 75
5.4 Correlation between Addiction Components of IAT and BFAS ... 76
5.5 Clarification of Effective Factors for Addiction Components ... 76
5.5.1 Dataset ... 76
5.5.2 Method ... 77
5.5.3 Results ... 79
5.5.4 Ensemble of significant variables ... 101
5.5.5 Evaluation ... 104
5.5.6 Candidates of effective factors associated with addiction components ... 107
5.6 Discussion and Conclusion ... 110
Chapter 6 Discussion ... 113
6.1 Summary of Previous Chapters ... 113
6.2 Data Collection Application ... 114
6.3 SNS Usage and Its Relationship with SNS addiction ... 115
6.4 Effective Factors Associated with Addiction Components ... 116
CONTENTS
xii
6.6 Potential of this Research ... 118
Chapter 7 Conclusion and Future Work ... 119
7.1 Conclusion ... 119
7.2 Future Work ... 121
References ... 123
Appendix A Experimental Materials ... 137
A.1 Questionnaire Design ... 137
A.1 Data Collection Application ... 144
Appendix B SNS Data and Analysis Results ... 153
B.1 SNS Data ... 153
B.2 Analysis Results ... 158
B.2.1 T-test Results ... 158
B.2.2 ANOVA Results ... 170
B.2.3 Spearman’s Correlation Analysis Results ... 173
xiii
List of Figures
Figure 1.1 The growth of SNS users ... 2
Figure 1.2 Excessive usage and addiction ... 3
Figure 1.3 Organization of this dissertation... 8
Figure 2.1 Types of behavioral addiction ... 12
Figure 3.1 Conceptual design for data collection ... 22
Figure 3.2 Architecture overview of data collection application ... 23
Figure 3.3 Questionnaire evaluation ... 27
Figure 3.4 Screenshot of questionnaire ... 28
Figure 3.5 Screenshot of Twitter quiz: (a) start page (b) quiz result ... 29
Figure 3.6 process of authentication with Twitter ... 30
Figure 3.7 Screenshot of Facebook quiz: (a) start page (b) quiz result ... 31
Figure 3.8 Process of collecting activities data from SNSs ... 33
Figure 3.9 Database design ... 34
Figure 4.1 SNS account and usage ... 43
Figure 4.2 Decision tree for IAT ... 49
Figure 4.3 Decision tree for BFAS ... 50
Figure 4.4 Period of use of normal and excessive users ... 51
Figure 4.5 Period of user of normal and excessive users who did not use SNSs from 18:00-24:00 ... 51
LIST OF FIGURES
xiv
Figure 4.7 Frequency of Twitter usage ... 58
Figure 4.8 Number of users in each usage period ... 60
Figure 4.9 Normalization of number of sessions in each usage period ... 61
Figure 5.1 IAT addiction components... 72
Figure 5.2 BFAS addiction components ... 73
Figure 5.3 Method for identifying effective factors associated with addiction components79 Figure 5.4 Correlation between set of selected factors and IAT addiction components .... 105
Figure 5.5 Correlation between set of selected factors and BFAS addiction components 106 Figure A.1 Materials of preliminary experiment – cover page ... 138
Figure A.2 Materials of preliminary experiment – social network usage questionnaire: section A – personal information ... 139
Figure A.3 Materials of preliminary experiment – social network usage questionnaire: section B – social network usage part 1 ... 140
Figure A.4 Materials of preliminary experiment – social network usage questionnaire: section B – social network usage part 2 ... 141
Figure A.5 Materials of preliminary experiment – social network usage questionnaire: section C – social network behavior ... 142
Figure A.6 Materials of preliminary experiment – evaluation of social network questionnaire ... 143
Figure A.7 Home page ... 144
Figure A.8 Questionnaire – Instruction ... 145
Figure A.9 Questionnaire – Section A: Personal Information ... 145
Figure A.10 Questionnaire – Section B: Social Network Usage (part 1) ... 146
Figure A.11 Questionnaire – Section B: Social Network Usage (part 2) ... 147
Figure A.12 Questionnaire – Section C: Social Network Behavior (1) ... 148
Figure A.13 Questionnaire – Section C: Social Network Behavior (2) ... 149
Figure A.14 Questionnaire – Section C: Social Network Behavior (2) ... 150
LIST OF FIGURES
xv
LIST OF FIGURES
xvii
List of Tables
Table 3.1 Social Network Usage Questions ... 25
Table 3.2 IAT Modification ... 25
Table 3.3 BFAS Modification ... 26
Table 4.1 Example of defining session characteristics ... 41
Table 4.2 SNS usage behaviors of participants ... 42
Table 4.3 Location and device of accessing SNSs ... 42
Table 4.4 Correlation matrix among questionnaire variable ... 44
Table 4.5 IAT and BFAS level ... 45
Table 4.6 Correlation matrix between IAT and BFAS ... 46
Table 4.7 Discriminant analysis for IAT and BFAS ... 48
Table 4.8 Facebook usage in three-month period ... 52
Table 4.9 Correlation matrix among Facebook variables ... 54
Table 4.10 Mann-Whitney U Test for variables from Facebook ... 55
Table 4.11 Logistic Regression Analysis for variables from Facebook ... 56
Table 4.12 Twitter usage in three-month period ... 57
Table 4.13 Correlation matrix among Twitter variables ... 58
Table 4.14 Relationship among variables by Spearman’s correlation analysis ... 63
Table 4.15 Mann-Whitney U Test for number of sessions in each usage period ... 64
LIST OF TABLES
xviii
LIST OF TABLES
xix
Table 5.22 Significant variables associated with IAT addiction components from the results of methods 1-8 ... 102 Table 5.23 Significant variables associated with BFAS addiction components from the results of methods 1-8 ... 103 Table 5.24 Candidates of effective factors associated with IAT addiction components .... 108 Table 5.25 Candidates of effective factors associated with BFAS addiction components 109 Table B.1 Questionnaire data ... 154
Table B.2 Questionnaire – IAT and BFAS test results ... 155
Table B.3 Twitter user profile ... 155 Table B.4 Tweet ... 155 Table B.5 Facebook user profile ... 155 Table B.6 Post ... 156 Table B.7 Comment ... 156 Table B.8 Questionnaire variables ... 156 Table B.9 Facebook variables ... 156 Table B.10 Twitter variables ... 157 Table B.11 Addiction variables ... 157 Table B.12 Results of the T-test of the differences between questionnaire variables and IAT
addiction components salience ... 158 –
Table B.13 Results of the T-test of the differences between questionnaire variables and IAT
addiction components – excessive use ... 159
Table B.14 Results of the T-test of the differences between questionnaire variables and IAT
addiction components – neglecting work ... 160
Table B.15 Results of the T-test of the differences between questionnaire variables and IAT
addiction components – anticipation ... 161
Table B.16 Results of the T-test of the differences between questionnaire variables and IAT
addiction components – lack of control ... 162
Table B.17 Results of the T-test of the differences between questionnaire variables and IAT
LIST OF TABLES
xx
Table B.18 Results of the T-test of the differences between questionnaire variables and
BFAS addiction components – salience ... 164
Table B.19 Results of the T-test of the differences between questionnaire variables and
BFAS addiction components – mood modification ... 165
Table B.20 Results of the T-test of the differences between questionnaire variables and
BFAS addiction components – tolerance ... 166
Table B.21 Results of the T-test of the differences between questionnaire variables and
BFAS addiction components – withdrawal ... 167
Table B.22 Results of the T-test of the differences between questionnaire variables and
BFAS addiction components – conflict ... 168
Table B.23 Results of the T-test of the differences between questionnaire variables and
BFAS addiction components – relapse ... 169
Table B.24 ANOVA between questionnaire variables and IAT addiction components – salience ... 170 Table B.25 ANOVA between questionnaire variables and IAT addiction components – excessive use ... 170 Table B.26 ANOVA between questionnaire variables and IAT addiction components – neglecting work ... 170 Table B.27 ANOVA between questionnaire variables and IAT addiction components – anticipation ... 170
Table B.28 ANOVA between questionnaire variables and IAT addiction components – lack
LIST OF TABLES
xxi
LIST OF TABLES
xxii
LIST OF TABLES
xxiii
LIST OF TABLES
xxiv
LIST OF TABLES
xxv
LIST OF TABLES
xxvii
Abbreviations
Ajax = Asynchronous JavaScript and XML
ANOVA = Analysis of variance
APIs = Application programing interfaces
ATS = Addictive tendencies scales
BFAS = Bergen Facebook addiction scale
BSMAS = Bergen social media addiction scale
CI = Confident interval
CSS = Cascading style sheets
df = Degrees of freedom
DSM-IV = Diagnostic and statistical manual of mental disorders, 4th edition
F = F-value
FDQ = Facebook dependence questionnaire
FK = Foreign key
FQL = Facebook query language
GPA = Grade point average
HTTP = Hypertext transfer protocol
IADQ = Internet addiction diagnostic questionnaire
IAT = Internet addiction test
ID = Identification
ISPs = Internet service providers
Jquery = JavaScript library
JSON = JavaScript object notation
xxviii
n = number
OAuth = Open authentication
p = Probability value
P-value = Probability value
PHP = Recursive acronym for PHP: Hypertext preprocessor
PK = Primary key
Q = Question
RIA = Rich Internet application
SD = Standard deviation
SE = Standard Error
Sig = Significant
SNS = Social network sites
SNWAS = Social networking website addiction scale
SSO = Single sign-on
t = T-value
Chapter 1
Introduction
This chapter introduces the motivation underlying my doctoral dissertation “Study on User Behavior for Assessing Symptoms of Excessive SNS usage.” It also describes my research goal and contribution. Finally, the organization of my dissertation is presented.
1.1 Motivation
CHAPTER 1. INTRODUCTION 2
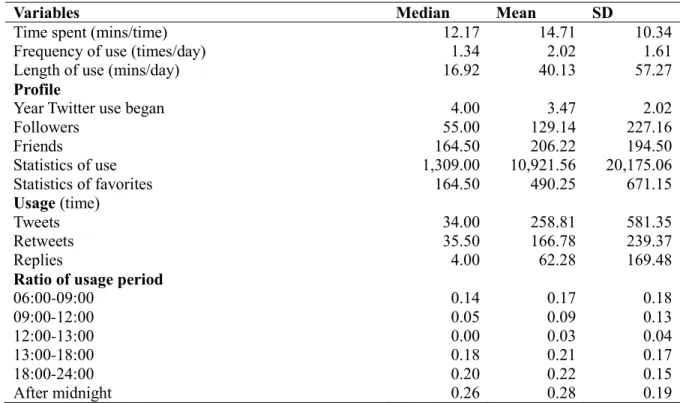
connect [2]. SNSs tends to be used for social purposes [3]. In addition, many businesses also use them as tools to enhance better relational experiences with their employees and customers [4]. With the emergence of SNSs, their usage has become a global consumer phenomenon. Figure 1.1 illustrates the growth of SNS users from 2012-2017. Over six years, SNS users has risen 88%, from 1.7 billion to 3.2 billion users [5]. In 2017, the active SNS users are about 42% of the world’s population.
Figure 1.1 The growth of SNS users
In term of usage, online users have an average of seven SNS accounts. Over 80% of Facebook users log on at least once a day, and 30% of Twitter users and Instagram users log on daily. Furthermore, SNS users spend an average of two hours on SNSs every day [6]. In Thailand, over 50% of population are active SNS users and 96% of Thai Internet users use SNSs [7]. The top three most popular SNSs are YouTube, Facebook and, Line [7]. The average daily SNS use was almost three hours [7].
Some people spend too much time on SNSs and use them in ways that are becoming excessive. Excessive SNS users can spend many hours on SNSs for numerous reasons without being addicted to them [8]. A key distinction between excessive SNS usage and SNS addiction is that the latter, in contrast to the former, is associated with
7.018 7.095 7.210 7.395 7.476 7.593 1.720 1.857 2.078 2.307 2.789 3.196 0 1 2 3 4 5 6 7 8 2 0 1 2 2 0 1 3 2 0 1 4 2 0 1 5 2 0 1 6 2 0 1 7 N u mb er o f p eo p le ( b ill io n )
Growth of SNS users
CHAPTER 1. INTRODUCTION 3
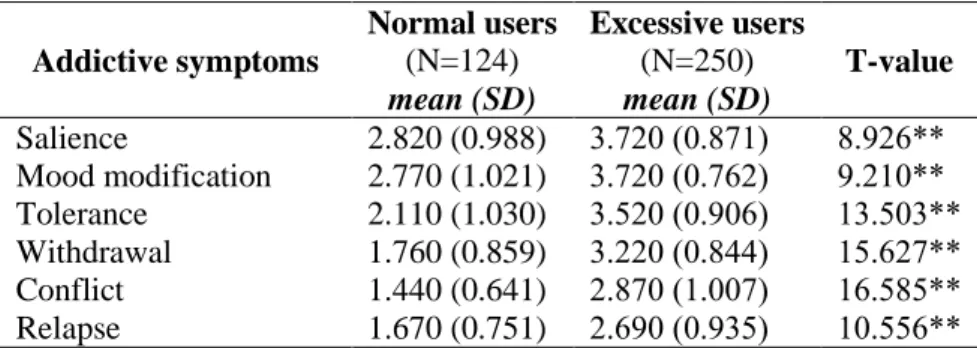
unfavorable consequences, and that SNS becomes uncontrolled and compulsive. In short, excessive users remain in control [9]. However, excessive usage often associated with a loss of sense of time [10] and addicts have the excessive behaviors. Researchers have suggested that excessive users have a possibility to become addicts [11-13]. Figure 1.2 illustrates the comparison between excessive usage and addiction.
Figure 1.2 Excessive usage and addiction
CHAPTER 1. INTRODUCTION 4
Even though researchers were drawn to the emerging phenomenon of SNS addiction and its relationships with others (e.g. SNS usage pattern, interpersonal relationship, and other addictions), SNS addiction has received relatively less attention compared to other kinds of addictions [28].
1.2 Research Questions
The use of SNSs continues to dramatically increase. People are spending unexpected and unprecedented amount of time online. Such often excessive and compulsive use has been categorized as a behavioral addiction. Understanding how people behave with SNSs creates opportunities for assessing the symptoms of excessive SNS usage. Therefore, I addressed the following questions.
1. How to aggregate SNS usage data for analysis?
There are many different types of data and collection methods that can help in studying SNS user behaviors [29]. The technical issue of existing data collection methods is that while they present benefits and provide useful data, these methods have limitations. For example, self-report measures are less accurate than actual behavior and some data on SNSs cannot be collected by their APIs [30]. Moreover, there are the large amount and kinds of data generated by SNSs [29]. Therefore, I set this question as the first one.
2. What is the relationship between SNS usage and SNS addiction?
CHAPTER 1. INTRODUCTION 5
3. What is the SNS usage that correlates with addiction components?
According to the review of [12], the studies in SNS addiction are classified into four types: (1) Self-perception studies of social networking addiction, (2) Studies of social networking addiction utilizing a social networking addiction scale, (3) Studies examining the relationship between social networking and other online addictions and (4) Studies examining social networking addiction and interpersonal relationships. A few researches have addressed the studies of addiction components. However, the standard analysis methods are not established. Therefore, I set this question as the third one.
4. How to assess the symptoms of excessive SNS usage?
Users can use SNSs extremely without be addicted if they are still in control. [9-11]. However, excessive usage often associates with a loss of sense of time [10] and addicts have the excessive behaviors. Researchers have suggested that excessive users have a possibility to become addicts [11-13]. Therefore, I set this question as the final one.
To answer these questions, I will design and develop a data collection application and use it to aggregate SNS usage data for analysis. After that, I will experimentally collect SNS usage data and statistically analyze them to identify the effective factors associated with SNS addiction and those associated with addiction component. Effective factors are SNS usage variables that differentiated excessive from normal users. Finally, the combination of data collection application and analysis methods used for assessing the symptoms of excessive SNS usage.
1.3 Research Goals and Contributions
CHAPTER 1. INTRODUCTION 6
1. Designing and implementing a data collection application
I design and implement the data collection application because there are large amount and kinds of SNS data. This application is designed to aggregate data from various sources represent SNS usage in different aspects. It should be designed and implemented first for collecting data for analysis to achieve the second and third research goals.
2. Clarifying the relationship between SNS usage and SNS addiction
The data obtained by the data collection application (result of the first goal) are analyzed by various analysis methods to clarify the relationship between SNS user behaviors and SNS addiction to achieve the second research goal.
3. Identifying the effective factors associated with addiction components
The data obtained by the data application are also analyzed by various methods to identify the effective factors associated with addiction components to achieve the third research goal.
4. Assessing symptoms of excessive SNS usage
Addiction components are named from associated symptoms. There is the possibility for excessive users to become addicts. Therefore, the symptoms of excessive usage may resemble those of addiction. To assess the symptoms of excessive SNS usage, the combinations of the data collection application and those analysis methods used for identifying effective factors associated with SNS addiction and those associated with addiction components can be applied for assessing the symptoms of excessive SNS usage to achieve the fourth research goal.
CHAPTER 1. INTRODUCTION 7
1.4 Organization of Dissertation
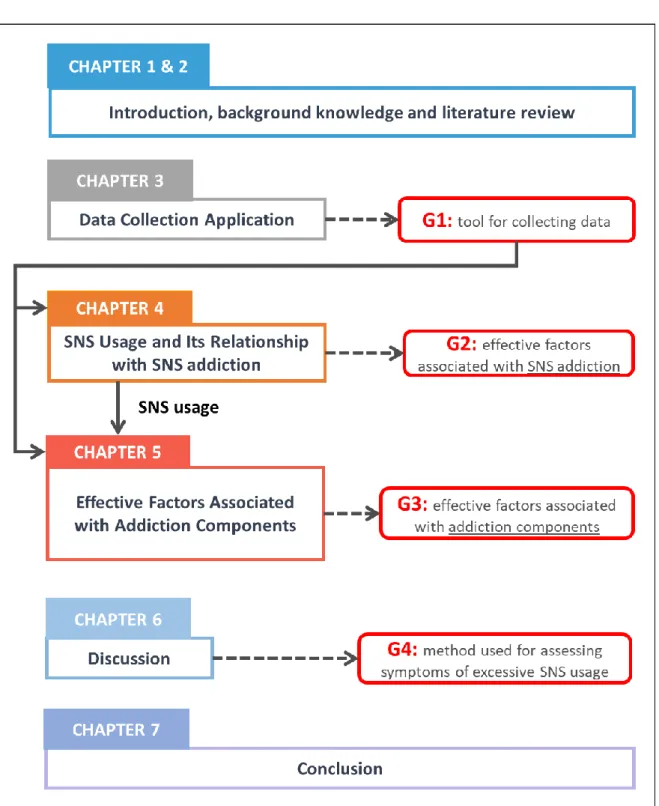
This dissertation consists of seven chapters including this one, which are organized as follows. Figure 1.3 shows the organization of this dissertation.
Chapter 2 presents background knowledge and a literature review of the current researches in SNS, behavioral addiction, measurement of SNS addiction, and data collection.
Chapter 3 presents the design and implementation of data collection application to achieve the first research goal. The data collection application, the outcome of the first research, is a tool for aggregating SNS usage data for analysis in Chapter 4 and 5.
Chapter 4 presents the SNS usage and its relationship with SNS addiction. I experimentally collected SNS usage data using the data collection application (Chapter 3) and employed web data. I analyzed the obtained data to clarify the relationship between SNS usage and SNS addiction to achieve the second goal. The outcomes of the second research goal were the effective factors associated with SNS addiction.
Chapter 5 presents the effective factors associated with addiction components. The data obtained by application (Chapter 3) and SNS usage (Chapter 4) are used in Chapter 5 to identify the effective behavioral factors associated with addiction components to achieve the third goal. The outcomes of the third goal were effective factors associated with each addiction component.
Chapter 6 discusses the methods used to achieve the research goals including the combination of them for assessing the symptoms of excessive to achieve the last research goal. This chapter also discusses the unique of this dissertation and the outcomes to increase awareness of the risks of excessive SNS usage
CHAPTER 1. INTRODUCTION 8
Chapter 2
Background Knowledge and
Literature Review
2.1 Social Network Site
Ellison and Boyd [36] suggested that “Terminology varied widely with the interchangeable use of ‘social networking sites, ‘online social networks’ or even simply, ‘social network’ to refer to a diffuse – and sometimes improbable – range of sites and services”. They argued that the term of “Social Network Sites” is more accurate that other terminologies because it emphasizes the role of networks, unlike previous online interaction space.
CHAPTER 2. BACKGROUND KNOWLEDGE AND LITERATURE REVIEW 10
(1) construct a public or semi-public profile within a bounded system, (2) articulate a list of other users with whom they share a connection, and (3) view and traverse their list of connections and those made by others within the system.” According to Burke [38], “social networking is all about engagement – creating relationships, communicating with your readers, building your following and connecting with your online audience.” Wikipedia [39] defines social networking services or sites as platforms that allow people with common interests, activities, backgrounds, or real-life connections to create social relations.
The first social network sites, launched in 1997, was SixDegrees.com, which allowed people to connect with others and send messages [37]. The next wave of SNSs included Friendster, which was launched in 2002. While other SNSs were designed to facilitate meetings between strangers with similar interests, Friendster helped friends of friends meet [37]. In 2004, Facebook was established on a college network and expanded worldwide [1]. Currently, it is the most successful SNS [1]. In 2016, Facebook had almost 1.5 billion users, added six new users every second [6].
Due to shifts in technology, some features have improved SNS user experiences: integration of SNSs with other tools and sites by Application Programming Interfaces (APIs, a form of third-party integration) and using SNS credentials for site authentication (single sign-on: SSO). SNSs provided several features to update profiles easily, such as status updates for Facebook and tweets for twitter. SNSs also began to support media sharing, including posting photographs and videos and access by mobile phones and tablets [36].
2.2 SNS Addiction
2.2.1 Definition of SNS addiction
CHAPTER 2. BACKGROUND KNOWLEDGE AND LITERATURE REVIEW 11
relationships, and/or psychological health and well-being.” In other word, SNS addiction is the excessive and compulsive behaviors on SNSs that lead to various negative consequences [11, 12, 14, 40, 41].
2.2.2 Negative consequences of SNS addiction and symptoms
SNS addiction leads to various negative consequences. People who spend too much time on SNSs are less involved in their real life communities [15]. They become preoccupied with and devote most of their time to SNSs [16, 17]. According to study examining the relationship between academic achievement and SNS usage, students who use SNS had lower grades than those who did not use [18-20]. A potential explanation for this may be that students are easily distracted and exercise poor time management [19]. A case study of a SNS addict reported loss of job due to the SNS behavior [21]. Moreover, SNS addicts had more sleep problems and poorer sleep quality compared to non-SNS addicts [11, 22]. Some studies reported a link between SNS addiction and depression and anxiety [20, 23], whereas other reported poor self-esteem and well-being [23-25]. In Thailand, many teenagers suffer from such negative effects of excessive SNS usage as lack of sleep, reduced academic performance, inappropriate manners, negative emotional expressions, impairment of family and social functions, and mental health problems [42].
CHAPTER 2. BACKGROUND KNOWLEDGE AND LITERATURE REVIEW 12
Figure 2.1 Types of behavioral addiction
Internet addiction is one type of behavioral addiction. Young [45, 46] addressed Internet addiction in five categories: computer addiction, information overload, net compulsion, cyber-sexual addiction, and cyber-relationship addiction. SNS addiction falls in the last category [1]. Such extreme cases have led to some researchers to conceptualize SNS addiction as Internet spectrum addiction disorder [21]. This indicates that SNS addiction can be classified with the large framework of Internet addiction [47].
CHAPTER 2. BACKGROUND KNOWLEDGE AND LITERATURE REVIEW 13
conduct the behavior excessively, psychological and physical withdrawal symptoms, loss of control, development of tolerance to induce and perceive the expected psychotropic effect (e.g., pathological gamblers gamble several slot machines at the same time) [51]. Griffiths [26] build on other researchers’ consensus to define a behavioral addiction by six core addiction components: salience, tolerance, mood modification, conflict, withdrawal, and relapse. The addiction components are named from associated symptoms [27]. Griffiths argues that any behavior that fulfills these six addiction components can be defined as an addiction [26].
SNS addiction shares similarities with other behavioral addictions [1, 11]. Kuss and Griffiths [1] argued that its symptoms resemble those of other behavioral addictions. In relational to SNS, the six addiction components are as follows:
(1) Salience – SNSs become the most important activity in a person’s life. Addicts dominate their thinking, feeling, and behavior. For example, they will think about the next time they will use SNSs.
(2) Mood modification – The engagement that modifies/changes emotional states. Addicts use SNSs in order to reduce feelings of guilt, anxiety, restless, helplessness, and depression, in order to forget about personal problems.
(3) Tolerance – Addicts spend much more time on SNSs than intended and they gradually increase amount of time spent every time.
(4) Withdrawal – Addicts typically become unpleasantness e.g. stressed, restless, troubled, or irritable when the use is restricted.
(5) Conflict – This refers to the conflicts between a person and those around that person, conflicts with other activities, or from within the individual himself/herself. Addicts give a lower priority to other activities and ignore their family and friends because of SNSs.
CHAPTER 2. BACKGROUND KNOWLEDGE AND LITERATURE REVIEW 14
2.3 Measurement of SNS Addiction
Several screening instruments have appeared in the literature. The earliest diagnostic criterion was the Internet Addiction Diagnostic Questionnaire (IADQ) proposed by Young in 1996 [52]. She developed eight yes/no questions as an initial screening instrument based on the DSM-IV criteria of pathological gambling and alcoholism. In 1998, she modified IADQ and proposed the Internet Addiction Test (IAT) [45].
IAT is a 20-items questionnaire that measures the characteristics and behaviors associated with compulsive Internet use. It is scored on 6-point Likert scale that ranges from rarely to always and includes not applicable. The scores of compulsive use range within the following four levels: none (0-30), normal Internet user; mild (31-49), sometimes online too long but able to control usage; moderate (50-79), experiences frequent problems; and severe (80-100), significant impact on daily life.
Owing to the growth of SNSs and the negative consequences of excessive SNS usage, several screening instruments have been specifically developed for assessing the problematic use of SNSs. For example:
Addictive Tendencies Scale (ATS). It is a three-item questionnaire for excessive text messaging/instant messaging [53]. It is scored on 7-point Likert scale that ranges from strongly disagree to strongly agree. Cut-off scores are not suggested.
Bergen Facebook Addiction Scale (BFAS). It is a six-item questionnaire that assesses Facebook addiction in epidemiology studies and clinical trials [11]. It is scored on 5-point Likert scale from very rarely (0) to very often (4). The total addiction score ranges from 0 to 24 points. The cut-off score for excessive users is 12 points (e.g., scoring 3 or above on at least four of the six items).
CHAPTER 2. BACKGROUND KNOWLEDGE AND LITERATURE REVIEW 15
Facebook Dependence Questionnaire (FDQ). It is an eight-item questionnaire for measuring Facebook dependence [22]. The answer is Yes/No format. The cut-off score is answering “Yes” on at least five items.
Social Networking Website Addiction Scale (SNWAS). It is a five-item
questionnaire, which was developed based on video game
engagement/addiction scales [55]. It is scored on 7-point Likert scale that ranges from completely disagree to completely agree. Cut-off scores are not suggested. The high score indicates SNS addiction.
In this study, I measured SNS addiction with two tests: the Internet Addiction Test (IAT) and the Bergen Facebook Addiction Scale (BFAS) with the following reasons.
Internet addiction is one type of behavioral addiction. Young [45, 46] identified five types of Internet addiction: computer addiction, information overload, net compulsion, cyber-relationship addiction. SNS addiction falls in the last category [1]. IAT covers a variety of Internet usage behaviors and common addiction symptoms. It has been widely cited in the research and translated in several languages: Arabic [56], German [57], French [58], Japanese [59], and Thai [60], and had developed new scales based on it [61-63]. Among similar tests, the IAT provides the standardization, reliability, and validity.
Since Facebook has become one of the world’s most commonly used Internet sites, research in the SNS addiction fields has largely focused on it. BFAS was translated into several languages and has shown good psychometric [11][42][40][8]. Then, a modified version of BFAS named Bergen Social Media Addiction Scale (BSMAS) was proposed in 2017 [54]. The modification involves using the word “social media” instead of the word “Facebook.”
CHAPTER 2. BACKGROUND KNOWLEDGE AND LITERATURE REVIEW 16
2.4 Data Collection Methods
Understanding user behavior on SNSs has attracted great interest in such research fields as sociology [31, 32], marketing [33, 34, 64], and healthcare [29, 35]. Researchers have studied it by collecting the data of SNS usage behaviors as a first step [29, 32, 65-68]. Many types of data and collection methods exist. Abdesslem et al. [29] summarized the existing data collection methods as follows.
2.4.1 Self-reported data
This approach gathers difficult to obtain or expensive data and save times. It can be implemented on such large samples as web questionnaire systems [67]. Most researchers have employed this method in their studies for various purposes [62, 63, 65, 69-76]. Self-reported data may be useful for understanding user behavior, but their information may be inaccurate when users forget their experiences. Some research in human behavior areas has argued that self-report measures are less accurate that actual behavior [29, 30, 77]. For instance, Young and Quan-Haase [77] conducted a survey about information revelation on Facebook. The results showed that the participants are often have forgotten what information they have disclosed and which privacy settings they have activated.
2.4.2 SNS measurement
CHAPTER 2. BACKGROUND KNOWLEDGE AND LITERATURE REVIEW 17
Some studies collect data by tracing network traffic from Internet service providers (ISPs) [29, 80]. HTTP traffic activities through the network are recorded as web log files. Web log files can inform about what types of websites are accessing. Nevertheless, this approach can represent only the activities in the same network. Other activities outside cannot be traced.
2.4.3 Application Deployment
This application monitors records and logs the operations and activities of users while they are using computers or smartphones and provides flexibility and privacy for data access [29]. Unfortunately, researchers need to install applications on user devices and manually get the data.
Regarding such existing data collection methods, they are all useful to capture user behaviors, even though they have some limitations. Abdesslem et al. [29] believe that “more reliable data can be obtained by using a new methodology based on the combinations of existing methods: this way, the data collected come from different sources and describe better users’ behaviors.” In this dissertation, I aggregated data for analysis from self-reported questionnaire, SNSs via APIs, and web log.
2.5 Empirical Studies of SNS addiction
According to the review of Griffiths et al. [12], the increase in amount of SNS usage drew many researchers to be interested in SNS addiction. They classified such studies into four types:
CHAPTER 2. BACKGROUND KNOWLEDGE AND LITERATURE REVIEW 18
addiction. None of these studies employed assessment scale for measuring SNS addiction.
(2) Studies of social networking addiction utilizing a social networking addiction scale. Using a survey-based method, Poh et al. [65] examined the relationship between social networking dependency and mood modification. Wan et al. [63] assessed SNS addiction in a sample of 335 Chinese college students using the IAT [45] modified for Chinese SNS, namely Xiaonei.com. A study by Cam an Isbulan [62] examined gender differences in Facebook addiction among 1,257 Turkish university students by adapted IAT [45] and named the new instrument as Facebook Addiction Scale (FAS).
(3) Studies examining the relationship between social networking and other online addictions. A study by Kittinger et al. [73] examined how the use of Facebook relates to problematic Internet use. IAT [45] was used to assess Internet addiction. Another study also used IAT [45] for assessing SNS game addiction. Andressen [74] examined the relationship between additive use of social media and video game.
(4) Studies examining social networking addiction and interpersonal relationships. A study by Porter et al. [75] examined the relationship between social media use, interpersonal relationship satisfaction, and addiction. Wilson et al. [24] also examined the relationship between extraversion and addictive tendencies. Another study [76] conducted a paper-based survey to determine Facebook addiction among Turkish university students and found a relation between loneliness levels and time on Facebook.
CHAPTER 2. BACKGROUND KNOWLEDGE AND LITERATURE REVIEW 19
Moreover, a few researches have addressed the studies of addiction components (e.g. salience, tolerance, mood modification, conflict, withdrawal, and relapse). For example, Poh et al. [65] examined the relationship between social networking dependency and mood modification. They employed the Internet-Related Problem Scale (IRPS) [84] for measuring SNS addition, modified Pathological Internet Use (PIU) [85] for assessing social networking dependency, and Chinese Internet Addiction Inventory (CIAI) for measuring mood modification [63]. Pearson’s correlation analysis was used and found that mood modification correlated positively with SNS addiction. Chou and Hsiao [86] analyzed the qualitative data and discovered that pleasurable changes in mood as a consequence of being online as opposed to the feeling of being irritable, angry or moody when Internet dependents are offline.
In addition, the participants of SNS addiction studies are young SNS users (aged 11-30 years). This may because of young people tend to be more likely engage in SNSs [1, 5]. They are the majority of SNS users for studies of SNS addiction.
CHAPTER 2. BACKGROUND KNOWLEDGE AND LITERATURE REVIEW 20
Chapter 3
Data Collection Application
This chapter presents the design and development of a data collection application. From background knowledge and literature review of existing data collection methods (section 2.4), the data collection application is designed and implemented as a tool for collecting SNS usage data from questionnaire and SNSs. Design and implementation are described as below.
3.1 Conceptual Design
CHAPTER 3. DATA COLLECTION APPLICATION 22
conceptual design of the data collection application.
Figure 3.1 Conceptual design for data collection
3.2 Application Design
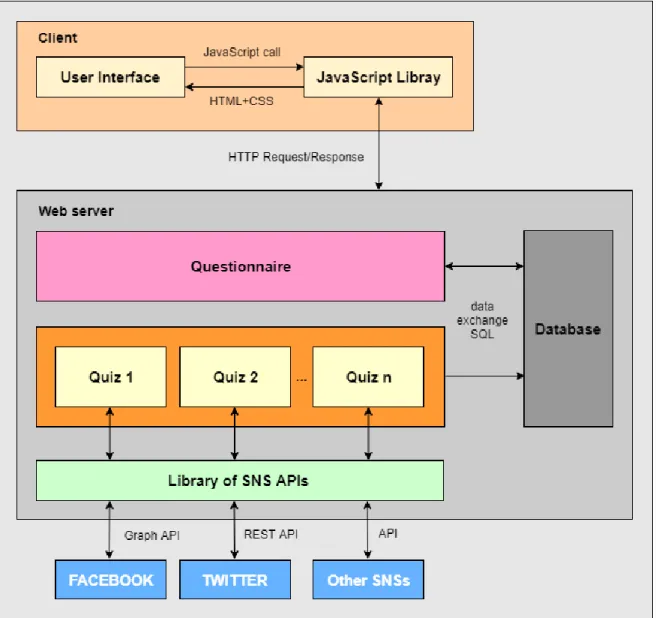
The data collection application can be referred to as client-server architecture, which is software architecture that describes communication between clients and servers. This application has two parts: questionnaire and quizzes. Questionnaire is employed for gathering the user experiences of SNSs. Quizzes are implemented to engage and motivate users for data collection, which retrieve from SNSs via APIs. They are small games that ask such questions as “How often do you Tweet?” When users complete the quizzes, the SNS data are retrieved by APIs. In this study, I focused on retrieving data from Facebook and Twitter. Figure 3.2 shows an architecture overview of the data collection application.
The client and server establish a connection and transmit the data using HTTP protocol. On the client side, the interaction and communication occur within a Rich Internet Application (RIA), which has the characteristics of a browser-based application. RIA provides opportunities to reduce the load of web servers. The interaction between users and web interfaces, such as clicking buttons and validating forms, are handle by JavaScript library. On the server side, the authentication and retrieving data between web server and SNSs is handle by the library of SNS APIs e.g. Graph API and REST API. The obtained data from questionnaire and SNSs are stored in a database.
CHAPTER 3. DATA COLLECTION APPLICATION 23
drives. If the same user completes another questionnaire or quiz, the data are stored with the existing unique identifiers.
I will explain the design detail and implementation of questionnaire, Facebook quiz and Twitter quiz including the methods for retrieving data in next section.
CHAPTER 3. DATA COLLECTION APPLICATION 24
3.3 Design Detail and Implementation
Based on the application design, I implemented the data collection application based on a bootstrap framework and a PHP platform [88, 89]. Bootstrap is used as a front-end framework, which combines HTML, CSS, and JavaScript and supports responsive screens from small mobiles to large desktop. PHP is used as a server scripting language.
3.3.1 Questionnaire design
I designed the questionnaire for gathering user experiences with SNSs [87]. There are three main parts as below.
I. Personal information
This part contains five questions, which ask for personal information that are gender, age, occupation, nationality, GPA and familiarity of using computer and Internet.
II. SNS usage
This part contains ten questions (Table 3.1), which is divided into two parts. Participants are asked about experience in using SNSs in the first part and indicated the frequency of usage in the second part.
III. SNS addiction
CHAPTER 3. DATA COLLECTION APPLICATION 25
Table 3.1 Social Network Usage Questions
1 How long have you been using SNSs? 2 Why do you use SNSs?
3 How much time do you spend on SNSs in each day? 4 How long do you spend on SNSs in each time? 5 How often do you use SNSs?
6 What time do you usually use SNSs? 7 Where do you use SNSs?
8 What device do you use for using SNSs? 9 Which SNSs do you currently use? 10 Which activities do you do on SNSs?
Table 3.2 IAT Modification
1 How often do you find that you use SNSs longer than you intended? 2 How often do you neglect household chores to spend more time on SNSs? 3 How often do you prefer the excitement of SNSs to intimacy with your partner? 4 How often do you form new relationships with people on SNSs?
5 How often do others in your life complain to you about the amount of time you spend on SNSs?
6 How often do your studies or work suffer because of the amount of time you spend on SNSs? 7 How often do you check SNSs before something else that you need to do?
8 How often does your job performance or productivity suffer because of SNSs?
9 How often do you become defensive or secretive when anyone asks you what you do on SNSs? 10 How often do you block out disturbing thoughts about your life with soothing thoughts of SNSs?
11 How often do you find yourself anticipating when you will use SNSs again?
12 How often do you fear that life without the SNSs would be boring, empty, and joyless? 13 How often do you snap, yell, or act annoyed if someone bothers you while you are on SNSs? 14 How often do you lose sleep due to SNSs?
15 How often do you feel preoccupied with SNSs, or fantasize about using SNSs? 16 How often do you find yourself saying “just a few more minutes” when using SNSs? 17 How often do you try to cut down the amount of time you spend on SNSs and fail? 18 How often do you try to hide how long you spend on SNSs?
19 How often do you choose to spend more time staying on SNSs over going out with others? 20 How often do you feel depressed, moody, or nervous when you are not on SNSs, which go
CHAPTER 3. DATA COLLECTION APPLICATION 26
Table 3.3 BFAS Modification
1 You spend a lot of time thinking about SNSs or plan use of SNSs 2 You feel an urge to use SNSs more and more.
3 You use SNSs in order to forget about personal problems. 4 You have tried to cut down on the use of SNSs without success.
5 You become restless or troubled if you are prohibited from using SNSs. 6 You use SNSs so much that it has had a negative impact on your job/studies.
3.3.2 Preliminary Experiment for Questionnaire Design
3.3.2.1 Method
To evaluate the design of my questionnaire, I conducted a preliminary experiment of its content validity and usability [87].
Seventeen Shibaura Institute of Technology (SIT) students participated in this experiment: eight males and nine females, between 20-30 years of age. Their nationalities were Brazilian, Malaysian, Thai, Vietnamese, Indonesian, and Japanese. They completed the SNS usage questionnaire (see Appendix A), which is in English language. Because of participants are not native English speakers, I allowed them to circle any words that confused them and skip any question that they could not answer for content validity and reliable result. Finally, participants completed an evaluation questionnaire (see Appendix A) that used a 5-point Likert scale that ranged from “strongly disagree” to “strongly agree” as feedback for questionnaire evaluations. Additionally, I observed and recorded the start to finish times for each part of the questionnaire while participants answered it.
3.3.2.2 Result
CHAPTER 3. DATA COLLECTION APPLICATION 27
frequently chosen as being confusing; that word is also in the question that had the highest skipping frequency.
Figure 3.3 Questionnaire evaluation
The feedback for the SNS usage questionnaire from the participants is shown in Figure 3.3. Most participants did not think that the SNS usage questionnaire or the time spent answering was too long. Most agreed that the questions were clear and easy to understand without complicated syntax. Seven of the 17 participants understood each question clearly without any confusion.
3.3.2.3 Discussion
CHAPTER 3. DATA COLLECTION APPLICATION 28
native English speakers. Because, I should not rewrite or add descriptions to avoid distorting of the original meaning of each question. Thus, I should allow the participants to skip questions to avoid imprecise data.
In conclusion, the results showed that the questionnaire has validity and usability as an instrument for gathering data.
3.3.3 Implementation of questionnaire
Based on the design, I implemented a web-questionnaire as one part of data collection application. The interface of questionnaire is shown in Figure 3.4. The interactions, navigation, and form validation of the questionnaire are handled by JQuery (JavaScript library). The questionnaire data are asynchronously sent to server-side using Ajax in a JSON format (in the background).
CHAPTER 3. DATA COLLECTION APPLICATION 29
3.3.4 Implementation of Twitter quiz
I implemented Twitter quiz for retrieving usage data from Twitter. Twitter quiz is a small game that asks question “How often do you Tweet?” and get the answer, which retrieved from Twitter through APIs. The interface of Twitter quiz is shown in Figure 3.5.
(a) (b)
Figure 3.5 Screenshot of Twitter quiz: (a) start page (b) quiz result
Twitter provides two APIs [78] for accessing its data: REST API and Streaming API. The Streaming API is appropriate for long-running requests, which are in real-time. However, since real-time APIs are not necessary for this study, I chose the REST API for retrieving Twitter activities in my implementation.
The REST API identifies Twitter applications and users using OAuth authentication and uses an HTTP-based communication interface. This API provides two operations: read and write for accessing Twitter data and response data in a JSON formation.
The following is the steps for implementing Twitter quiz [90]: 1. Create Twitter account
CHAPTER 3. DATA COLLECTION APPLICATION 30
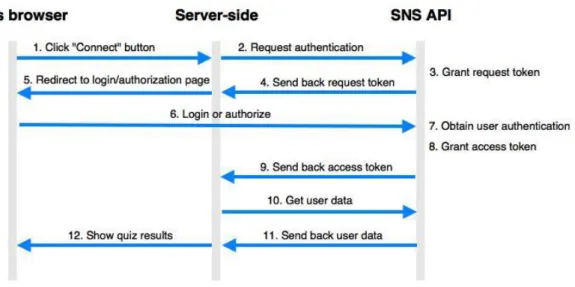
The procedures for creating Twitter account and application are explained in [78]. In order to authenticate with Twitter, I used PHP wrapper, TwitterAPIExchange.php for authentication. Keys and tokens from second step are used in this step. The authentication process is illustrated in Figure 3.6. When user plays Twitter quiz by clicking “Connect with Twitter” button, the data collection application requests token from Twitter. Twitter grant request token and send back to my application. User’s interface is redirected to Twitter authentication page. User login (once user is logged in, click “authorize app”). Then, Twitter verify the authentication, grant access token and send back to the data collection application. Finally, the data collection application can access Twitter data. The communication between user, data collection application and Twitter is based on HTTP interface. After successful authentication with Twitter, I collected two types of Twitter data: user profile and activities such as tweet, retweet, reply, and favourite/like (see Appendix B).
Even though I retrieved the data of favorite/like actions, I failed to get their action times because Twitter does not provide them. Instead, I collected the information of favorite/like action tweets.
CHAPTER 3. DATA COLLECTION APPLICATION 31
3.3.5 Implementation of Facebook quiz
I implemented Facebook quiz for retrieving usage data from Facebook. Facebook quiz is a small game that asks question, “Popular Facebook profile in 2013-2016 is …” and get answer, which retrieved from Facebook through APIs. The interface of Facebook quiz is shown in Figure 3.7.
(a) (b)
Figure 3.7 Screenshot of Facebook quiz: (a) start page (b) quiz result
I used Graph API [79] provided by Facebook for accessing its data. Graph API is the primary way to access data on the Facebook platform based on HTTP. This API has multiple versions. In our implementation, we used Graph API version 2.5, which is the latest version published in 2015.
Most Graph API requests require an access token, which is “an opaque string that identifies a user, app or page” [79], generally obtained in the OAuth authentication process. The steps for implementing Facebook quiz are the same as implementing Twitter quiz as follows:
CHAPTER 3. DATA COLLECTION APPLICATION 32
After successfully authentication with Facebook, I collected two types of Facebook data: user profile and activities such as post, comment, and like (see Appendix B).
3.3.6 Scheduling data collection for Twitter and Facebook
After successfully authentication with Twitter and Facebook, the next step is collecting their data. Due to their data size and the maximum execution time for PHP scripts, the whole data (user profile and activities data) cannot be retrieved at once. Therefore, only user profile data and data for processing quiz results are retrieved after authentication. For activities data, I used task scheduler for collecting them as described below.
Task scheduler is a process that runs in the background. It provides the ability to schedule the launch of programs or scripts at pre-defined times or after specified time intervals. In this study, I used task scheduler to run PHP script automatically for collecting activities data from Twitter and Facebook. The PHP scripts do these following actions:
1. Query new users and reserve the record: this action queries user table to find the records that has not retrieved that data and then reserves those records to prevent the duplication. There are five users as maximum per task.
2. Get activities data: in this action, the access token obtained in authentication process is used for access Twitter/Facebook data. The activities data are retrieved through APIs. For Twitter, the retrieved data are tweet, retweet, reply and favorite/like. For Facebook, the retrieved data are post, comment and like. The data are retrieved until reach the expected date or the limitation of APIs for accessing data.
3. Store obtained data to database: the obtained data from Twitter and Facebook are stored to database. The database design is described in next section.
CHAPTER 3. DATA COLLECTION APPLICATION 33
Figure 3.8 Process of collecting activities data from SNSs
3.4 Database Design
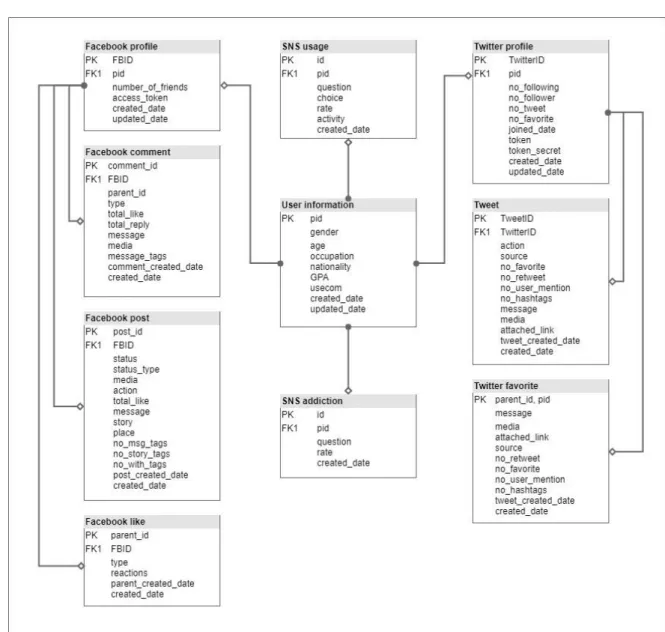
I used a relational database to store data from questionnaire, Twitter and Facebook. The database design is presented in Figure 3.9. There are ten tables as follow:
User Information Table: store user’s information from questionnaire: gender, age, occupation, nationality, GPA and familiarity of using computer and Internet including unique identifiers for each user.
SNS Usage Table: store questionnaire’s answers in second parts about SNS usage SNS Addiction Table: store questionnaire’s answers in third parts about addictive
behavior.
Facebook Profile Table: store Facebook’s user profile that are Facebook ID, number of friends and access token (temporary).
CHAPTER 3. DATA COLLECTION APPLICATION 34
Figure 3.9 Database design
Facebook Comment Table: store Facebook’s comment information such as comment ID, parent post ID, message, type of comment (comment or reply) and created date.
Facebook Like Table: store Facebook’s like information that user did like action such as parent ID and type (post, comment or reply).
Twitter Profile Table: store Twitter user profile that are Twitter ID, number of following, number of follower and number of favorite and access token (temporary) Tweet Table: store information of tweet/reply/retweet that are tweet ID, action
CHAPTER 3. DATA COLLECTION APPLICATION 35
Twitter Favorite Table: store Twitter’s favorite information such as parent ID, message and created data.
3.5 Discussion
Collecting data is an important step for analyzing SNS user behavior. A single data collection method is inadequate to capture all of the aspects of SNS user behavior. I implemented the data collection application for aggregating data from questionnaire, Twitter and Facebook. Even though these methods have benefits for collecting data, they also have limitations as follows:
Inaccuracy of self-reported information. Self-report data might inaccurately represent user behavior compared to actual behavior. Questionnaire participants might overlook or downplay their SNS experiences and inaccurately report information. However, self-report data might be useful where data cannot be collected from other sources.
Restriction of SNS APIs. Some data available on SNSs cannot be collected through APIs. SNS APIs are insufficient to capture all SNS activities, especially reading activities.
The following are the limitations of the Twitter REST API: We cannot get the action times of favorites/likes.
Twitter does not allow request operations with data period conditions. Twitter limits the number of request operations to 15 requests per window. Return data are limited to 200 records per request and up to 3,200 records. The following are the limitations of the Facebook Graph API:
Activity data are available only on the user feeds on the profile page since API versions after 2.0 do not support Facebook Query Language (FQL).
We cannot get the action time of likes.
CHAPTER 3. DATA COLLECTION APPLICATION 36
Furthermore, SNSs continue to update the versions of their APIs. The development requires the migration of new update, or otherwise some commands will work incorrectly or maybe not at all.
Even the employed methods have limitations, they are all useful to capture users behaviors that cannot be collected by other methods.
3.6 Summary
Collecting data is an important first step for analyzing SNS usage. Many types of data and collection methods exist. In this chapter, I presented the design and development of a data collection application. This application collects data from self-report questionnaires and SNSs via APIs. I designed the questionnaire for gathering SNS user experiences and employed IAT and BFAS for measuring SNS addiction. I also experimentally validated the content and usability of the questionnaire design. The results showed that the questionnaire has validity and usability as an instrument for gathering data. Then, I implemented the data collection application, which consists of web-questionnaire, Twitter quiz and Facebook quiz including the part of retrieving data from Twitter and Facebook by their APIs.
In the next chapter, I experimentally collect data using the data collection application. The obtained data will be analyzed to clarify the relationship between SNS usage and SNS addiction.
Chapter 4
SNS Usage and Its Relationship with
SNS Addiction
CHAPTER 4. SNS USAGE AND ITS RELATIONSHIP WITH SNS ADDICTION 38
4.1 Data
Preparation
4.1.1 Data obtaining by application
4.1.1.1 Method
I constructed an experiment on December 2016 using a data collection application (Chapter 3) as a tool for collecting questionnaire, Facebook and Twitter data [91]. The data collection application was originally implemented in English. In this experiment, I translated it into Thai. I used Thai version of IAT [60] and BFAS (Thai-BFAS) [42] and modified them for SNSs.
The following are the experimental procedures:
1. Instructor introduces an overview of the research and the data collection application.
2. Instructor distributes the instruction documents to participants and explains the experiment’s procedure.
3. Participants access the application via web browser and follow the procedures in the document.
a. Participants complete Twitter quiz and/or Facebook quiz, based on which the account they use.
b. Participants answer the questionnaires
Before starting quizzes and/or questionnaire, the application displayed the term of agreement that contains overview of research and explanation of collecting data. Participants read and accepted the terms of agreement before they did the quizzes and answered the questionnaires.
4.1.1.2 Participants