Doctor Thesis
Shibaura Institute of Technology
Operation Strategy and Evaluation of Battery Storage and
Power Converter towards Zero Energy in Commercial Building
A thesis submitted in partial fulfilment for the degree of Doctor of Philosophy
2018/September
i
Acknowledgements
It is a pleasure to thank many people who made this thesis possible.
First, I would like to thank to Prof. Dr. Goro Fujita for his guidance, also his patience and support in overcoming numerous obstacles I have been facing through my research.
Next, I gratefully acknowledge Hybrid Twinning Program of Shibaura Institute of Technology and Japanese Government (MEXT) scholarship for providing fund for my Ph.D study in Japan.
I also would like to express my gratitude to Daidan Co. Ltd., especially for Mr. Yasunobu Tanaka and Mr. Keisuke Tagami, for the research cooperation.
I convey special acknowledgement to my supervisor in Insitut Teknologi Bandung, Dr. Nanang Hariyanto. Thanks to his encouragement, I could attain this level of education.
Nevertheless, I would like to give my special thanks to my lovely mother. Without her unfailing support and continuous encouragement, I would never have the strength to reach this point.
Finally, yet importantly, I would like to thank my professors, my collages, also to everybody who has contributed to all valuable previous researches, which is important to realize this thesis successfully, as well as expressing my apology that I could not mention personally one by one.
Pradita Octoviandiningrum Hadi
ii
Abstract
Climate changes caused by emitted greenhouse gases leads to many environmental issues such as the change of water availability, highly probable of increasing extinct species, declination of food production in some areas, elevate sea level and increase floods possibility, etc. The main cause is carbon dioxide, which is majority emitted in energy utilization. Realizing this problem, many parties start to act towards energy revolution where they try to change the primary source of energy to be the clean or cleaner one. To promote the penetration of clean energy, utilities in many countries also make regulation about feed-in-tariff.
In building scale, the concept of zero energy building (ZEB) is arising there from the effort to reduce the energy consumption. ZEB concept focus on a low-energy building with considerably reduced energy consumption through efficiency gains, and then balanced the energy needs with renewable energy supplies. In order to support the realization of ZEB, we need generation system such as photovoltaic (PV) system, battery as energy storage and power converter as interface of various element in building distribution system. All of elements has lifetime, however battery has the shorter one, which is also influenced by its operation. Power converter helps to convert power in form of ac to dc and vice versa. It also can connect different voltage level of dc power. After all, additional power converter will give additional loss that has to bear with. Therefore, introduction of the operation strategy of battery and power converter is necessary. The different element to be used may also lead to different reliability system. In addition, we need to evaluate its performance economically. Expectedly, this research can give direction for building operator who want to achieve zero energy.
There are many challenges in order to realize ZEB. Many dispersed power generations that may need to be connected together with the utility grid. Increasing number of components also will give the control more complex tasks. The main challenges to realize ZEB that will be investigated in this study are including energy storage, power converter, and economic operation of system.
Abstract
iii
iv
Contents
Acknowledgements ... i
Abstract ... ii
Contents ... iv
List of Tables ... vii
List of Figures ... viii
List of Abbreviations ... x
Chapter 1 Introduction ... 1
1.1 Research Background ... 1
1.1.1 Environmental Issues ... 1
1.1.2 Energy Revolution ... 3
1.1.3 Feed-in-tariff (FIT) System ... 4
1.2 Zero Energy Building Concept ... 7
1.2.1 Definitions ... 7
1.2.2 Design Influence by ZEB Definition ... 8
1.2.3 ZEB Examples ... 9
1.3 Zero Energy Building Challenges ... 9
1.3.1 Energy Storage ... 9
1.3.2 AC System versus DC System ... 10
1.3.3 Economic Operation ... 11
1.4 Study Motivation ... 12
1.5 Thesis Structure ... 13
1.5.1 Chapter 1: Introduction ... 13
1.5.2 Chapter 2: Battery Charge Control by State of Health (SOH) Estimation ... 13
1.5.3 Chapter 3: Reliability of DC-Grids System in Commercial Building ... 13
1.5.4 Chapter 4: Study on Converter Loss and Optimizing Power Schedule ... 13
1.5.5 Chapter 5: Economic Evaluation Using Peak-Time Pricing Ratio ... 13
1.5.6 Chapter 6: Conclusion ... 13
Chapter 2 Battery Charge Control by State of Health (SOH) Estimation ... 14
Contents
v
2.2 Battery Energy Storage Technology ... 14
2.2.1 Lead-Acid Battery ... 15
2.2.2 NiMH Battery ... 15
2.2.3 Li-Ion Battery ... 15
2.2.4 NaS Battery ... 15
2.2.5 Redox Flow Battery (RFB) ... 16
2.3 Battery Lifetime Indicator... 16
2.3.1 Energy-throughput-based Model ... 16
2.3.2 Capacity Losses Model ... 16
2.3.3 Increasing Series Resistance Model ... 17
2.4 Battery Control Method ... 17
2.4.1 Detailed Model ... 18
2.4.2 Average Model ... 19
2.5 Numerical Simulations and Results ... 20
2.5.1 Detailed Model ... 20
2.5.2 Average Model ... 23
2.6 Chapter Conclusion ... 27
Chapter 3 Reliability of DC-Grids System in Commercial Building ... 28
3.1 Chapter Introduction ... 28
3.2 DC-Grids System for Building ... 28
3.2.1 Building Grid Models ... 29
3.2.2 Commercial Building Type ... 30
3.3 Reliability Analysis ... 31
3.3.1 System availability ... 31
3.3.2 Loss of Load Indices ... 32
3.4 Chapter Conclusion ... 33
Chapter 4 Study on Converter Loss and Optimizing Power Schedule ... 34
4.1 Chapter Introduction ... 34
4.2 Evaluation on Converter Loss ... 34
4.2.1 Evaluation Method ... 34
4.2.2 Evaluated System... 35
4.2.3 Converter Evaluation Result... 35
4.3 Optimizing Power Schedule in DC system of Building Power Distribution ... 40
4.3.1 System Architecture ... 40
4.3.2 Optimized Power Schedule Formulation ... 41
4.3.3 Numerical Results and Analysis ... 41
4.4 Optimizing Power Schedule Based on Converter Loss ... 45
4.4.1 System Architecture ... 45
vi
4.4.3 Numerical Results and Analysis ... 46
4.5 Chapter Conclusions ... 47
Chapter 5 Economic Evaluation Using Peak-Time Pricing Ratio ... 48
5.1 Chapter Introduction ... 48
5.2 Electricity Pricing System... 49
5.2.1 Flat Pricing System ... 49
5.2.2 Block-Tariff Pricing System ... 49
5.2.3 Time-based Pricing System ... 49
5.3 Electricity Price Parameter ... 49
5.3.1 Price Parameter Definition ... 49
5.3.2 Electricity Price Parameter: Case of Japan ... 51
5.4 Cost Reduction ... 53
5.4.1 Cost Reduction Concept ... 53
5.4.2 Case Analysis ... 54
5.5 Economic Evaluation in General Model ... 57
5.5.1 System Model ... 57
5.5.2 Computational Experiments ... 58
5.6 Economic Evaluation in Extended Model ... 61
5.6.1 System Model ... 61
5.6.2 Cost Analysis and Results ... 64
5.7 Chapter Conclusions ... 66
Chapter 6 Conclusion ... 68
6.1 Alignment with Research Issues ... 68
6.2 Further Research Development ... 69
References ... 70
vii
List of Tables
Table 1.1 The world’s top ten of greenhouse gas emitters based on WRI data (2013) ... 2
Table 1.2 Proposed emission reduction target in COP21 for various countries ... 2
Table 1.3 Feed-in-tariff for PV System in Japan ... 5
Table 1.4 List of key RE-related policies of Indonesia [8] ... 5
Table 1.5 Feed-in-tariff for PV System in Indonesia based on MEMR Regulation No.19/2016 ... 6
Table 1.6 ZEB renewable energy supply option hierarchy [10] ... 8
Table 1.7 ZEB Example Summary [10] ... 9
Table 2.1 Characteristics of representative batteries[39] ... 15
Table 2.2 Ageing batteries coefficient for several battery technologies ... 17
Table 2.3 Battery Parameter ... 20
Table 2.4 System parameter ... 20
Table 2.5 Value of Delta SOH Reference ... 22
Table 2.6 Relative Error for Delta SOH... 23
Table 2.7 Relative Error for Battery Power ... 23
Table 2.8 Comparison of measured ∆SOH ... 26
Table 2.9 Comparison of relative error for ∆SOH ... 26
Table 3.1 Appliances and its energy savings from avoided ac-dc power conversion losses ... 29
Table 3.2 The PV module and inverter characteristics[10] ... 30
Table 3.3 Main electric equipment in commercial buildings ... 31
Table 3.4 COPT of PV system running on AC (with inverter) ... 32
Table 3.5 COPT of PV system running on DC (without inverter) ... 32
Table 3.6 Comparison of LOLE value in hours/day ... 33
Table 4.1 Converter efficiency based on datasheet ... 35
Table 4.2 Efficiency analysis summary of PV converter ... 37
Table 4.3 Efficiency analysis summary of battery converter ... 39
Table 4.4 Efficiency analysis summary of DC/DC converter ... 40
Table 4.5 Season classification for electricity price ... 42
Table 4.6 Time classification for electricity price ... 42
Table 4.7 Unit price of electricity ... 43
Table 4.8 Power and loss equations ... 46
Table 5.1 List of considered power utility companies in Japan... 51
Table 5.2 Comparison of benefit calculated by value and real calculation ... 61
Table 5.3 List of converters ... 63
Table 5.4 Efficiency Converters ... 63
viii
List of Figures
Figure 1.1 World total greenhouse gas emissions in ton of CO2 equivalent [1] ... 1
Figure 1.2 Global emission by gas type in 2014 based on CAIT data ... 3
Figure 1.3 Global emission by sector in 2014 based on CAIT data ... 3
Figure 1.4 Implementation of measures to support renewable energy in major countries [7] ... 5
Figure 1.5 LCOE 2014 Prices and Audited 2016 BPP Numbers at Rp13,307/USD [9] ... 6
Figure 1.6 Net Zero Energy Building (ZEB) categorization based on its supply-demand chart [11] ... 7
Figure 1.7 Concerned aspects to schedule charge-discharge battery ... 10
Figure 2.1 Illustration for SOH calculation using capacity losses model ... 17
Figure 2.2 Bidirectional chopper (a) circuit and (b) control block for the battery ... 18
Figure 2.3 Control block with SOH calculation block ... 19
Figure 2.4 Detailed of additional block ... 19
Figure 2.5 Node position for SIM and path of circuit ... 19
Figure 2.6 Proposed SIM model ... 20
Figure 2.7 Simulation circuit for detailed model ... 21
Figure 2.8 Charge control block for detailed model ... 21
Figure 2.9 Actual battery power and SOH calculation block ... 21
Figure 2.10 Simulation result for discharging condition... 22
Figure 2.11 Simulation result for charging condition ... 22
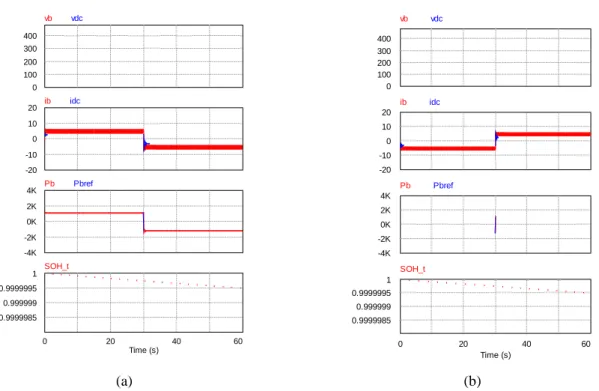
Figure 2.12 Simulation result for (a) discharging to charging condition, (b) charging to discharging condition ... 23
Figure 2.13 Simulation circuit for average model ... 24
Figure 2.14 SIM sub-circuit ... 24
Figure 2.15 Switch control block circuit for average model ... 24
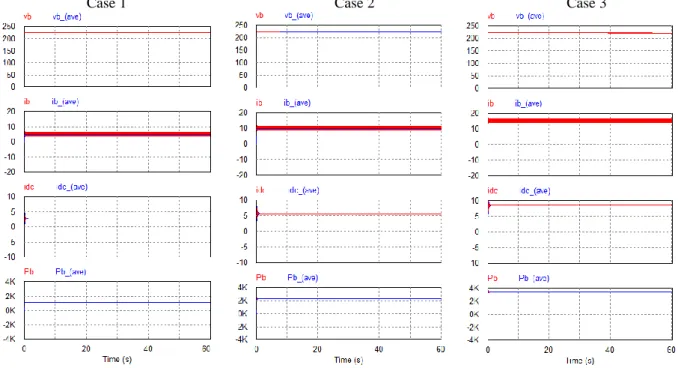
Figure 2.16 Comparison of simulation result for discharging condition ... 25
Figure 2.17 Comparison of simulation result for charging condition ... 25
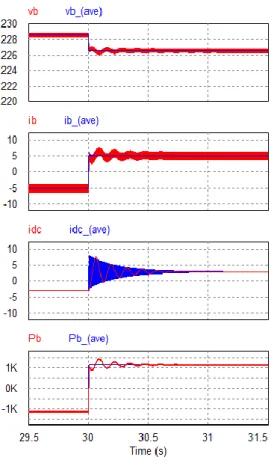
Figure 2.18 Magnifying of simulation result for discharging to charging condition ... 26
Figure 2.19 Magnifying of simulation result for charging to discharging condition ... 26
Figure 3.1 The net zero energy building concept ... 29
Figure 3.2 General topology in building distribution system using, (a) ac grids and (b) dc grids ... 29
Figure 3.3 Load curve for each commercial building type, summer and winter, ac-interface and dc-interface load ... 30
Figure 4.1 DC distribution grid of evaluated system ... 35
Figure 4.2 Data division of PV converter data ... 36
Figure 4.3 Power curve of PV converter ... 36
Figure 4.4 Power output (HVDC side) vs power input (solar side) curve of PV converter using data 1 .. 37
Figure 4.5 Power output (HVDC side) vs power input (solar side) curve of PV converter using data 2 .. 37
Figure 4.6 Power output (HVDC side) vs power input (solar side) curve of PV converter using data 3 .. 37
Figure 4.7 Power output (HVDC side) vs power input (solar side) curve of PV converter using data 4 .. 37
Figure 4.8 Power curve of battery converter ... 38
List of Figures
ix
Figure 4.10 Power output (HVDC side) vs power input (battery side) curve of discharging battery for data
2 ... 38
Figure 4.11 Power output (battery side) vs power input (HVDC side) curve of charging battery for data 1 ... 39
Figure 4.12 Power output (battery side) vs power input (HVDC side) curve of charging battery for data 2 ... 39
Figure 4.13 Power curve of DC/DC converter (Module A) ... 39
Figure 4.14 Power curve of DC/DC converter (Module B) ... 39
Figure 4.15 Power output (DC Line side) vs power input (HVDC side) curve of DC/DC converter (Module A) ... 40
Figure 4.16 Power output (DC Line side) vs power input (HVDC side) curve of DC/DC converter (Module B) ... 40
Figure 4.17 System configuration and power flow ... 41
Figure 4.18 Load demand assumption ... 42
Figure 4.19 Season categorization for PV generation ... 42
Figure 4.20 Sample of calculation using spreadsheet ... 43
Figure 4.21 Monthly cost comparison result ... 44
Figure 4.22 Annual cost comparison result ... 45
Figure 4.23 System configuration and power flow including converter loss ... 45
Figure 4.24 Power schedule with simple ruled-base algorithm ... 47
Figure 4.25 Power schedule by minimize converter loss ... 47
Figure 5.1 Price illustration for one-step peak pricing ... 50
Figure 5.2 Price illustration for two-steps peak pricing ... 51
Figure 5.3 Electricity charge of power utility companies in Japan for summer season ... 52
Figure 5.4 Electricity charge of power utility companies in Japan for non-summer season ... 52
Figure 5.5 Price parameter of utilities in Japan for summer season ... 52
Figure 5.6 Price parameter of utilities in Japan for non-summer season ... 53
Figure 5.7 Comparison of load profile and electricity price ... 53
Figure 5.8 Illustration of cost reduction concept ... 54
Figure 5.9 Illustration of undesired increase of maximum power ... 54
Figure 5.10 Flowchart of battery charge-discharge amount for method 1 ... 55
Figure 5.11 Flowchart of battery charge-discharge amount for method 2 ... 55
Figure 5.12 Electricity price assumption ... 56
Figure 5.13 Power assumptions for (a) demand and (b) PV generation ... 56
Figure 5.14 Comparison of method 1 and method 2 ... 56
Figure 5.15 Battery size analysis results ... 57
Figure 5.16 Electricity price in general and peak-time pricing plan ... 58
Figure 5.17 General model of power grid system for building ... 58
Figure 5.18 Daily load and PV generation curve... 59
Figure 5.19 Algorithm for charging-discharging battery in scenario 1 ... 60
Figure 5.20 Relation of benefit and alpha values with various size of batteries ... 61
Figure 5.21 Additional benefit per kWh of battery for each system ... 61
Figure 5.22 Building power grid extended model in (a) ac system and (b) dc system ... 62
Figure 5.23 Universal model of building power grid system ... 62
Figure 5.24 Flowchart for deciding battery response and power purchased from grid ... 63
Figure 5.25 Energy price for weekday in peak-time pricing plan ... 64
Figure 5.26 Load and PV generation curve ... 64
Figure 5.27 Comparison annual total cost by battery size ... 65
Figure 5.28 Total annual cost vs portion of DC load in battery size comparison ... 65
Figure 5.29 Comparison annual total cost by efficiency converter ... 66
Figure 5.30 Comparison annual total cost by value of alpha and battery size ... 66
x
List of Abbreviations
AC Alternating Current ANN Artificial Neural Network BAU Business-as-usual
BPP Biaya Penyediaan Pokok
CAIT Climate Access Indicators Tool CCS Carbon Dioxide Capture and
Storage
CfD Contract for Different
CHUDEN Chubu Electric Power Company CHP Combined Heat and Power CO2 Carbon Dioxide
COP Conference of Parties
COPT Capacity Outage Probability Table DC Direct Current
DOD Depth-of-Discharge
EDGAR Emission Database for Global Atmospheric Research EHP Electric Heat Pump EPCO Electric Power Company
FCCC Framework Convention on Climate Change
FIP Feed-in-Premium FIT Feed-in-tariff FOR Forced Outage Rate
FY Fiscal Year
GA Genetic Algorithm GE Genetic Electric
GHGs Green House Gases
HEPCO Hokkaido Electric Power Company HVAC Heating, Ventilating, and Air
Conditioning
HVDC High Voltage Direct Current INDC Intended Nationally Determined
Contributions
IPCC Intergovernmental Panel on Climate Change
JRC Joint Research Centre
KEPCO Kansai Electric Power Company KYUDEN Kyushu Electric Power Company LCOE Levelized Cost of Electricity LOLE Loss of Load Expectation MEMR Minister of Energy and Mineral
Resources
MEP Multistep Electricity Price MTTF Mean Time to Failure MTTR Mean Time to Repair NDC Nationally Determined
Contributions
NRE New and Renewable Energy NREL National Renewable Energy
Laboratory
OKIDEN Okinawa Electric Power Company PCS Power Conditioner System
PLN Perusahaan Listrik Negara
List of Abbreviations
xi
RE Renewable Energy
RO Renewable Obligation
RPS Renewable Portfolio Standard RUL Remaining Useful Life RVMs Relevance Vector Machines SIM Switch Inductor Model SOC State-of-Charge SOH State of Health
SOL State of Life
TEPCO Tokyo Electric Power Company
TOU Time-of-Use
WRI World Resources Institute
1
Chapter 1
Introduction
1.1 Research Background
1.1.1 Environmental Issues
The climate change increases the global surface temperature. Various impacts may occur such as the change of water availability, highly probable for a number of species will become extinct, declination of food production in some areas, elevate sea level and increase floods possibility, also give rise to number of diseases and increase levels of premature death. The main cause of climate change is the greenhouse effect, which caused by the greenhouse gases (GHGs) include carbon dioxide (CO2).
Based on data from Emission Database for Global Atmospheric Research (EDGAR), which is provided by European Commission, Joint Research Centre (JRC)/Netherlands Environmental Assessment Agency (PBL) [1], world total greenhouse gas emissions is increasing almost twice in the last four decades (Figure 1.1). The latest global data available (2013) from World Resources Institute (WRI) shows that the world’s top three gas emitters—China, the United States and the European Union—contribute more than half of total global emission. Altogether of the top ten emitters (Table 1.1), which include Japan and Indonesia, contribute for nearly three-quarters of global emissions [2]. These listed countries need to do a significant action in order to successfully undertake the climate change challenges.
Figure 1.1 World total greenhouse gas emissions in ton of CO2 equivalent [1]
The international concern about climate change start more than three decades ago. In 1983, US Academy of Sciences published a report on climate change. In the same year, World Commission on Environment and Development was established within the United Nations. This committee published a report called “Our Common Future” in 1987. The following conferences show how the worldwide concern to prevent dangerous climate change by trying to reduce their emission. The “Changing Atmosphere” conference which held in Toronto, Canada, in June 1988 determined the worldwide CO2 emission should be reduced
Chapter 1 Introduction
2
(IPCC) published reports on the status of climate-change-related sciences. Second publication is in 1995, third one is in 2001, fourth in 2007, and the fifth is in 2013 and 2014.
United Nations’ Conference on Environment and Development which held in Brazil, 1992, published the United Nation Framework Convention on Climate Change (UNFCCC) with main objective to prevent climate change to the dangerous state. In Kyoto Protocol (Japan, 1997), developed countries agreed to reduce their emission of GHGs by an average of 5.2% by 2008-2012 compared with the 1990 levels. In December 2015, Conference of Parties 21 (COP21) declared Paris Agreement, which is trying to hold the increase of global average temperature to below 2oC. All Parties are invited to initiate domestic
preparations by submitting their own intended nationally determined contributions (INDC) to the committee in COP21. These INDCs will be considered as nationally determined contributions (NDC) after the Paris Agreement is concluded. In case of Japan, the INDC is the level of GHG emission reduction of 26.0% by fiscal year (FY) 2030 compared to FY 2013, or approximately 1042 Mt-CO2e as 2030 emission.
In order to achieve this target, the ratio of renewable energy within the total electric power generated is expected to be around 22-24%. Considering this condition, solar energy is prospected to increase by seven times. The INDCs of other countries are listed inTable 1.2.
Table 1.1 The world’s top ten of greenhouse gas emitters based on WRI data (2013)
Country GHGs [Mt CO2e] China 11,735.0 United States 6,279.8 European Union 28 4,224.5 India 2,909.1 Russia 2,199.1 Japan 1,353.3 Brazil 1,017.9 Indonesia 744.3 Canada 738.4 Mexico 733.0 Others 11,802.8
Table 1.2 Proposed emission reduction target in COP21 for various countries Country Proposed emission reduction target from 2020
Japan 2030: -26% (compared to 2013)
United States 2025: -26% to -28% (compared to 2005)
EU 2030: -40% (compared to 1990) Russia 2030: -25% to 30% (compared to 1990) Canada 2030: -30% (compared to 2005) Australia 2030: -26% to -28% (compared to 2005) Switzerland 2030: -50% (compared to 1990) Norway 2030: -40% (compared to 1990)
China 2030: -60% to -65% per GDP unit (compared to 2005) India 2030: -33% to -35% per GDP unit (compared to 2005) Mexico 2030: -22%, conditionally -36% (compared to BAU) South Africa 2025: -398 Mt; 2030: -614 Mt (compared to BAU) Brazil 2025: -37%; 2030: -43% (compared to 2005)
There are several ways to reduce CO2 emissions, such as increase share of non-carbon in primary supply,
change the composition of fossil fuel to less carbon one, employ CO2 capture and storage (CCS) system,
and reduce the energy demand. Up to now, electricity generation is relying most on carbon energy source such as coal, oil, and natural gas.
3
solar power. Third is developing nuclear fusion. However, in Japan, Fukushima accident give major effect to stop the use of nuclear fusion for generating electricity. Fourth is reduce deforestation and promote reforestation. Fifth is stabilize emissions of non-CO2 GHGs.
Data on the Climate Access Indicators Tool (CAIT) [3] indicates the major emitted GHGs is CO2 (Figure
1.2). Energy sector, as the largest contributor, emit approximately three-quarters of global emitted GHGs (Figure 1.3), which is including the electricity generation. By focusing in energy sector, substantial impact of emission reduction can be achieved.
Figure 1.2 Global emission by gas type in 2014 based on CAIT data
Figure 1.3 Global emission by sector in 2014 based on CAIT data
Based on IPCC report [4], in 2010, electricity and heat production give 25% of total anthropogenic GHG emissions with half is come from building sector. The share of indirect CO2 emission of buildings almost
same with industry. In total, buildings give 18.4% share, which 6.4% from direct emissions and 12% from indirect emissions. According to this fact, concerning to reduce CO2 emission of buildings also can give
significant impact in total.
1.1.2 Energy Revolution
Nowadays we are facing the revolution of energy from a fossil energy era to a new energy era. In the earliest era, there is a global primary energy transformation from wood to coal in period of 1800s. The secondary energy transformation, which is from coal to hydrocarbon sources, was happened on 1990s to 1950s period. The last transformation is the tertiary energy transformation from hydrocarbon to new energy sources. In this transformation era, the world annual oil production peak is predicted will be occurred around 2040. Besides, natural gas will reach the peak of annual production around 2060 [5].
Chapter 1 Introduction
4
Japan made an energy revolution by shifting mainstream energy supply from domestic coal to imported oil. However, the dependency to imported oil brought Japan to its first oil crisis in 1973. Diversifying energy supply source is used to address these issues. Six years later, in 1979, second oil crisis occurred, then oil quota is applied for importer countries such as Japan. In 1980s, importing of steam coal expanded to full scale which is principally used for power generation. In 1990s, Japan started to put “3E” which includes energy security, economy, and environment in their energy policy. Japan declared a Basic Act on Energy Policy in 2002 for securing energy supply with environmental suitability and utilization of market mechanism. There are three plans that were published respectively in October 2003, March 2007, and June 2010. After Fukushima nuclear power plant accident happened in 2011, Japan added “S” for safety value to their energy policy than become “3E + S”. In 2012, Japan started to applied feed in tariff policy. In 2014, Strategic Energy Plan is published as fourth plan for Basic Act on Energy Policy.
In case of Indonesia, since 2004, Indonesia becomes a net oil importer, because the demand is higher than the national production. The national energy mix in 2015 is still dominated by hydrocarbon sources, which is approximately 95% of total energy. However, the new and renewable energy (NRE) is targeted to be increased to 23% in 2025 and 31% in 2050. As stated in [6], efforts to decrease GHGs emission is following these four factors. First factor is energy diversification by increasing percentage of NRE in national energy mix. Second factor is utilization of clean coal technology for electric power generation. Third one is energy transformation from oil to natural gas. The last factor is energy conservation program. Reflecting to these four factors, the GHGs emission is targeted to be decreased by 58% in 2050 compared to business-as-usual (BAU) scenario [6].
1.1.3 Feed-in-tariff (FIT) System
Feed-in-tariff (FIT) system is a supporting measure to encourage renewable power generation. Beside FIT, there is another program called Renewables Portfolio Standard (RPS), which mandates electric power resellers to have a fixed percentage of power sold from their targeted renewable energy sources. Figure 1.4 describes how the major countries implement the measures to support renewable energy. Here, another measures type is started to be introduced, such as Renewables Obligation (RO), Feed-in-Premium (FIP), and Contract for Difference (CfD). In FIP, there is a view to have renewable energy support scheme and the electric power market work together, and a bidding system in which market competition determines the level of governmental assistance. FIP, which is increasingly implemented in Europe, provides the certainty of investment, and better economic rationality. In CfD, the portion where the market price falls below the strike price will be supplemented. The uniqueness of this system is that the power generation companies reimburse the excess in cases where the market price exceeds the strike price [7].
Table 1.3 shows detail FIT for PV system in Japan from fiscal year 2012-2019. The type is divided into residential and non-residential PV system. Residential PV system contains less than 10 kW PV system. Recently, it is categorized in more detail by seeing the whether the system use power conditioner system (PCS) or not, also whether using double power generation or not. The determined tariff for each category decreases year by year. It may lead to unprofitable system when trying to sell the energy from PV generation to grid. In addition, the tariff for non-residential PV system is more unpredictable, especially if in the future, it uses kind of energy tender.
Indonesia start to concern about renewable energy on 2006. Up to now, there are several RE-related policies that is issued in Indonesia, which is summarized in Table 1.4. Indonesia has targeted that 23% of their energy mix will come from New and Renewable Energy (NRE) by 2025. Start on 2012, energy from small and medium scale renewable energy generation and excess power can be purchased by utility company in Indonesia called “Perusahaan Listrik Negara” (PLN). In the following years, the more detail policies about purchasing of electricity are issued.
5
generator by State Electricity Company (PT. PLN). Based on this regulation, new FIT is set with range from 14.5 – 25.0 US cent/kWh and with capacity quota depending on the region (Table 1.5).
Figure 1.4 Implementation of measures to support renewable energy in major countries [7]
Table 1.3 Feed-in-tariff for PV System in Japan Type/Scale With PCS Double power gen. system FY 2012 FY 2013 FY 2014 FY 2015 FY 2016 FY 2017 FY 2018 FY 2019 Residential PV Systems, <10kW No No
42 yen 38 yen 37 yen
33 yen 31 yen 28 yen 26 yen 24 yen
Yes No 35 yen 33 yen 30 yen 28 yen 26 yen
No Yes 25 yen 25 yen 25 yen 24 yen
Yes Yes 27 yen 27 yen 27 yen 26 yen
non-residential PV systems, 10kW-2MW
40 yen 36 yen 32 yen 29 yen
27 yen* 24 yen 21 yen
unannounced non-residential PV systems,
>2MW via solar tender
*after profit consideration
Table 1.4 List of key RE-related policies of Indonesia [8]
Year Policy Issued
2006 National Energy Policy (NEP)
2008 Determination of Work Area for Geothermal Mining
2009 Law on Electricity
2010 Tax and Custom Facility for Renewable Energy Resource Utilization 2012 Investment General Plan
Amendment on Guideline for Geothermal Implementation
Amendment on List of Power Generation Development Project Acceleration using Renewable Energy, Coal, and Gas and Related Transmission
Electricity Purchase from Small and Medium Scale Renewable Energy and Excess Power 2013 Purchasing of Electricity by PLN from Solar PV
Purchasing of Electricity by PLN from Municipal Solid Waste (MSW) 2014 National Energy Policy (NEP)
Electricity Purchasing by PLN from Biomass Power Plant and Biogas Power Plant
Law on Geothermal
Amendment on the Purchasing of Electricity by PLN from Hydro
Purchasing of Electricity by PLN from Geothermal
2015 Regulation on Hydro
Regulation on MSW
Chapter 1 Introduction
6
Table 1.5 Feed-in-tariff for PV System in Indonesia based on MEMR Regulation No.19/2016
No. Area Capacity Quota
(MWp) Feed in Tariff (US cent/kWh) 1 DKI Jakarta Total: 150.0 14.5 2 West Java 14.5 3 Banten 14.5
4 Central Java and Yogyakarta 14.5
5 East Java 14.5
6 Bali 5.0 16.0
7 Lampung 5.0 15.0
8 South Sumatera, Jambi, and Bengkulu 10.0 15.0
9 Aceh 5.0 17.0
10 North Sumatera 25.0 16.0
11 West Sumatera 5.0 15.5
12 Riau and Riau Archipelago 4.0 17.0
13 Bangka-Belitung 5.0 17.0
14 West Kalimantan 5.0 17.0
15 South Kalimantan and Central Kalimantan 4.0 16.0
16 East Kalimantan and North Kalimantan 3.0 16.5
17 North Sulawesi, Central Sulawesi, and Gorontalo 5.0 17.0
18 South Sulawesi, South-East Sulawesi, and West Sulawesi 5.0 16.0
19 West Nusa Tenggara 5.0 18.0
20 East Nusa Tenggara 3.5 23.0
21 Maluku and North Maluku 3.0 23.0
22 Papua and West Papua 2.5 25.0
After 6 months, on January 2017, MEMR published the new regulation No.12/2017 about utilization of renewable energy resources for electricity supply. This regulation determines a new FIT scheme, which is depending on regional supply cost of electricity (biaya penyediaan pokok/BPP) compare to national supply cost of electricity. The objective of this regulation is to suppress the national BPP. If regional BPP is higher than national BPP, then the tariff is defined as 85% of regional BPP in maximum. If regional BPP is lower than or equal to national BPP, then the tariff is defined as 100% of regional BPP. Figure 1.5 shows regional and national BPP, also levelized cost of electricity (LCOE) of several type of power generation. Based on this data, only two regions will have FIT for PV higher than its LCOE. However, the regulation will limit up to 85% of regional BPP, which is still lower than LCOE of solar PV.
7
When the regulation is easy to be changed, the certainty of future tariff is low. Besides, the determined tariff itself is also low. In this condition, investment for system that intend to sell the electricity to grid is unsecured.
1.2 Zero Energy Building Concept
Zero energy building (ZEB) is recognized as the key of energy and electricity saving concept in Japan strategic documents such as the Energy Conservation Technology Strategy (2011) and the Basic Energy Plan (2014). Japan’s target declared in the Basic Energy Plan for ZEB is specified into two stages. The first stage is enforcing ZEB for newly constructed public building, etc., by 2020. The second one is enforcing ZEB for an average of newly constructed buildings by 2030.
1.2.1 Definitions
The concept of ZEB is a low-energy building with considerably reduced energy consumption through efficiency gains, and then balanced the energy needs with renewable energy supplies. As shown in Figure 1.6, we can categorize the building into three general categories. First category is net minus energy building. In this category, demand total of building is less than local energy generation. However, the building should reduce its demand at least 65% of reference building. By putting effort to reduce demand and increase the local supply, we can shift the building to be ZEB oriented, ZEB ready, nearly ZEB level I, and nearly ZEB level II. To be recognized as ZEB oriented, the building should reduce the demand to 50% compare to reference building. Second category is net zero energy building, when the amount of demand and supply is equal. The last category is net plus energy building, which has larger amount of local generation compare to the demand.
How we claim the success of achieving a net zero energy building is depending on how we define the zero energy building itself. Every definition will lead to different goal. However, there is no single suitable definition for zero energy building. Based on US National Renewable Energy Laboratory (NREL) report in [10], there are four well-definitions of net zero energy building. The difference of each definition lies in the perception of the zero value that to be achieved. Following sections will explain the detail of each definition.
Figure 1.6 Net Zero Energy Building (ZEB) categorization based on its supply-demand chart [11]
1.2.1.1 Net Zero Site Energy
Chapter 1 Introduction
8
1.2.1.2 Net Zero Source Energy
A net zero source energy building see the energy start from its source and count the transmission loss. So that, in this definition, the net zero energy will be achieved by producing energy at least as much energy that used in the site when accounted for at the source.
1.2.1.3 Net Zero Energy Costs
The net zero energy costs definition is based on the value of energy in currency. The net zero energy will be achieved when income amount from selling electricity to utility is at least equal to the purchased amount that paid to utility over the year. In this definition, the amount of electricity sold and electricity purchased can be different.
1.2.1.4 Net Zero Energy Emissions
The last definition is based on the emitted emission. A net zero emission building produces emission-free energy from renewable source at least as much as energy used from emission-produced sources.
1.2.2 Design Influence by ZEB Definition
Each definition of ZEB will influence the design, which has its own advantages and disadvantages. Table 1.6 shows the preferred application of renewable energy supply based on [10]. The influence of each definition of ZEB will be described in following section.
1.2.2.1 Net Zero Site Energy
Within this definition, a site ZEB produces energy as much as it uses. Using rooftop PV (Table 1.6, Option 1) or other on-site sources but not on the building (Table 1.6, Option 2) may be available as an option to achieve a site ZEB. For determining the progress to a ZEB goal, we can do verification easily through on-site measurements. It has the fewest external fluctuation that influence the ZEB goal, and therefore provides the most repeatable and consistent definition. There is no consideration for the values of various fuels at the source here. There is also possibility that it does not realize the energy cost saving. This is the limitation of this definition.
1.2.2.2 Net Zero Source Energy
In this definition, we use appropriate site-to-source energy factors, as a multiplication for calculating total source energy of the building both imported and exported energy. The difference of each energy factor increases the dependence of source of energy. Different area with different energy mix will influence the design of building. Same as a site ZEB, a source ZEB also may not realize comparable energy cost savings.
1.2.2.3 Net Zero Energy Costs
A cost ZEB totally depends to the electricity purchased charge and sold rate. A time-of-use charge would be advantageous for a cost ZEB. If demand charges account for a significant portion of the utility bills, a net cost ZEB becomes difficult. In case two-way or net metering is not available, on-site energy storage and demand-responsive control should be included in the design.
Table 1.6 ZEB renewable energy supply option hierarchy [10] Option
Number ZEB Supply-Side Options Examples
0 Reduce site energy use through low-energy
building technologies
Daylighting, high-efficiency HVAC equipment, natural ventilation, evaporative cooling, etc.
On-Site Supply Options
1 Use renewable energy sources available within the building’s footprint PV, solar hot water, and wind located on the building.
2 Use renewable energy sources available at the
site
PV, solar hot water, low-impact hydro, and wind located on-site, but not on the building.
Off-Site Supply Options
3 Use renewable energy sources available off
site to generate energy on site
Biomass, wood pellets, ethanol, or biodiesel that can be imported from off site, or waste streams from on-site processes that can be used on-site to generate electricity and heat.
4 Purchase off-site renewable energy sources Utility-based wind, PV, emissions credits, or other “green”
9
1.2.2.4 Net Zero Energy Emissions
An emission-based ZEB produces emissions-free energy as much as it uses from emissions-producing energy sources. Therefore, the success of achieving an emission-based ZEB depends on the energy mix from the generation source. When it is already zero emission that means it needs no effort to achieve the mission of emission-based ZEB. However, the net zero emissions ZEB definition has similar calculation difficulties as the source ZEB definition.
1.2.3 ZEB Examples
This following section will shows some examples of ZEB that have been studied in [10]. They are:
“Oberlin”—The Adam Joseph Lewis Center for Environmental Studies, Oberlin College.
“Zion”—The Visitor Center at Zion National Park, Springdale, Utah.
“Cambria”—The Cambria Department of Environmental Protection Office Building, Ebensburg, Pennsylvania.
“CBF”—The Philip Merrill Environmental Center, Chesapeake Bay Foundation, Annapolis, Maryland.
“TTF”—The Thermal Test Facility, National Renewable Energy Laboratory, Golden, Colorado.
“BigHorn”—The BigHorn Home Improvement Center, Silverthorne, Colorado.
“Science House” Science Museum of Minnesota, St. Paul, Minnesota.
Table 1.7 shows the buildings with the additional PV system array area and capacity requirements to meet the ZEB goals. Some of buildings need different size of additional PV for being source or site ZEB. It shows that the ZEB definition also will influence the design requirement.
Table 1.7 ZEB Example Summary [10]
Building and PV System (DC Rating Size) Site Energy Use (w/o PV) (MWh/yr) Source Energy Use (w/o PV) (MWh/yr) Actual Roof Area (footprint) (ft2)
Flat Roof Area (ft2) Needed for Source ZEB and Site ZEB with PV
PV System DC Size Needed for Source ZEB and
Site ZEB Oberlin-60 kW 118.8 380.2 8,500 10,800 120 kW Zion-7.2 kW 91.6 293.1 11,726 6,100 73 kW Cambria-17.2 kW 372.1 1,190.7 17,250 37,210 415 kW CBF-4.2 kW 365.2 1,142.0 15,500 25,316 Source ZEB 25,640 Site ZEB 282 kW Source ZEB 286 kW Site ZEB
TTF-No PV 83.5 192.5 10,000 4,010 Source ZEB
5,550 Site ZEB
45 kW Source ZEB 62 kW Site ZEB
BigHorn-8.9 kW 490.4 901.0 38,923 18,449 Source ZEB
31,742 Site ZEB
206 KW Source ZEB 354 kW Site ZEB
Science House-8.7 kW 5.9 18.8 1,370 1,000 6 kW
1.3 Zero Energy Building Challenges
There are many challenges in order to realize ZEB. Many dispersed power generations that may need to be connected together with the utility grid. Increasing number of components also will give the control more complex tasks. The main challenges to realize ZEB that will be investigated in this study are including energy storage, power converter, and economic operation of system.
1.3.1 Energy Storage
Chapter 1 Introduction
10
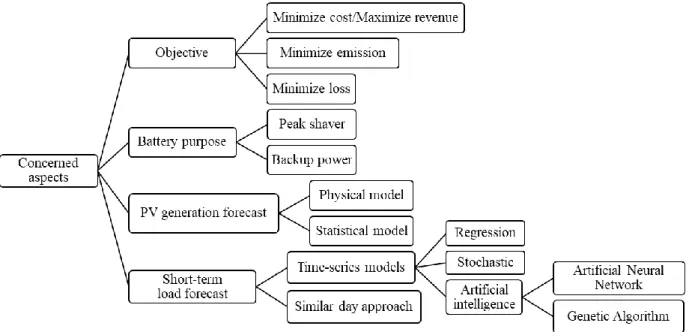
The common used energy storage is battery. In general PV system, the concerned aspect for scheduling charge-discharge power of battery (Figure 1.7) is including the objective of the scheduling itself, the battery purpose, prediction of PV generation and load. The objective of battery charge-discharge scheduling can be for minimizing cost, emission, or energy loss in system. The battery purpose is to be peak shaver or only for backup. In case for backup purpose, the scheduling becomes unnecessary. Other parameter to be concerned is the forecast of PV generation and load demand. PV generation forecast can be done by physical model or statistical model, which may include parameter such as sky clearness index (for example, clear, partially cloudy, and cloudy), ambient temperature, and wind speed. Load can be forecasted in short-term by using time-series model such as regression, stochastic, or artificial intelligence (for example Artificial Neural Network (ANN), Genetic Algorithm, (GA)). Another load forecast approach is by using similar day approach. Sample parameter that can be used for load forecast is type of day, precipitation (rain or sunny), and discomfort index, which is mainly affected by weather factor like temperature and humidity. Realizing ZEB may require high capacity of battery storage, which lead to high investment cost. Think of the limitation of battery’s charge-discharge cycle, high repetition of charge-discharge operation will make the battery lifetime become shorter. It means the sooner it needs to be replaced which leads to additional investment cost.
Figure 1.7 Concerned aspects to schedule charge-discharge battery
1.3.2 AC System versus DC System
“War of the Currents” was starting in the late 1880s. Thomas Edison developed direct current (DC), current that runs continually in a single direction, had a problem in that time. It cannot be converted to another level voltage, so transmission losses will be high for transferring power in long distance. While alternating current (AC) which is developed by Nikola Tesla can be easily converted to different voltage using transformer. By using higher voltage, the losses in transmission can be reduced. Besides that, Westinghouse by using Tesla's patent of AC system won bid for illuminating The Chicago World's Fair, the first all-electric fair in the world in 1893. Westinghouse won against General Electric (GE) that using Edison’s DC system by offering a more efficient and cost-effective of AC system. For the attendees, it showed that AC power would be the future system for electricity. This was the start of electricity predominantly by AC power.
11
energy from currently system, which is an AC system. The using of converter will add some losses in the system, so more energy is needed.
We are also facing the limitation of carbon fueled energy resources. This condition leads people to exploit renewable energy in their own building, such as solar power by using photovoltaic (PV), which generate DC power. Therefore, both source and load with dc interface might be increasing. Within the context of simplicity and efficiency, it is unreasonable to use “DC-AC-DC” route from dc source to dc load [12]. It leads the dc building distribution system to be proposed.
Increasing of DC load and source leads research to evaluate the using of DC distribution system possibilities. Pang, et al. [12] evaluate possibilities of using DC electrical distribution systems in building with increasing renewable (RE) sources and DC loads by comparing efficiency of AC and DC distribution system. The calculation show replacement of current 3-phase 4-wire AC system with generic DC distribution system can save 16% of electricity. The using of DC distribution system also improves PV performance because use DC-DC converter instead of grid-connected inverter, which has better efficiency. The other benefits also have been mentioned qualitatively, such as potential material saving, power quality, reliability, and system simplicity with RE.
By using mathematical model, Starke, et al. [13] have compared loss of AC and DC distribution system in the higher voltage level, not in building level system. It showed that to get fewer losses in the pure AC load environment, DC distribution system with higher voltage level and very high DC-DC converter efficiency is required. It also showed that AC and DC distribution system could have the same merit when the loads are equal in ratio.
By realizing the current system that is using AC system, Asad & Kazemi [14] have derived quantitatively the effect of transition from AC to DC system in case of efficiency, cost, loss, and reliability. There is enormous task need to be done before this system widely used [15], including safety and investment cost. Still, there is no standard yet for constructing DC distribution system in buildings scale.
1.3.3 Economic Operation
An efficient and optimum economic operation and planning of electric power generation system has an important position in the electric power industry. The classic problem is the economic dispatch of fossil-fired generation system to achieve minimum cost. The increasing concern of environmental matters leads to the necessity of “economic dispatch” that also includes such target like minimizing pollutant and conserving various forms of fuel [16]. In the first instance, the power generation is centralized, and then the energy is transferred by using transmission and distribution system to reach the customer. Following this condition, only one side who operates the power generation and transmission can control the economic dispatch.
Currently, dispersed generator began to commonly used, which is distributed in wide area with low to medium scale of power capacity. The main purpose of dispersed generator system is to maximize the utilization of energy sources and to reduce the stress of transmission load. Some area might have small available capacity of energy source to be exploited. By using dispersed generator system concept, this small capacity still can be utilized. The low amount of generated power means it cannot be transferred to the far place. This condition would lead to the operation system that trying to supply the demand using the nearest power generation. So that, the load of transmission line can be suppressed.
Chapter 1 Introduction
12
Various control strategy for economic operation of microgrids, whether AC, DC, or hybrid AC-DC, is being developed recently, such as decentralized control [17], hierarchical optimization and control [18], [19], predictive control [20], [21], also intelligent control such as using fuzzy logic [22], and genetic algorithm [23], [24]. The main purpose of the control strategy is to achieve optimal operation strategy, which has minimum cost and balanced condition of whole system. The complexity of the control strategy depends on number of controlled variable and objective.
In the era of Internet-of-Thing (IoT), we started to learn that energy also would has the similar future called Internet-of-Energy (IoE). The framework for information exchange [25] in microgrid operation will be necessary. The security of energy internet also need to be considered, which includes security of cyber-attack and energy availability [26], [27]. Connecting many consumer and producer with complex transmission system will create a big data to be handled. In term of data analytic, the security issues that need to be concerned include impersonation, eavesdropping, data manipulation, access and authorization, and system availability [28].
In framework of ZEB, where the power generation is included in building, economic operation in building scale will be necessary. Based on the ZEB definitions that have been explained in section 1.2.1, the most affected design is a cost ZEB, which the main target is to achieve the net-zero of cost. However, in order to get the optimum design, other type of ZEB also need economic operation strategy.
There are several options of local generation that can be used in ZEB. At any rate, PV system is still a common option. In addition, we usually use the battery as the complement of PV system to overcome the uncertainty of its power generation. Price of PV and battery system installation has potential to decrease year by year, following its development stage. However, to achieve the status of zero energy, PV and battery sizing design still require high investment cost due to the necessary capacity. In order to balance the high investment cost, the operation cost need to be reduced by incessantly of optimal economic operation. In this case, we also can consider the economic operation of power distribution in building as main challenges for realizing ZEB.
The economic operation in power system had a bearing on electricity price. The variably price based on time or total consumption will lead to different behavior of optimal operation. An advanced calculation for optimal operation may need such additional expenses. For small building with low demand, it can be too expensive to bear. Therefore, kind of simple calculation using such as spreadsheet that usually they already have will be a good way to cope with this problem.
1.4 Study Motivation
13
1.5 Thesis Structure
We organized this research into six chapters. Following are the short outline of each chapter.
1.5.1 Chapter 1: Introduction
This chapter includes background and motivation of this research. Here, we also describe the concept and main challenges of ZEB.
1.5.2 Chapter 2: Battery Charge Control by State of Health (SOH) Estimation
This chapter describes the control of battery charge-discharge operation considering the battery lifetime. The purpose is for making the battery lifetime longer by using carefully operation strategy. Other than using detail model simulation, we also use the proposed average model to make the simulation time shorter.
1.5.3 Chapter 3: Reliability of DC-Grids System in Commercial Building
Here, we discussed about the comparison of reliability system between ac-grid and dc-grid system in commercial building. The loss of load expectation (LOLE) is used to measure the reliability of system.
1.5.4 Chapter 4: Study on Converter Loss and Optimizing Power Schedule
Realizing ZEB means the need of connection between several types generation, storage, and load will increase. Based on the actual data from real system, we studied the converter loss and explained here. This chapter also discuss the potential of power schedule optimization considering converter loss as the countermeasure.
1.5.5 Chapter 5: Economic Evaluation Using Peak-Time Pricing Ratio
Section 5.2 introduces peak-time of electricity pricing parameters. Based on peak-time pricing, section 5.4 describes the cost reduction concept. Using the proposed peak-time pricing ratio, we done the economic evaluation. Section 5.5 shows the economic evaluation result of general model. Section 5.6 points out the economic evaluation result that considered the converter loss using extended model.
1.5.6 Chapter 6: Conclusion
14
Chapter 2
Battery Charge Control by State of Health (SOH)
Estimation
2.1 Chapter Introduction
Electricity demand increases day by day. Concerning about carbon emission and global warming pumps up the need of sustainable sources such as photovoltaic (PV). It also may change the people lifestyle [29]. Recently, smart systems such as smart house and smart building are becoming more and more popular. It is necessary to use storage system such as battery for managing peak demand and improving reliability of the system [30]. It makes the used of battery increase.
Battery has shorter lifetime compare to other parts in system [31]. When reached its end-of-life (EOL), the battery need to be replaced. Generally, the limit is set to 80% of nominal capacity [32]. If there are many changes of battery along the whole system lifetime, it can increase total investment cost. Degradation of battery depends on its operation which can be influenced by the operational management [33]. Several studies proposed method to extend battery lifetime, such as optimization based on life loss cost [34] and replacement cost [35].
State of Health (SOH) is commonly used for estimating battery lifetime. There are several indications that can be used to evaluate SOH, such as series resistance [36], capability of storing energy [37], and restriction of cycle number. This study proposes additional block control, which is using decreasing of SOH as reference. Aim of this block is to control the battery power and manage battery lifetime, all at one. Further, it can be used for more advanced optimization charge control, such as to extend battery lifetime or optimize investment and operational cost.
2.2 Battery Energy Storage Technology
15
Table 2.1 Characteristics of representative batteries[39]
Type Lead-Acid NiMH Li-Ion NaS VRB
Energy density (Wh/kg) 25-50 60-120 75-200 150-240 10-30
Power density (W/kg) 75-300 250-1,000 500-2,000 150-300 80-150
Cycle life (100% DOD) 200-1,000 180-2,000 1,000-10,000 2,500-4,000 >12,000
Round-trip efficiency (%) 75-85 ~65 85-97 75-90 75-90
Self-discharge Low High Medium - Negligible
2.2.1 Lead-Acid Battery
The lead-acid battery development is started in 1970s [40], and being the oldest rechargeable battery. In this type of battery, the positive and negative electrodes are separately made up of lead dioxide and metallic lead, which are immersed in a diluted sulphuric-acid electrolyte. The main advantages of using lead-acid batteries are high efficiency of energy, low self-discharge rate, and low up-front cost. However, the further development of lead-acid battery faces some technical drawbacks, including low depth of discharge (<20%), low cycle life, low energy density, and slow charging rate. Lead-acid batteries are still primarily employed in cases where cost effectiveness, reliability, and abuse tolerance are critical, but energy density and lifetime are not as important [39]. Safety considerations in large application of lead-acid batteries is necessary. It is reported that there is a significant number of injuries occur during the maintenance and repair of lead-acid batteries. These injures include burns from electrical arcing and acid exposure, as well as strained muscles and crushed hand [41].
2.2.2 NiMH Battery
NiMH battery consists of a nickel-oxyhydroxide-based positive electrode, a metallic cadmium-based negative electrode, and an alkaline electrolyte (usually potassium hydroxide). This type of battery has higher power/energy density, realizes better environmental friendliness, and is less prone to undergo memory effect, compared to nickel cadmium (NiCd) battery). Nonetheless, it has several technical drawbacks, such as high self-discharge rate, limited service life, and low Coulombic efficiency (about 65%). In addition, it has a very low ability to tolerate fast charging and overcharge. Especially during fast charging, massive amounts of heat may be generated, and hydrogen buildup may cause cell rupture, leading to considerable capacity decay [39].
2.2.3 Li-Ion Battery
The Li-ion battery is and advanced rechargeable battery first commercially developed in the early 1990s. This battery is formed by lithiated metal oxide in cathode and graphitic carbon in anode with a layer structure. When charging, Li-ions are inserted into and deinserted from the negative electrode and positive electrode, respectively. The process is reversed during discharge process. Compared to other types of batteries, Li-ion batteries have advantages of high energy density, high efficiency, long cycle life, and environmental friendliness. Battery-cycle life is a key factor for grid application and affects the economic viability of energy storage [39].
2.2.4 NaS Battery
NaS battery is composed of a molten Sulphur anode, a molten sodium cathode, and separated by solid beta alumina ceramic electrolyte. The electrolyte allows only the positive sodium ions to go through it and combine with the sulfur to form sodium polysulfides. To allow the charge and discharge cycles, batteries have to be operated in temperatures over 300oC, such that Sulphur and sodium exist in a molten state.
Chapter 2 Battery Charge Control by State of Health (SOH) Estimation
16
2.2.5 Redox Flow Battery (RFB)
Flow battery type consists of two electrolyte reservoirs. Between these reservoirs, the electrolytes are circulated through an electrochemical cell comprising a cathode, an anode, and a membrane separator. The chemical energy is converted to electricity in the electrochemical cell, when the two electrolytes flow through. Both electrolytes are stored separately in large storage tanks outside the electrochemical cell. An RFB is a type of energy storage device consisting of separate power and energy modules. It makes the power and energy capacity completely independent each other. As the advantage, it is easy to scale up to multi-megawatts and megawatt-hours by modular design. This battery type also has an exceptionally long lifespan, with excellent safety, reliability, and large-scale applicability. Moreover, RFBs exhibit good transient, with very fast response speed. Therefore, it is well-suited for balancing highly variable renewables [39].
2.3 Battery Lifetime Indicator
Comparing to other parts in the system, battery has the shorter lifetime. The price also quite expensive for buying the new one. Obviously, the concern about battery lifetime in power management system is needed. There are several indicators for battery lifetime, such as State of Health (SOH), State of Life (SOL), and Remaining Useful Life (RUL). State of health is indicated by capacity degradation, internal resistance increase, or a combination of the two. State of life is the time when the battery must be replaced. It is similar to SOH, but quantifies the remaining time until the battery will be unable to perform. Remaining useful life is the length of time from present time to the end of useful life. This means the lower RUL indicates the shorter time to reach the end of life.
The speed of battery capacity degradation can be influence by several factors, such as deep depth-of-discharge (DOD), high or low temperature, high c-rates, extreme state-of-charge (SOC) levels, etc. By controlling the battery operation, the slower degradation speed is expected.
In this study, SOH is selected to represent the battery life. SOH can be calculated use several models, such as energy-throughput-based model, capacity losses model, and increasing series resistance model. By considering the long cycle-life and high round-trip efficiency, li-ion battery is chosen to be investigated here.
2.3.1 Energy-throughput-based Model
Energy-throughput-based model assumes that under constant operating conditions, a battery can withstand a certain amount of energy throughput, which is equivalent to a number of charge/discharge cycles, before it reaches its end-of-life. Total number of cycles before end-of-life (𝑁) usually is stated in the datasheet. In this model, total energy-throughput is defined as multiplication of number of cycles before end-of-life and initial energy capacity of the battery, 𝑄 for charging cycle, and the same value for discharging cycle. If the total energy that flows is equal to the total energy-throughput, then the battery will reach its end-of-life. So that, amount of battery power at time t (𝑃(𝑡)) is a main factor for the degradation speed.
If 𝑆𝑂𝐻(𝑡) indicates SOH battery at time t, based on this model it will be calculated by (2.1). New battery, as the battery capacity equals its nominal initial value, 𝑆𝑂𝐻(𝑡) is equal to one. Whenever 𝑆𝑂𝐻(𝑡) reaches zero, it means the end-of-life of the battery is reached.
𝑆𝑂𝐻(𝑡) = 𝑆𝑂𝐻(𝑡 − ∆𝑡) − 1
2∙𝑁∙𝑄∙ ∫ |𝑃(𝜏)|𝑑𝜏
𝑡
𝑡−∆𝑡 (2.1)
2.3.2 Capacity Losses Model
17
losses will be calculated as illustrated in Figure 2.1. The ageing batteries coefficient (𝑍) of several battery type is shown in Table 2.2.
By observing the state of charge battery (𝑆𝑂𝐶(𝑡)) in percentage, capacity loss at time t (∆𝐶𝑏𝑎𝑡(𝑡)) is
defined as (2.2). Corresponding SOH at time t (𝑆𝑂𝐻(𝑡)) is calculated by (2.3).
∆𝐶𝑏𝑎𝑡(𝑡) = 𝐶𝑏𝑎𝑡(0) × 𝑍 × [𝑆𝑂𝐶(𝑡 − ∆𝑡) − 𝑆𝑂𝐶(𝑡)] (2.2)
𝑆𝑂𝐻(𝑡) =𝐶𝑏𝑎𝑡(𝑡)−∆𝐶𝑏𝑎𝑡(𝑡)
𝐶𝑏𝑎𝑡(0) (2.3)
Figure 2.1 Illustration for SOH calculation using capacity losses model
Table 2.2 Ageing batteries coefficient for several battery technologies
Technologies Z
Pb flat plate 3 x 10⁻⁴
Pb tubular 0.5 x 10⁻⁴
Ni-Cd 0.6 x 10⁻⁴
Li-ion 0.17 x 10⁻⁴
2.3.3 Increasing Series Resistance Model
Series resistance of battery will increase as the usage time. Based on this characteristic, the last model is using the increase of battery series resistance (𝑅0) to indicate SOH. Typically, battery series resistance at
end-of-life (𝑅0𝐸𝑂𝐹) is 1.6 times higher than battery series resistance of new batteries (𝑅
0𝑁𝑒𝑤). In this model,
SOH is calculated by comparing the value of battery series resistance at time t (𝑅0(𝑡)) with the new
batteries as mentioned in (2.4). However, measuring battery internal resistance online is still quite difficult. 𝑆𝑂𝐻(𝑡) =𝑅0𝐸𝑂𝐹−𝑅0(𝑡)
𝑅0𝐸𝑂𝐹−𝑅0𝑁𝑒𝑤 (2.4)
2.4 Battery Control Method
Bidirectional chopper circuit control the amount of battery power, as shown in Figure 2.2 (a). By adjusting duty cycle of switch 𝑇1 and 𝑇2, amount of charge or discharge power can be controlled. Common power
control block, as shown in Figure 2.2 (b), use battery power reference (𝑃𝐵∗) value command as a reference
Chapter 2 Battery Charge Control by State of Health (SOH) Estimation
18
(a) (b)
Figure 2.2 Bidirectional chopper (a) circuit and (b) control block for the battery
2.4.1 Detailed Model
This section will explain the proposed control method in detailed model.
New battery is indicated by SOH value equal to 1, and battery reached the end of life is indicated by SOH value equal to 0. Based on the simplicity and possibility of implementing, energy-throughput based of SOH estimation is chosen here. We define (2.5) to calculate SOH at 𝑡 + ∆𝑡.
𝑆𝑂𝐻(𝑡 + ∆𝑡) = 𝑆𝑂𝐻(𝑡) − 1 2∙𝑁∙𝑄𝑛𝑒𝑤∙ ∫ |𝑃𝐵(𝜏)| 3600 𝑑𝜏 𝑡+∆𝑡 𝑡 (2.5)
Where, 𝑡 indicates time in second, 𝑆𝑂𝐻(0) indicates battery state of health initial value, 𝑁 is a total number of cycles before end-of-life, 𝑄𝑛𝑒𝑤 is initial energy capacity of the new battery in kWh, and 𝑃𝐵(𝑡)
is charge or discharge power of battery at time t in kW. In order to distinguish charge and discharge condition, positive value is defined as discharge power and negative value is defined as charge power. Generally, value of 𝑁 is not constant. It depends on battery operating condition [43]. However, in order to keep the simplicity of this study, value of 𝑁 is assumed to be constant.
Equation (2.6) shows that the value of SOH always decrease time by time. For simplicity in calculation, decreasing value of SOH, ∆𝑆𝑂𝐻(𝑡 + ∆𝑡), is defined by (2.7).
𝑆𝑂𝐻(𝑡 + ∆𝑡) − 𝑆𝑂𝐻(𝑡) = − 1 2∙𝑁∙𝑄𝑛𝑒𝑤∙ ∫ |𝑃𝐵(𝜏)| 3600 𝑑𝜏 𝑡+∆𝑡 𝑡 (2.6) ∆𝑆𝑂𝐻(𝑡 + ∆𝑡) = 1 2∙𝑁∙𝑄𝑛𝑒𝑤∙ ∫ |𝑃𝐵(𝜏)| 3600 𝑑𝜏 𝑡+∆𝑡 𝑡 (2.7)
By time discretization, equation (2.8) can be derived from (2.7) for calculating 𝑃𝐵 along period of ∆𝑡. Here,
reference of battery power can be driven by desired decreasing value of SOH. However, other command is necessary to decide the battery flow, whether to charge or discharge. This command is defined by 𝑃𝐵,𝑓𝑙𝑜𝑤
as shown in (2.9), where positive value for discharging and negative value for charging.
In order to control the battery charging and discharging process by using decreasing value of SOH as reference, an additional calculation block is proposed as shown in Figure 2.3. The function of this block is to calculate the value of 𝑃𝐵∗. The calculation block is defined by referring to (2.8) and (2.9). Figure 2.4
shows the detail calculation of the additional block. This block will calculate battery power reference value based on desired value of ∆𝑆𝑂𝐻, ∆𝑡, and 𝑃𝐵,𝑓𝑙𝑜𝑤. The value of 𝑃𝐵∗ is determined by how much SOH is
allowed to decrease along period of ∆𝑡. While 𝑃𝐵,𝑓𝑙𝑜𝑤 gives command for the direction of power flow,
which is to charge or discharge.
For evaluating the proposed control block, measured voltage and current of the battery is used for calculating instantaneous value of 𝑃𝐵. Then this value is used for calculating the estimation of decreasing
SOH by modifying (2.8).
|𝑃𝐵(𝑡)| =
2∙𝑁∙𝑄𝑛𝑒𝑤∙3600∙∆𝑆𝑂𝐻(𝑡+∆𝑡)
19
𝑃𝐵,𝑓𝑙𝑜𝑤 = {
+1, 𝑓𝑜𝑟 𝑑𝑖𝑠𝑐ℎ𝑎𝑟𝑔𝑖𝑛𝑔
−1, 𝑓𝑜𝑟 𝑐ℎ𝑎𝑟𝑔𝑖𝑛𝑔 (2.9)
Figure 2.3 Control block with SOH calculation block
Figure 2.4 Detailed of additional block
2.4.2 Average Model
Switch mode DC-DC converter relies on a switched inductor as a temporary energy storage between input and output terminal. Switch Inductor Model (SIM) as average model for boost converter is proposed in [44]. Based on it, the average model for bidirectional chopper is developed in this study. In this model, the converter is substitute by 3-ports block, which represent the node at side of switched inductor (node a) and each end of switch (node b and c) as shown in Figure 2.5. The path of circuit when switch T1 on is shown
by blue line and for switch T2 on is shown by red line.
By using continuous current mode, this bidirectional DC-DC converter is represented in its average value based on (2.10) to (2.14). D1,on and D2,on are duty cycle of switch T1 and T2 to be on, respectively. Figure
2.6 shows the average model of SIM.
𝐷1,𝑜𝑛 = 1 − 𝐷2,𝑜𝑛 (2.10)
𝐸𝐿= 𝑉𝑎𝑏∙ 𝐷1,𝑜𝑛 + 𝑉𝑎𝑐∙ 𝐷2,𝑜𝑛 (2.11)
𝐼𝑎= 𝐼𝐿 (2.12)
𝐼𝑏 = 𝐼𝐿∙ 𝐷1,𝑜𝑛 (2.13)
𝐼𝑐 = 𝐼𝐿∙ (1 − 𝐷1,𝑜𝑛 ) = 𝐼𝐿∙ 𝐷2,𝑜𝑛 (2.14)
![Figure 1.1 World total greenhouse gas emissions in ton of CO 2 equivalent [1]](https://thumb-ap.123doks.com/thumbv2/123deta/9765975.1849979/14.892.204.681.715.966/figure-world-total-greenhouse-gas-emissions-ton-equivalent.webp)

![Figure 1.4 Implementation of measures to support renewable energy in major countries [7]](https://thumb-ap.123doks.com/thumbv2/123deta/9765975.1849979/18.892.102.796.169.395/figure-implementation-measures-support-renewable-energy-major-countries.webp)
![Figure 1.5 LCOE 2014 Prices and Audited 2016 BPP Numbers at Rp13,307/USD [9]](https://thumb-ap.123doks.com/thumbv2/123deta/9765975.1849979/19.892.205.690.768.1134/figure-lcoe-prices-audited-bpp-numbers-rp-usd.webp)
![Figure 1.6 Net Zero Energy Building (ZEB) categorization based on its supply-demand chart [11]](https://thumb-ap.123doks.com/thumbv2/123deta/9765975.1849979/20.892.220.678.705.979/figure-zero-energy-building-categorization-based-supply-demand.webp)