Shibaura Institute of Technology
Biological Information Based QoE
Management In Adaptive Streaming
Services
A DISSERTATION SUBMITTED TO THE
GRADUATE SCHOOL OF ENGINEERING AND SCIENCE OF THE SHIBAURA INSTITUTE OF TECHNOLOGY
by
PHAN XUAN TAN
IN PARTIAL FULFILLMENT OF THE REQUIREMENTS FOR THE DEGREE OF
DOCTOR OF ENGINEERING
Abstract
The introduction of adaptive streaming technologies, especially HTTP adaptive streaming (HAS) has significantly improved the video quality perceived by end-user, making video service becomes one of the most dominant services on the Internet. Due to the limitation of network re-source supply (e.g., available bandwidth), for profit improvement, ser-vice providers have to take into account Quality of Experience (QoE) management by which QoE stands for perceived video quality will be frequently monitored and maintained with optimal network resource utilization. However, with the growth in the availability of multime-dia services, coupled with the technological advances in compression and streaming, it is witnessing a great demand for video contents with high quality. Meanwhile, the number of subscribers is also continu-ously increasing. These situations put more pressure on the existing network infrastructures, requiring an upgrade. However, when the service providers attempt to upgrade their systems, it might reach to the physical limits. Thus, there is a growing need of more efficient QoE management system in adaptive streaming services.
In this dissertation, a biological information based QoE management framework has been proposed. Thereby, a balance between network resource utilization and the resulting QoE is guaranteed. The achieved results are outlined in the following:
chunk-by-chunk basic that relies on the timestamp of two suc-cessive video requests. In addition, video rate is usually selected based on a throughput estimation over a long time period. Thus, the deteriorations will be perceived by the end-user before control action is generated. Meanwhile, QoS can be monitored with flex-ible self-defined interval that does not depend on chunk-by-chunk basic, becoming a suitable monitoring factor for early detection purpose. This study aims at determining such the appropriate self-defined interval of QoS monitoring. In adaptive streaming, playback buffer is a situational indicator for video rate adap-tion. The results of an experiment demonstrated that the first deterioration of playback buffer always provides an accurate pre-diction of video rate deterioration. Therefore, monitoring QoS with suitable interval can accurately capture the first deteriora-tion of playback buffer, benefiting early detecdeteriora-tion of video rate or QoE deterioration. The monitoring interval is then proposed to be equal to video chunk size. By using the proposed interval, the balance between computational cost and ratio of video rate deterioration has been achieved.
Acknowledgments
First of all, I would like to express my most heartfelt gratitude and appreciation to my supervisor, Professor Eiji Kamioka, who has been a constant source of inspriration for me, professionally and personally. His continued support led me to the right way. Besides guiding my research, he has allowed me to recognize and address some of my weaknesses, and develop into a more effective researcher. I cannot thank him enough for everything that he taught me over three years. In the future, I do hope that I will become as good an supervisor as he is.
I would also like to extend my appreciation to the committee mem-bers: Professor Hiroaki Morino, Professor Koichi Gyoda, Pro-fessor Kenichi Yamazaki and ProPro-fessor Kyoko Yamori for their advice and comments for my research.
Thanks also to all staff members of Shibaura Institute of Technology. They was always very kind and generous in helping me during my stay in Japan.
I would also like to thank all members of Mobile Multimedia Com-munication Laboratory who made my life at Shibaura Institute of Technology much easier. The enjoyable parties and gPBL activities are unforgettable memories in Japan.
I would like to acknowledge the financial support from Shibaura In-stitute of Technology through out the Hybrid Twinning program and Japanese Government Scholarship (MEXT) for my doctoral course and my daily life in Japan.
Contents
Abstract i
Acknowledgments iv
List of Figures viii
List of Tables xi
1 Introduction 1
1.1 Motivation . . . 3
1.2 QoE Management and Challenges . . . 5
1.3 Biological Information based QoE management . . . 9
1.3.1 Early detection of QoE deterioration with appropriate mon-itoring interval . . . 12
1.3.2 Collaborative approach using psychophysiology and psy-chophysics for determination of QoE threshold . . . 13
1.3.3 User-centric approach to accurate bandwidth allocation . . 14
1.4 Limitations . . . 15
1.5 Contributions and Thesis Organization . . . 15
2 Background 20 2.1 Overview of QoE . . . 20
2.1.1 QoE Definition . . . 20
2.1.2 QoE Influence Factors . . . 21
2.2 QoE assessment models . . . 22
2.2.1 Objective QoE assessment models . . . 22
2.2.2 Subjective QoE assessment models . . . 23
2.2.3 Hybrid QoE assessment models . . . 24
CONTENTS
2.4 Summary . . . 28
3 Early Detection of QoE Deterioration With Appropriate Moni-toring Interval 29 3.1 Introduction . . . 29
3.2 Related Work . . . 32
3.3 Methodology . . . 33
3.3.1 PSQA approach in QoE assessment . . . 34
3.3.2 Determination of appropriate monitoring interval . . . 35
3.4 Evaluation . . . 39
3.5 Summary . . . 45
4 Collaborative Approach using Psychophysiology and Psychophysics for Determination of QoE Threshold 47 4.1 Introduction . . . 47
4.2 Related work . . . 50
4.3 Background . . . 51
4.3.1 Electrodermal Activity . . . 52
4.3.2 Heart Rate . . . 54
4.3.3 Heart Rate Variability . . . 55
4.3.4 Sensation, perception, Weber Law, and Fechner Laws . . . 55
4.4 Methodology . . . 59
4.4.1 Hypotheses . . . 59
4.4.2 Modelling of biological information . . . 59
4.5 Evaluation . . . 62
4.5.1 Experimental environment . . . 62
4.5.2 Data acquisition and data transformation . . . 64
4.5.3 Numerical results . . . 66
4.6 Discussion . . . 73
4.7 Summary . . . 75
5 User-centric Approach to Accurate Bandwidth Allocation 77 5.1 Introduction . . . 77
5.2 Related work . . . 79
5.3 Bandwidth Competition in Adaptive Streaming Services . . . 80
5.4 Methodology . . . 83
CONTENTS
5.4.2 Proposed method . . . 85 5.5 Evaluation . . . 91 5.6 Summary . . . 97
6 Discussion 98
6.1 Early detection of QoE deterioration with appropriate monitoring interval . . . 98 6.2 Collaborative approach using psychophysiology and psychophysics
for determination of QoE threshold . . . 99 6.3 User-centric approach to accurate bandwidth allocation . . . 100
7 Conclusion and Future Work 102
7.1 Conclusion . . . 102 7.2 Future Work . . . 103
Bibliography 105
List of Figures
1.1 Survey on how the US young adults watch television these day [1] 2 1.2 The dominance of video services . . . 2 1.3 Online video services-a billion dollar opportunity . . . 3 1.4 Negative feedback control system . . . 6 1.5 Proposed biological information based QoE management
frame-work for adaptive video streaming services . . . 10 1.6 Deployment of proposed framework within practical environment . 11 1.7 Organization of thesis . . . 16
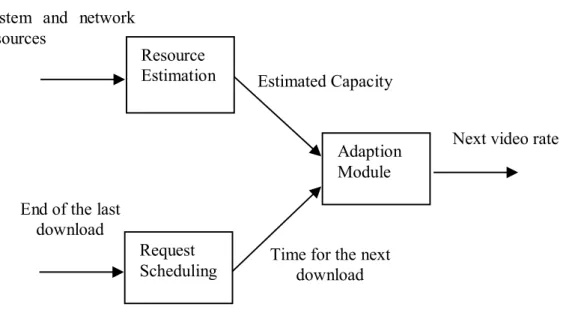
2.1 HTTP Adaptive Streaming framework . . . 26 2.2 ABR framework comprises of three main components: Resource
estimation, request scheduling and adaption module . . . 26 2.3 Buffering state and steady state in a streaming session . . . 27
3.1 Two-phase QoE monitoring layer . . . 30 3.2 Classification of QoE influence factors in adaptive streaming services 31 3.3 Training process of PSQA . . . 35 3.4 Practical usage of PSQA in QoE assessment . . . 35 3.5 Experimental setup for evaluating the optimal monitoring interval
throughout three evaluation metrics . . . 40 3.6 Ratio of QoE deterioration and average CPU load in both scenarios 41 3.7 Video rate requested by the user, available bandwidth and
esti-mated MOS in the first scenario . . . 44 3.8 Video rate requested by the user, available bandwidth and
esti-mated MOS in the second scenario . . . 44
LIST OF FIGURES
4.2 Absolute threshold obtained from psychometric function . . . 55 4.3 The greater change in absolute threshold, just noticeable intensity
when the reference intensity progressively increases. . . 57 4.4 Environmental Setup with Zoom watch and Grove-GSR sensor . . 63 4.5 The SCR-amplitude of significant SCR re-convolved from
corre-sponding phasic driver-peaks . . . 67 4.6 Standard deviation of Heart Rate data obtained from particular
subject . . . 69 4.7 Square root of the mean squared differences of successive R-R
in-tervals obtained from particular subject . . . 70 4.8 The logarithmic nature regression curves of SC data obtained from
10 subjects. log Si means the logarithmic nature curves, whereas
Si is the data point of each subject . . . 72
5.1 The pre-defined range of video rate. The establishment of this range is relied on the MPD . . . 78 5.2 The unfair sharing of bandwidth among clients . . . 81 5.3 The instability of video rate during a streaming session . . . 82 5.4 QoE management algorithm. MOS is always kept stable at a level
which is higher than threshold . . . 84 5.5 The exiting QoE control approach, where the target video rate
is randomly taken from a pre-defined premium range of available video rate . . . 86 5.6 The proposed method for precise bandwidth allocation . . . 88 5.7 A pre-define range of subjective expectation in terms of expected
MOS . . . 89 5.8 The general trend obtained from subjective MOS and requested
video rate . . . 91 5.9 Regression approximation modeling the relation between requested
video rate and subjective MOS. The horizontal axis presents the subjective MOS. The vertical axis shows the requested video rate (in kbps) . . . 92 5.10 Set up network environment for investigating the accuracy of
LIST OF FIGURES
5.11 Requested video rate and estimated MOS of the premium user dur-ing his streamdur-ing session (before and when bandwidth competition occurs) . . . 94 5.12 Requested video rate and estimated MOS of the first normal user
during his streaming session . . . 95 5.13 Requested video rate and estimated MOS of the second normal
List of Tables
1.1 X: means that estimated QoE is less than threshold. O: means that estimated QoE is higher or equal to threshold. Control action 1 is always produced earlier than control action 2 . . . 12
3.1 Sample dataset with two metrics: tdelay−buf f er, and tdelay−bitrate . . 39
4.1 The pros and cons of rating approach, psychophysical approach, and psychophysiological approach . . . 49 4.2 NS-SCR analysis in SC data. The results were the output of
Dis-crete Decomposition Analysis (DDA) done by lelalab tool . . . 68 4.3 The correlation of determination denoted by R-squared obtained
from each subject in both SC data, HR data, and HRV data . . . 71
Chapter 1
Introduction
February of 2018 was the time for the 23rd Winter Olympics Pyeongchang. It was an exhilarating month, with the participants of 92 national teams. Unsurprisingly, the Winter Olympics was one of the most watched worldwide events, and this year was not the exception. Approximately 11.6 million viewers turned into live-streaming coverage on NBCOlympics.com during the first five days of the Games in Pyeongchang in 2018 [3]. Thanks to the recent advances in video streaming and compression techniques, the viewers were able to also watch this event on live-TV streaming services, including Sling TV’s Sling Blue package, Hulu with Live TV, YouTube TV, DirecTV Now, Sony’s PlayStation Vue, FuboTV, and CenturyLink Stream with high definition quality on their devices. Sporting events like Winter Olympics are not the sole type of attractive content to online viewers, though. The day of having to tune in live or buy expensive discs in order to watch the favorite shows and movie has gone. There are numerous streaming services offering an excellent and abundant selection of TV shows, movies, and original programing, including Netflix, Hulu, Amazon Instant video, etc. The rise of such online services has dramatically altered the media habits of Americans, especially young adults [1]. About six-in-ten of those ages 18 to 29 (61%) say the primary way they watch television now is with streaming services on the internet, compared with 31% who say they monthly watch via a cable or satellite subscription and 5% who mainly watch with a digital antenna.
Figure 1.1: Survey on how the US young adults watch television these day [1] 73% 27% 2016 82% 18% 2021 Video Traffic Other Traffics
1.1 Motivation 7.5 8.7 9.8 10.8 11.9 12.8 13.7 3.7 4.1 4.5 4.8 5.0 5.2 5.3 0 3 6 9 12 15 2014 2015 2016 2017 2018 2019 2020 U S d ig ita l vi d e o /m u si c re ve n u e fo re ca st ( b ill io n U .S . D o lla rs)
Streaming (pay-per-view) Streaming (subscription-based) Downloads Streaming (music) Download (music)
Figure 1.3: Online video services-a billion dollar opportunity
network by 2021. Meanwhile, people around the world watch a billion hours of YouTube video content every single day [5]. In a 2017 report [6], IBM stated that there are two-thirds of adults reported subscribing to video on demand (SVOD) service in a survey of more than one thousand US consumers. The dominance of video services accordingly brings a huge profit to service providers. The revenue in billion US Dollar of video services is increasing year after year and is predicted to reach the highest value of 13.7 by 2020 [7]. Such the huge revenue is attracting more and more service providers to participate in this prominent but competitive market.
1.1
Motivation
1.1 Motivation
leads to the frequent upgrades of available resources as well as the evolution of adaptive streaming technologies. Due to physical limits, however, the upgrade of adaptive transmission technologies become more challenge alongside the require-ments of more efficient QoE management system.
1.2 QoE Management and Challenges
doing this way, the HAS player also can control its playback buffer by dynamically adjusting the rate at which new chunks are requested. Consequently, it facilitates the users to watch video with smoother experience without interruption despite the network condition fluctuation. However, during streaming session, each of HAS player strives to optimize their individual quality, which leads to bandwidth competition, causing quality oscillations and buffer starvations. Therefore, the upgrade of adaptive transmission technologies only is not enough.
QoE management has emerged as an alternative solution to converge the requirements of both service providers and the end-user. Typically, with QoE management, perceived video quality in terms of QoE is frequently monitored and maintained at an expected level. QoE is assessed by observing QoE influence factors (e.g., QoS parameters, stalling, rebuffering) and then interpreting them to QoE indicators (e.g., Mean Opinion Score). Meanwhile, QoE control is responsi-ble for maintaining a desiraresponsi-ble QoE level as long as possiresponsi-ble and it can be done by generating appropriate control action at the right time. Thereby, an efficient QoE management for adaptive video streaming services can guarantee high perceived video quality for the end-user at minimal network resource usage. The existing works increasingly attempt to improve the accuracy of QoE assessment, without seriously considering the other aspects of QoE management such as QoE deteri-oration detection, control action and especially QoE threshold, where remained challenges are taking place at.
This thesis aims at proposing a novel biological information based QoE man-agement for adaptive streaming services. Thereby, the balance between network resource utilization and the resulting QoE can be efficiently achieved through solving the remained challenges. The existing technology alongside challenges, the overview of the proposed approach as well as the contributions and the orga-nization of the dissertation will be presented in the remainder of this chapter.
1.2
QoE Management and Challenges
1.2 QoE Management and Challenges System Controller Sensor Measured error
Desired threshold System
input System output
Measured output
+
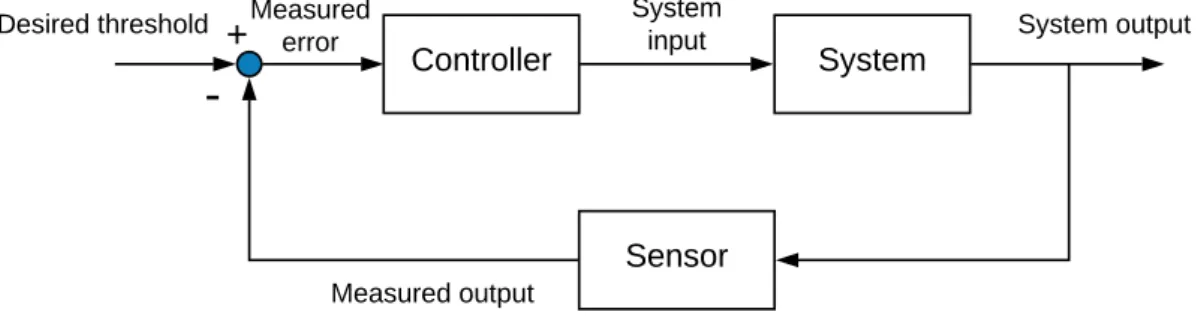
-Figure 1.4: Negative feedback control system
control system in control theory, using a feedback loop to control the process variable by comparing it with a desired threshold and applying the difference as an error signal to generate a control output to reduce or eliminate the error [10]. Such the functionalities actually can be found in monitoring layer and control layer within any general QoE management frameworks. Actually, only very few studies on QoE management exist in the public domain because the majority of studies have been mainly sponsored by the players in the telecommunications industry, who view the results of such studies as proprietary. On the contrary, there are numerous proposed solutions for managing QoE of video services, that focus on the improvements of separate monitoring layer and control layers.
1.2 QoE Management and Challenges
influence factors related to the network environment and conditions, terminal capabilities, users, context and application/service specific information and its quantification. These factors can be frequently obtained via passive or active monitoring methods, and then automatically interpreted to QoE indicators in real-time. As the prerequisite conditions for an implementation of successful QoE monitoring, QoE must be accurately assessed, while QoE deterioration is early detected. Contemporary works often concentrate on the first condition, that is to say, enhancing the accuracy of QoE assessment. Typically, in order to provide accurate QoE assessment, the consideration of only one or two QoE influence fac-tors is generally not sufficient. On the contrary, QoE should be considered in all its dimensions taking into account as many influence factors as possible. In fact, not only network QoS factors (e.g., bandwidth, packet loss, delay and jitter), but also application QoS factors (e.g., initial buffering time, rebuffering frequency, and mean duration of a rebuffering event) [12], biological information [13], and memory-driven factors [14] were separately taken into account in the existing works. However, a joint approach is still a main challenge due to its complexity. As the second condition, early detection of QoE deterioration has not been care-fully investigated yet in literature. This condition can be achieved by considering an appropriate set of observable QoE influence factors and suitable monitoring interval. There are factors becoming observable only after the introduction of the other one, thus, they are not suitable for the purpose of early detection of QoE deterioration. For example, rebuffering event only occurs after the drain on play-back buffer. In addition to deciding monitoring factors, determination of suitable interval for QoE monitoring also need to be taken into consideration. Monitoring interval actually has a direct impact on the balance of network resource utiliza-tion and the resulting QoE. More concretely, if the measurement interval is set small, more computational power is required, but more importantly, a small mea-surement interval yields inaccurate results [15]. Thereby, the optimal monitoring intervals should be large enough to reduce the computational cost and improve the accuracy, but also small enough to early detect QoE deterioration.
1.2 QoE Management and Challenges
other control strategies. Such mechanism yields optimized service delivery by delivering accurate control action at the right time. As the result, the end-users satisfaction will be maximized, while the limited network resources are optimally utilized.
• To generate the control action at the right time, an appropriate QoE thresh-old must be taken into account. To the best of our knowledge, there are no existing works which carefully perform the investigation of threshold in QoE control. The determination of QoE threshold usually depends on the types of QoE indicator used in assessment model. As mentioned above, either objective models or subjective models or hybrid models are possi-bly considered as assessment model in QoE monitoring. Among them, the hybrid QoE models which allow QoE estimation to be performed in an au-tomatic and accurate manner in real-time, have gradually been the most common models in literature. In hybrid modeling process, the perceived video quality is subjectively evaluated by using rating approach in which QoE indicator in terms of 5-scale Mean Opinion Score (MOS) is given out. Therefore, in QoE control, the fair level of above indicators scale (the mid-dle value) is simply selected as the threshold. However, the rating approach has significant drawbacks due to its high bias and variability, causing less accuracy in QoE modeling followed by unreliability of the selected thresh-old.
1.3 Biological Information based QoE management
the server. It leads to the fact that the amount of allocated bandwidth was often higher than the need of the users, resulting network resource under-utilization. Therefore, it is necessary to propose a new method to determine the target video rate.
1.3
Biological Information based QoE
manage-ment
re-1.3 Biological Information based QoE management
Controller
NETWORK Phase 1
Activie & passive monitoring methods
tr o l A c tio n 1 C o n tr o l la ye r Application QoS factors M o n ito re d d a ta fo r p h a s e 2 Phase 2 n 2 Biological Information Memory driven factor
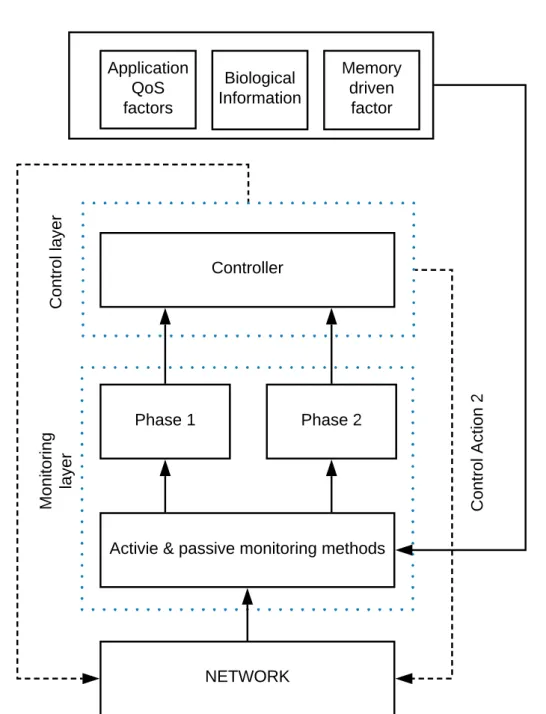
Figure 1.5: Proposed biological information based QoE management framework for adaptive video streaming services
1.3 Biological Information based QoE management
gression model of subjective MOS and video rate, the target video rate can be determined, benefiting accurate bandwidth allocation.
Controller Phase 2 Phase 1 Monitoring layer Control layer Switch client users Biological Information Memory-driven factors Application QoS Control Action 2 Control Action 1 Server Internet Client side Router Access Network Network QoS
Figure 1.6: Deployment of proposed framework within practical environment
Figure 1.6 illustrates how the proposed framework can be deployed in prac-tical environment. Accordingly, it is expectedly deployed within an open-source router that placed in distribution or core network layer at client side. Apart from basic functions of an edge router such as routing, traffic classification, this device is capable of carrying QoE management functionality. Thanks to active and pas-sive monitoring methods, the data of network QoS, application QoS, biological information and memory-driven factors can be fed from access network to the router. There are two assessment/estimation models are respectively deployed within phase 1 and phase 2 of monitoring layer. While network QoS is used as training input data for the phase 1s assessment model, application QoS, biologi-cal information and memory-driven are applied for the one of phase 2. Based on the output of those assessment/estimation models, various decisions can be given out by the controller. The table 3.1 summarizes the possible decisions made by the controller.
1.3 Biological Information based QoE management
Table 1.1: X: means that estimated QoE is less than threshold. O: means that es-timated QoE is higher or equal to threshold. Control action 1 is always produced earlier than control action 2
tP hase1 tP hase2 tDecision
X O Control Action 1
X X Control Action 1 +
Con-trol Action 2
O X Control Action 2
1.3.1
Early detection of QoE deterioration with
appropri-ate monitoring interval
As stated in previous section 1.2, one of the primary requirements for QoE mon-itoring is to early detect QoE deterioration, which can be accomplished by an appropriate monitoring interval. This sub-section reviews our proposed method in determining such the monitoring interval in order to achieve the research goal. The proposed method is two-fold. First, the suitable QoE influence factors are selected as monitoring factors. In this work, network QoS factors (bandwidth, packet loss, delay and jitter) were considered for early detection purpose. Second, based on the condition that keep playback buffer stable during streaming session, the monitoring interval is proposed to be equal to video chunks size.
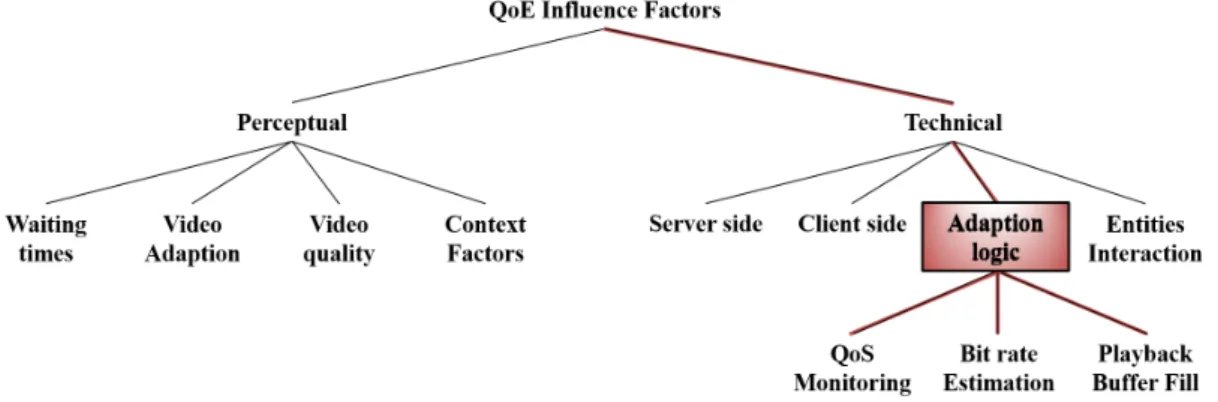
There are numerous QoE influence factors that grouped into perceptual and technical categories, can be promisingly applied for QoE monitoring [11]. Because the end-user always experiences negative changes in video quality once percep-tual factors are recognized, thus, for early detection purpose, the factor within technical category are more suitable. In this work, due to the fact that adap-tion logic plays an important role in adaptive streaming mechanism, the factors that belong to this category are investigated. Among them, only QoS monitoring can be flexibly monitored with arbitrary changeable interval, while the other pa-rameters such as video rate and playback are only obtained in a chunk-by-chunk basic. Therefore, QoS parameters are proposed to be solely monitored for the early detection purpose of the first phase of monitoring layer.
1.3 Biological Information based QoE management
build up its playback buffer as quickly as possible and to reach a maximum buffer size. In order to achieve this, the player initially requests new video chunk with low video rate as soon as the previous one is downloaded. In the second state, the player aims to maintain a constant playback buffers size by requesting video chunk with constant interval. Note that the size of playback buffer can be calculated only when the video player requests video chunk to the server. Thus, it becomes a prominent parameter using in prediction of the properties of application QoS factors (e.g., rebuffering, stalling) that have direct impact on perceived video quality. In this research, with the assumption that the other application QoS factors (e.g., rebuffering, stalling) will not occur, video rate is assumed to directly reflect the QoE. Consequently, any obvious changes in playback buffers size will lead to the variation of video rate. Therefore, predicting the negative changes in playback buffer benefits the early detection of QoE deterioration. By studying the condition of a stable playback buffer, it was found that QoS parameters should be monitored with the interval being equal to video chunk size. A series of experiments were conducted to validate the determined monitoring interval. The results demonstrated that using this interval could achieve an expected balance of computational power and the resulting QoE (defined by the ratio of QoE deterioration).
1.3.2
Collaborative approach using psychophysiology and
psychophysics for determination of QoE threshold
1.3 Biological Information based QoE management
to be equal to the absolute threshold. However, being similar to rating approach, the psychophysics also have drawbacks due to the fact that the methods of per-ception measurement do not provide sufficient insight into underlying perceptual and cognitive process. Because they rely on assessment scales and open-ended questionnaires. Meanwhile, psychophysiology is concerned with the measurement of physiological signals (e.g. Skin conductance, heart rate, etc.). In other words, it can detect the change of target stimulus through the change of physiological signal. For these reasons, this approach is prominent to be applied in perception measurement of psychophysics. Thereby, the relation between physical stimulus and human perception can be eventually modeled. However, individual difference is recognized as the primary shortcoming of this approach.
Therefore, in this research, a combination of psychophysics and psychophysiol-ogy was performed to leverage the advantages of both abovementioned approaches and compensate for their disadvantages. Accordingly, a logarithmic nature func-tion expressing the relafunc-tion between human percepfunc-tion (extracted from biological information) and stimulus intensity (defined as the deterioration of video rate) was established. As the result, an appropriate constraint of QoE threshold was derived from that modeling process. In order to confirm the hypotheses, a num-ber of experiments were conducted. The experimental results demonstrated that using determined threshold constraint not only produces a high QoE but also saves more bandwidth per control.
1.3.3
User-centric approach to accurate bandwidth
allo-cation
1.4 Limitations
precisely determine the target video rate in user-centric manner before allocating bandwidth to the end-user. In that situation, a novel method in bandwidth allo-cation has been proposed. This proposed method is two-fold. First, a pre-defined premium range of subjective expectation in terms of expected MOS is established. This range is from MOS threshold (determined in previous part of dissertation) to the highest MOS value of 5. Second, a regression model of video rate and sub-jective QoE is considered for interpreting the expected MOS to the target video rate. This model was established by performing function approximations using Gaussian radial basic function. The experimental results demonstrated that by using proposed method, more precise bandwidth allocation can be performed, resulting in more saving bandwidth per control.
1.4
Limitations
The subject of study for this dissertation is QoE management in adaptive stream-ing services. The focus of this study is to achieve the optimal balance of network resource utilization and the resulting QoE. However, the proposed method was validated in the scenario of experimental setup with several users only. The sce-nario of many users that share a common bottleneck has not been investigated yet.
In addition, there are numerous issues in maintaining perceived video quality in mobile networks (e.g. bandwidth fluctuation, interference, mobility, etc.), thus, our proposals were initially investigated in wired network only.
As mentioned in previous section, our research also concentrated on the ap-plication of biological information in managing QoE in HAS services. In the research, the collaborative approach using psychophysiology and psychophysics for optimal threshold determination in QoE Management was performed. How-ever, the lack of the information associated with Central Nervous System (CNS) is another limitation in the scope of our work.
1.5
Contributions and Thesis Organization
1.5 Contributions and Thesis Organization
Chapter 1: Introduction
QoE Monitoring QoE Control
Chapter 5:
User-centric Approach to Accurate Bandwidth Allocation
Chapter 6: Discussion
Chapter 7: Conclusion and Future Work
Chapter 4:
Collaborative Approach using Psychophysiology and Psychophysics for Determination of QoE
Threshold
Chapter 3:
Early Detection of QoE Deterioration With Appropriate Monitoring Interval
Chapter 2: Background
1.5 Contributions and Thesis Organization
solutions have been proposed to address several issues related to QoE monitoring and QoE control respectively. The following list summarizes briefly our contri-butions to the problems stated in section 1.2:
1. A biological information based QoE management in adaptive video stream-ing services was proposed. Similar to general frameworks, the proposed frame-work has two main layers including monitoring and control layers. There are two major phases within monitoring layer. The first phase takes into consideration network QoS factors (e.g., bandwidth, packet loss, delay and jitter) as monitoring parameters for early detection of QoE deterioration purpose. Meanwhile, appli-cation QoS factors, memory-driven factors, and especially biological information take place within the second phase. Thereby, a feedback that accurately reflects the end-users satisfaction, will decide whether or not control action should be additionally generated. In control layer, an appropriate QoE threshold has been applied supporting an in-time control action. This threshold is determined by re-lying on modelling process of biological information. For accurate control action, the needed bandwidth will be calculated based on the end-users expectation.
2. An novel method of early detection of QoE deterioration was proposed. In order to achieve a quick detection, it is necessary to determine the monitoring factor and its monitoring interval. Thereby, video rate of playback video is main-tained at an expected level. In fact, any major changes in playback buffer will produce an accordingly variation of video rate. Thus, the condition of a stable playback buffer had been investigated. Interestingly, it was found that the moni-toring interval should be equal to the video chunk size. Applying the determined interval optimized the computational cost at the controller and eliminated the ratio of QoE deterioration.
3. An approach for determining the appropriate QoE threshold was proposed by taking into account the combination of psychophysiology and psychophysics. More concretely, a general logarithmic nature function which expresses the re-lation between biological information and the intensity of video rate, was intro-duced. Thereby, the optimal constraint of QoE threshold was determined and then applied in QoE control. As the result, not only the overall subjective QoE was maintained but also the network resource utilization was improved.
1.5 Contributions and Thesis Organization
video rate is determined from subjective expectation. Afterward, the needed bandwidth is then calculated and allocated to end-user. As the result, compared to the approach which used self-defined target video rate, this proposed approach not only maintained the expected QoE level for the specific user but also saved the available bandwidth per control.
The organization of this thesis is illustrated in Fig.1.7 and described as follows: Chapter 1: Introduction. The motivation and background of this research were described in this chapter. In addition, research overview and research limi-tation also were figured out. The primary contributions of this research were also concretely summarized in this chapter.
Background knowledge is provided in chapter 2. The issues related to two QoE monitoring and QoE control are thoroughly resolved in detail from chapter 3 to chapter 5. Chapter 6 discusses, chapter 7 concretely concludes the work and figures out future work direction.
Chapter 2: Background. This chapter provides a wide range of back-ground knowledge related to QoE, QoE assessment models and HTTP adaptive streaming. In this chapter, the definition of separate phenomenon of ”quality” and ”experience” will be initially clarified, followed by a unique definition of QoE. The numerous of QoE assessment models which play a key role in QoE management framework, are then presented. Typically, there are three types of assessment models including of objective models, subjective models and hybrid models. Their pros and cons are respectively presented. Finally, the hidden mechanism of HTTP adaptive streaming technology is discussed.
Chapter 3: Early Detection of QoE Deterioration With Appropriate Monitoring Interval. This chapter proposes a method to early detect QoE deterioration in QoE monitoring. Initially, the selection of monitoring factors is considered followed by the determination the most suitable factors for early detection of QoE deterioration purpose. By investigating the condition that keep playback stable during a streaming session, the monitoring interval is determined to be equal as the size of video chunk. The experimental results demonstrate that an optimal trade-off between computational cost and the maintaining QoE is achieved.
pro-1.5 Contributions and Thesis Organization
poses a new method to determine the optimal constraint of QoE threshold. The proposed approach is to combine psychophysiology and pyschophysics in order to establish a general logarithmic nature function expressing the relation between biological information and stimulus intensity (video rate deterioration). In this chapter, the issues related to the determination of QoE threshold, background of psychophysiology and psychophysics, and proposed method are briefly described. The evaluation results demonstrate that performing QoE management with de-termined threshold can save more than 4.855% of the bandwidth consumption per control, while ensuring a comparable video quality, in accordance with using the fair threshold.
Chapter 5: User-centric Approach to Accurate Bandwidth Alloca-tion. This chapter proposes a new method to calculate the target video rate in performing precise bandwidth allocation in QoE control. In this chapter, a review on the bandwidth competition in HAS services and the proposed method were clearly presented, emphasizing the crucial role of bandwidth allocation in QoE management in adaptive streaming services. Afterward, the exiting studies in bandwidth allocation is described in order to investigate their pros and cons. Eventually, the proposed method and its evaluation will be clearly stated.
Chapter 6: Discussion. This chapter discusses the work investigated and solutions proposed in this dissertation by which advantages as well as the remain-ing issues will be summarized.
Chapter 2
Background
2.1
Overview of QoE
2.1.1
QoE Definition
In order to understand the definition of QoE, the phenomenon of ”quality” and ”experience” must be initially clarified. Quality is usually connected to the terms of perception. According to [17], quality refers to ”the outcome of an individ-ual’s comparison and judgment process. It includes perception, reflection about the perception, and the description of the outcome. In contrast to definitions which see quality as ”qualitas”, i.e. a set of inherent characteristics, we con-sider quality in terms of the evaluated excellence or goodness, of the degree of need fulfillment, and in terms of a ”quality event””. On the other hand, not only involving perception, quality is considered to connect to expectation as well. Some authors strongly indicate the correlation between quality, perception and expectation throughout the following definitions:
• ”The feeling of high quality occurs when perception exceeds expectation; the feeling of low quality occurs when perception does not meet expectation” [18].
• ”Degree to which a set of inherent characteristics fulfils the requirements”, where the requirement is defined as need or expectation [19].
2.1 Overview of QoE
event is considered as ”an observable occurrence. An event is determined in space (i.e. where it occurs), time (i.e. when it occurs), and character (i.e. what can be observed)”. For instance, an experience might result from an encounter of a hu-man being with a system, service or artifact. An experience does not encompass everything a person has undergone in the past, but this is referred to as a human influence factor on QoE.
After considering the phenomenon of ”quality” and ”experience, the defini-tion of Quality of Experience (QoE) must be jointly defined. In general, ”QoE measures the quality experienced while using a service” [20]. However, in this definition, the terms of perception and expectation have not been taken into con-sideration. On the other hand, the relation to the subjective perception of the user and its expectation is clearly evident throughout the definition of the Eu-ropean Network on Quality of Experience in Multimedia Systems and Services [17]: ”Quality of Experience (QoE) is the degree of delight or annoyance of the user of an application or service. It results from the fulfillment of his or her expectations with respect to the utility and / or enjoyment of the application or service in the light of the user’s personality and current state”.
2.1.2
QoE Influence Factors
Any characteristic of a user, system, service, application, or context whose actual state or setting may have influence on the Quality of Experience for the user [17]. The influence factors (IFs) might be grouped in three categories - Human IF, System IF, and Context IF. More concretely, a human IF is ”any variant or invariant property or characteristic of a human user. The characteristic can de-scribe the demographic and socio-economic background, the physical and mental constitution, or the user’s emotional state”. System IFs refer to ”properties and characteristics that determine the technically produced quality of an application or service [21]. Meanwhile, context IFs are factors that embrace any situational property to describe the user’s environment in terms of physical, temporal, social, economic, task, and technical characteristics [21][22].
2.2 QoE assessment models
form a conceptual relationship between QoS and QoE. Throughout this model, it is clear to find that the QoE influence factors can also be grouped into network QoS factors (are indirectly perceived by the user) and application factors (are di-rectly perceived by the user). In that study, the network QoS factors comprising of (Round-trip time (RTT), bandwidth and packet loss) were considered, whereas, initial buffering time, mean rebuffering duration and rebuffering frequency were the focuses as the application QoS factors.
2.2
QoE assessment models
QoE assessment models refers to the translators between a set of technical (QoS) and non-technical (subjective and contextual) key influence factors and user per-ception, and ultimately, user experience [23]. These models can be categorized into three classes: Objective models, Subjective models and hybrid models. They will be briefly presented in the next subsections.
2.2.1
Objective QoE assessment models
Objective QoE assessment models are concerned with the models that contain objectively collected measurements of factors that affect QoE. By using these methods, the objective factors can be measured automatically at a lower cost than subjective methods. In general, objective quality assessment methodologies can be categorized into five types [24][25]. These are media-layer models [26], [27], parametric packet-layer models [28], parametric planning models [25], bitstream-layer models [29]and hybrid models [30][31][32].
2.2 QoE assessment models
a reference, partial information about a reference, or no reference is used in assessing the quality, respectively. Full- and reduced-reference methods are important for the evaluation of video systems in non-real-time scenarios where both the original video data or a reduced feature data set, and the distorted video data are available. Full-reference visual quality assessment metrics and high-complexity non-real-time RR and NR metrics fall within this class. On the other hand, the in-service methods place strict time constraints on the quality assessment and are performed during streaming applications.
• A parametric packet-layer model predicts QoE solely from packet-header information, enabling very lightweight measurement without handling the media signal itself. However, it was difficulty evaluating the content de-pendence of QoE, for example, because it does not look at the payload information.
• A Parametric planning model make use of quality planning parameters for networks and terminals to predict the QoE. As a result, it requires a priori knowledge about the system that is being tested.
• A bitstream-layer model occupies a position between media-layer models and parametric packet-layer models. It utilizes encoded bitstream informa-tion, in addition to the packet-layer models, so that it can take into account the content-dependent quality evaluation characteristics with a relatively light computational load.
• A hybrid model is a combination of the previously mentioned technologies. It is effective in terms of exploiting as much information as possible to predict QoE.
2.2.2
Subjective QoE assessment models
2.2 QoE assessment models
• Rating approach is the most commonly used method in subjective evalua-tion. Typically, the information regarding subject0s judgment in the form of rating that describe their perception of the respective quality experienced, is derived from this approach. This method has been standardized by the recommendations like ITU-R BT.500-11 [37], providing detailed guidelines regarding choice of test conditions, rating scales, etc. The most common grading scale for rating process is Mean Opinion Score (MOS) which is based on an ordinal five-point scale (1) bad; (2) poor; (3) fair; (4) good; (5) excellent. Despite being popular method, rating approach has significant shortcomings due to the high bias and variability in the results, leading to the less precise QoE assessment.
• Psychophysiological approach provides a measure of implicit rather than explicit responses to physical stimuli and thus overcomes the problem of rating approach [38]. More concretely, this approach utilizes the mea-surement of biological information in order to detect correlations to psycho-logical responses in humans. The biopsycho-logical information measurements are categorized into the following classes [38] - Central Nervous System (CNS), Eye Measurements and Autonomic Nervous System (ANS).
• Psychophysical approache has been introduced to overcome the limi-tation of rating approach in QoE assessment by attempting to precisely express the relation between perception and physical stimuli. The ideas be-hind these approaches are either to estimate the parameter value for which the distortion becomes perceptible [39], to scale the relative differences per-ceived between physical stimuli [40], or to define the smallest detectable different between two stimulus’s intensities [41]. Despite being applied in wide range of scientific fields, the accuracy of the estimation of perception
2.2.3
Hybrid QoE assessment models
2.3 HTTP adaptive streaming mechanism
QoE monitoring. Despite of the fact that objective models can be able to provide an automatic way to estimate QoE, the accuracy of such the estimations actually are not as high as those of subjective models. In addition, due to the require-ment of reconstruction of video, the application of objective model in real-time is unrealistic. On the other hand, due to the fact that QoE estimation depends on real judgment of human, subjective methods cannot be performed in automatic and real-time fashion. In order to satisfy the original requirements, hybrid QoE assessment models have been introduced by mapping QoE influence factors (e.g. QoS) to the QoE in various ways. These methods leverage the advantages of both objective and subjective methods, while eliminating their drawbacks. QoE influence factors can be mapped to QoE by using the machine learning tech-niques [42][43][44][32] or by extending the existing objective methods with hybrid no-reference prediction model [45]. As the most common hybrid model, Pseudo Subjective Quality Assessment (PSQA) [31][32] was established by training a Random Neural Network (RNN) to capture the relation between QoS parame-ters and subjective evaluations by users. As the result, the trained network can be used for QoE estimation in automatic, accurate and real-time manners. For these reasons, hybrid model is sole consideration in QoE assessment in our studied framework.
2.3
HTTP adaptive streaming mechanism
This section provides an overview of HTTP adaptive streaming (HAS) as the most common video delivering techniques. This technique was introduced in 2008 [9] by Move Networks in order to overcome the limitation of existing adaptive streaming techniques as well as HTTP progressive download. Since then, it has quickly become a de-facto standard for adaptive streaming solutions.
2.3 HTTP adaptive streaming mechanism
Video Segmentation
Video Encoding Video decoding
Buffer Adaptive Bitrate
Selection
HTTP Request
Streaming Server Client
Figure 2.1: HTTP Adaptive Streaming framework
Adaption Module
Request Scheduling End of the last
download
Time for the next download Resource
Estimation System and network
resources
Estimated Capacity
Next video rate
2.3 HTTP adaptive streaming mechanism
OFF period
ON period
Buffering state
Server
Client
Request
Response
Steady state
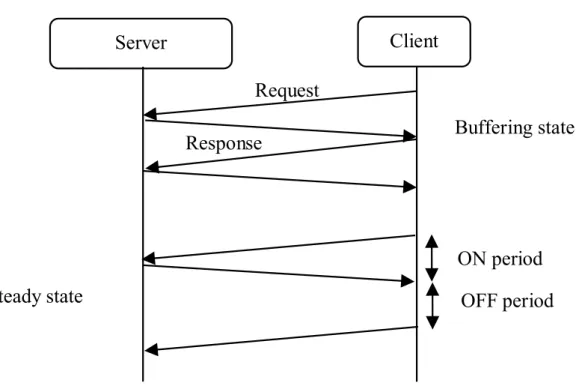
Figure 2.3: Buffering state and steady state in a streaming session
2.4 Summary
does not wait until the end of the buffering state before a playback begins. This can be achieved when either a certain amount of content is downloaded or the buffer size reaches a predefined target (let say as Bmax). For example, Microsoft
Smooth Streaming has a playback buffer of about 20 seconds but starts playing when the buffer contains just about 10s worth of download [48]. Likewise, Netflix has a buffer size of 300s worth of content but begins playback 13s after receiving the first packet [48]. Afterward, then the steady state (or periodic download) is activated. In this state, HAS player attempts to maximize video rate by keeping playback buffer stable at Bmax. To do so, the player is required to download a
chunk and then pause for a short time before downloading the next chunk. The download period and pause period are called ON and OFF period, respectively. When stimulus occurs (e.g. available bandwidth deterioration), the buffering state will be re-activated.
2.4
Summary
Chapter 3
Early Detection of QoE
Deterioration With Appropriate
Monitoring Interval
Developing the QoE management process is a non-trivial exercise since capturing QoE is a very subjective process. QoE is subjective because it is driven psy-chologically as well as technically. Thus, monitoring layer in QoE management system where QoE estimation takes place should be initially discussed. For this reason, in this chapter, the monitoring layer will be thoroughly explained along-side a proposed method for early detection of QoE deterioration. Thereby, the research goal, which achieves the balance between optimizing network resource utilization and maintaining QoE, can be made.
3.1
Introduction
3.1 Introduction
the use of that model to automatically estimate QoE in real-time. The primary requirements of QoE monitoring are to early and accurately detect QoE deteriora-tion based on reliable estimadeteriora-tions during a streaming session, serving the purpose of maximizing QoE with minimum network resource usage. In order to achieve this, a two-phase monitoring layer has been introduced in the proposed biological information based QoE management framework. Fig. 3.1 depicts the proposed QoE monitoring layer comprising of two monitoring phases. The focus of the first phase is to early detect QoE deterioration to avoid the perceivable video quality distortion during a streaming session. Meanwhile, the second phase refers to the validation of the first phase with more reliable QoE estimation followed by addi-tional control if it is necessary. In this dissertation, the first monitoring phase is focused on, whereas the second phase will be considered as the future work.
QoE Estimation 2 QoE Estimation 1 Monitoring - Phase 1 Monitoring - Phase 2 QoS parameters Application QoS, Memory-driven factors, Biological information Monitoring Layer Estimated QoE 1 Estimated QoE 2
Figure 3.1: Two-phase QoE monitoring layer
In a design of QoE monitoring, the following steps need to be in turn per-formed: (1) Selection of appropriate monitoring factors and (2) Selection of a suitable monitoring interval. In this study, such a design needs to be aligned with the requirement of the first phase, that is to say, early detection of QoE deterioration.
3.1 Introduction
Figure 3.2: Classification of QoE influence factors in adaptive streaming services
3.2 Related Work
by observing the status of playback buffer. Because both the playback buffer and the video rate are categorized into application QoS, thus, they are affected by network QoS parameters. In other words, network QoS can be regarded as a situational indicator showing the variation of playback buffer and video rate. Monitoring network QoS provides a prediction of playback buffer, benefiting the purpose of early detection of video rate deterioration.
In adaptive streaming technology, both playback buffer and video rate are typ-ically obtained on a chunk-by-chunk basic [57][58] that relies on the timestamp of two successive requests sent by video player. In other words, the monitoring interval of those parameters are uncontrollable. It leads to the fact that their deteriorations have already been perceived by the end-user before control action is triggered. As a potential monitoring factor, on the contrary, network QoS can be captured with more flexible self-defined interval. To the best of our knowl-edge, there are no studies that seriously focus on monitoring interval in QoE management. In literature, the existing works usually come up with a very small monitoring interval. However, small interval always causes high computational cost on the network entity in which monitoring component is being deployed in, whereas, long interval leads to high ratio of deterioration of video rate. There-fore, in this chapter, a novel method is proposed to early detect QoE deterioration through the determination of monitoring factor and the appropriate monitoring interval. This proposal is inseparable from an expected balance of the computa-tional cost and the ratio of video rate deterioration. Particularly, the monitoring interval is derived from a considered condition which makes playback buffer stable during a streaming session. Accordingly, the optimal interval is determined as being equal to the size of a video chunk. The experimental results demonstrate that by applying determined interval, a balance between the average CPU load and the ratio of video rate deterioration is achieved at the value of 11.45%.
3.2
Related Work
3.3 Methodology
In [59] [60] video rate was monitored to evaluate the performance of the pro-posed video quality adaption scheme. Thereby, these authors confirmed that their proposal was more advanced than other works in terms of justifying QoE defined by monitored video rate. However, in [48], the authors stated that it always takes time for video rate to adapt to the network condition. Thus, such a control action is meaningless if it relies on video rate monitoring since the video deterio-ration has already been perceived by the end-user. Both video rate and playback buffer can be obtained on a chunk-by-chunk basic [57][58], thus, the same con-sequence is also found in playback buffer monitoring [61][62]. In that case, only QoS parameters are prominent for the original purpose of early detection of QoE deterioration.
Network QoS is considered as a monitoring factor in a number of contemporary studies [63][49][31][64][65]. Using the network QoS parameters, the monitoring in-terval can be flexibly self-defined without depending on chunk-by-chunk basic. It is also well-suited for quickly predicting video rate deterioration [66][67]. If moni-toring interval is too small, the computational cost of Controller becomes higher. Additionally, incorrect control action will also be generated due to the spike fluctuation in traffic throughput. Particularly, if the bandwidth instantaneously deteriorates, then recovers, the activation of control action becomes meaningless. If the interval is too large, video rate deterioration might be perceived before the generation of control action. Therefore, an appropriate monitoring interval needs to be determined to optimize computational cost and eliminate the ratio of video rate deterioration.
In this chapter, the proposed method for determining an appropriate monitor-ing interval will be presented. Along with that a series of experiments have been performed in order to validate the determined interval. The experimental results demonstrate that using determined monitoring interval, a balance between the computational cost and the ratio of video rate deterioration has been achieved.
3.3
Methodology
3.3 Methodology
Afterward, the method that relates to QoE estimation is proposed for the deter-mination of appropriate monitoring interval.
3.3.1
PSQA approach in QoE assessment
In literature, hybrid QoE assessment has emerged as the most common model in expressing the relation between QoE influence factors and QoE indicators. In this study, Pseudo Subjective Quality Assessment (PSQA) is mainly taken into account due to its advances [32]. This model is capable of estimating QoE in accurate and automatic manner and if necessary in real-time. Particularly, the model was established by training a Random Neural Network (RNN) to map QoS to QoE. The training process and operations of PSQA are depicted in the Fig.3.3 and Fig.3.4, respectively.
3.3 Methodology
parts: training data, validation data and testing data corresponding to 70%, 15%, and 15% of the dataset. The training data is presented to the network during training, and the network is adjusted according to its error. The validation data is used to measure the network generalization and to halt the training process when the generalization stops improving. The testing part has no effect on the training process, and thus provides an independent measure of network perfor-mance during and after the training process. Apart from the training dataset, the neural network architecture was also considered, which comprises of totally 4 neurons for input layer, 10 neurons for hidden layer and 1 neuron for output layer. The training process is shown in Fig.3.3. As the result, correlation coef-ficient (denoted by R) was calculated, which is equal to 0.91. It means that the predicted data has a well correlation with actual data. Therefore, the trained neural network can be used for MOS estimation.
client M O S Parameter configurations Subjective Quality Assessment Human Evaluation Parametric Modified Videos Training RNN
Figure 3.3: Training process of PSQA
Bandwidth Packet loss ...
991kbps 0.1 Pseudo Subjective Quality Assessment (PSQA) Trained RNN Parameters measurement Real Modified video
Figure 3.4: Practical usage of PSQA in QoE assessment
3.3.2
Determination of appropriate monitoring interval
3.3 Methodology
is continuously estimated from monitored QoS parameters (bandwidth, packet loss, delay and jitter). For the research purpose of early detection of video rate deterioration, the estimated MOS must precisely reflect the status of video rate in real-time. This can be achieved if MOS is estimated at the right time, depending on QoS monitoring interval. In fact, the smaller QoS monitoring interval is, the earlier detection of video rate deterioration can be guaranteed. However, using too small monitoring interval might cause some consequences. For example, some spike fluctuations of QoS parameters will lead to incorrect estimation, resulting in meaningless control action. In addition, the computational cost of monitoring entity is also a big issue for the large network system. Therefore, monitoring QoS with an appropriate interval is extremely important, especially for precisely cap-turing the status of video rate. Before going further, it is necessary to understand how video rate varies during a streaming session.
3.3 Methodology
the throughput of a recently downloaded chunk as a rough estimate of the cur-rent network conditions [70][71]. However, the instant throughput derived from a single chunk is hardly used since it is prone to short-term fluctuations as result of, for instance, the time-varying nature of the available bandwidth, or the dy-namics of TCP. In order to address this problem, the concept of running average was introduced as follows:
T = (
αT (i − 1) + (1 − α)T (i), i > 1
T (1), i = 1 (3.1)
where T (i) is the throughput of the ith chunk, T is the running average. However, when video players have to compete for available bandwidth, the op-erations of ON and OFF period will cause unfairness and instability in video rate selection [72]. It means that sufficient knowledge about the status of video rate cannot be provided only by throughput estimation. As mentioned in subsection 2.3, playback buffer plays a central-role within video rate adaption mechanism. In general, the video players always attempts to maintain playback buffer size at a stable level, resulting in high requested video rate. In addition, playback buffer can be easily obtained in application layer despite bandwidth competition [61]. Therefore, it promisingly provides an accurate prediction of video rate variation. In order to practically confirm this indication, an experiment was conducted. The experimental scenario was as follows: The end-user watches a movie with a high video rate under a good network condition in which available bandwidth is high (around 5000kbps), whereas, packet loss, delay and jitter are assumed to be negligible. The behaviors of both playback buffer and video rate are continuously observed when:
1. The available bandwidth is dramatically decreased to 1024kbps at t = 20s (before playback buffer reaches Bmax).
2. The available bandwidth is dramatically decreased to 1024kbps at t = 60s (after playback buffer reaches Bmax).
There were two evaluation metrics that were considered in this experiment which are tdelay−buf f er, and tdelay−bitrate, that is to say, the duration time until
3.3 Methodology
three major entities including a client, a streaming server and a router. Microsoft smooth streaming player and a packet sniffer (Wireshark) were deployed at client. Wireshark allows us to capture and analyze the traffic which comes from and to HTTP server offline. The router, namely, WAN Emulator is capable of controlling the available bandwidth of the client. During the experiment, the video rate was derived from HTTP GET packet header, whereas, the playback buffer was calculated through Eq.3.2 as follows:
Btk = Btk−1 − ∆t+ (t 0
k− t
0
k−1) = Btk−1− ∆t+ V (3.2) where Btk is playback buffer size at time point tk, Btk−1 is playback buffer size at time point tk−1, whereas, t
0
k and t
0
k−1 are timestamp of HTTP video request
at time point tk and tk−1, respectively, ∆t is the duration time between two
successive requests. V is equal to video chunk size (in second). The specific value of V depends on the type of adaptive streaming player.
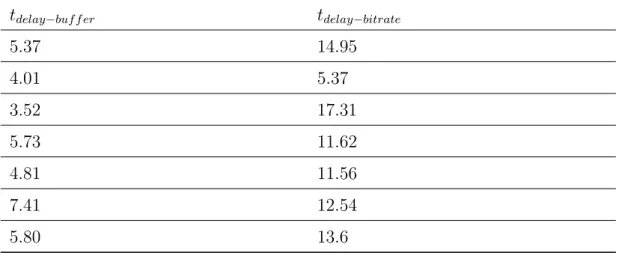
Table 3.1 shows the sample dataset of experiment with two studied metric tdelay−buf f er and tdelay−bitrate. The means of the waiting time until the first negative
adaptions of both playback buffer size and video rate are respectively 5.76s and 12.69s, respectively. Interestingly, during the experiment, the 2nd decrease of playback buffer always occurs at the same time with the first decrease of the video rate. Therefore, capturing the first decrease of playback buffer provides a prominent prediction of the decrease of video rate. For this reason, it is necessary to investigate the condition that keeps playback buffer stable during a streaming session. In fact, such the condition can be expressed as Eq. 3.3.
Btk − Btk−1 ≥ 0 (3.3) Consequently, based on Eq. 3.2, the above condition is transformed as:
∆t≤ V (3.4)
Accordingly, if the condition in Eq. 3.4 is guaranteed, it will prevent video rate from deteriorating in a streaming session. Particularly, the video player must keep sending requests with the interval (∆t(s) ) which is higher or equal to the
3.4 Evaluation
Table 3.1: Sample dataset with two metrics: tdelay−buf f er, and tdelay−bitrate
tdelay−buf f er tdelay−bitrate 5.37 14.95 4.01 5.37 3.52 17.31 5.73 11.62 4.81 11.56 7.41 12.54 5.80 13.6
3.4
Evaluation
The purpose of this evaluation is to verify how elaborately the proposed moni-toring interval facilitates maintaining the video rate level when the network con-dition is getting worse. More concretely, since the determined interval of MOS monitoring is applied, the following metrics has been evaluated:
• Ratio of video rate deterioration.
• Average CPU load.
• Detection time tdwhich represents how quickly video rate deterioration can
be detected if compared with method which uses video rate as monitoring indicator.
• Recovery time tr of video rate which represents the duration time from
when control action is generated until video rate is recovered to expected level.
3.4 Evaluation
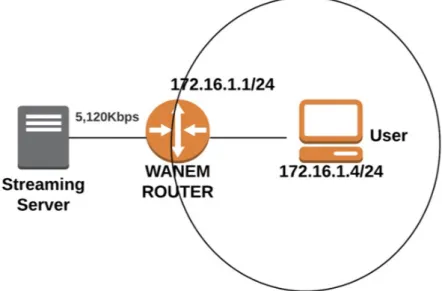
and controlling QoS data (available bandwidth, packet loss, delay, and jitter), but also calculating MOS based on QoS data. The streaming sever was deployed on a desktop computer with Windows 8.1, Intel Core i5 3.10 GHz processor and 8 GB RAM. The server published a Microsoft smooth streaming (MSS) video content of ”Big Buck Bunny” which is known as an open source testing movie. This movie content was en-coded with multiple bit rates. Furthermore, a Smooth Streaming-compatible Silverlight player template was installed on the Smooth Streaming enabled streaming server so that Silverlight-based clients can play Smooth Streams. A video client was a laptop computer with MacOS, Core i5 and 8 GB RAM in which the latest version of Microsoft Silverlight add-on was installed. The server and the client were located in different broadcast do-mains and they were connected via the router. The network topology used for the experiments is shown in Fig. 3.5. In addition, Wireshark, which is a network packet analyzer, installed on the router captured the HTTP request from the client. Note that MSS applies the value 2s of V during streaming session [48], thus, in this experiment, the optimal interval of 2s was evaluated.
Figure 3.5: Experimental setup for evaluating the optimal monitoring interval throughout three evaluation metrics
For evaluating two first metrics, the experimental scenario was performed as follow: the estimated MOS was monitored with respect to interval tmon ∈
3.4 Evaluation
1) A client starts watching a streaming video content.
2) Stimulus is generated in buffering state and steady state by decreasing available bandwidth on purpose to make the network quality deteriorated (from 5000kbps to 1024kbps).
3) The packet loss, delay and jitter in the network and average CPU load in Controller (where QoE monitoring and QoE control are performed) are observed.
4) The deterioration is detected by observing the estimated MOS.
5) The available bandwidth to the user is immediately increased to recover the net-work quality when the deterioration of video rate is detected (from 1024kbps to 5000kbps). 0 0.1 0.2 0.3 0.4 0.5 0.6 0.7 0.8 0.9 1 0 0.1 0.2 0.3 0.4 0.5 0.6 0.7 0.8 0.9 1 1 1.5 2 2.5 3 3.5 A ve ra ge C PU L oa d R at io of vi de o r at e de te ri or at ion Interval (s)
Buffering state Steady state Average CPU Load
Figure 3.6: Ratio of QoE deterioration and average CPU load in both scenarios
Ratio of video rate deterioration is determined by ratio of the number of times the video rate decreases to the total number of times the experiment is repeated. Meanwhile, average CPU load stands for means of CPU load of the Controller in each experiment’s iteration. Particularly, with each value of tmon, the above
3.4 Evaluation
n to 10 times of total was calculated for each value of tmon. Alternatively, the
average CPU load of the Controller for each interval was also recorded.
Figure 3.6 compares the ratio of deterioration of video rate according to the monitoring interval varying from 1s to 3.5s with both buffering state and steady state. It is clear that those ratios significantly increased when tmon > 2s. Overall,
a much higher percentage of video rate deterioration could be seen in buffering state in comparison with steady state, and buffering state experienced the faster growth of such ratio. As explained in background knowledge section, during the buffering state, HAS player attempts to fill the playback buffer as quickly as possible. Whereas, during the steady state, buffer occupancy is stable at Bmax.
Therefore, video rate becomes more sensitive to stimulus within buffering state than in the steady state. In this figure, during the streaming session, average CPU load showed a clear trend in which it linearly decreased across monitoring interval values from 14.46% to 8.18%.
Particularly, during the buffering state, an increase trend clearly could be seen in ratio of video rate deterioration when the monitoring interval was higher than 2s. A slight fluctuation was found in range of between 1.5s and 2s. However, such fluctuation did not always occur when the whole procedure was repeated several times. Interestingly, the ratio reached to peak of 100% of video rate deterioration when monitoring interval is larger than 3.2s. When monitoring interval was varied from 1s to 2s during steady state, the ratio of video rate deterioration was stable at lowest value of 0.1 of accuracy. However, when the monitoring interval was larger than 2s, the ratio of video rate deterioration quickly rocketed to 0.6 of accuracy before witnessing a large fluctuation in range of between 2.5s and 3.5s. This fluctuation was also explained as the result of limitation of this QoE management algorithm performance. The algorithm frequently called PSQA model (written in Matlab) by which it could generate some ”spike” in Controller’s processing time. Actually, this abnormal fluctuation could not be seen when the experiment procedure was repeated several times.
![Figure 1.1: Survey on how the US young adults watch television these day [1] 73%27%2016 82%18%2021 Video Traffic Other Traffics](https://thumb-ap.123doks.com/thumbv2/123deta/9765989.1849993/14.892.233.722.223.516/figure-survey-young-adults-television-video-traffic-traffics.webp)