Doctoral Dissertation
Shibaura Institute of Technology
A Study of Model of Kawaii Feelings
for Evaluation of Products
September 2018
A STUDY OF MODEL OF KAWAII FEELINGS
FOR EVALUATION OF PRODUCTS
BY
TIPPORN LAOHAKANGVALVIT
A DISSERTATION SUBMITTED IN PARTIAL FULFILLMENT OF THE REQUIREMENTS FOR THE DEGREE OF
DOCTOR OF PHILOSOPHY
IN THE
FUCTIONAL CONTROL SYSTEMS
GRADUATE SCHOOL OF ENGINEERING AND SCIENCE SHIBAURA INSTITUTE OF TECHNOLOGY
i
Declaration of Authorship
I, Tipporn LAOHAKANGVALVIT, declare that this thesis titled, “A Study of Model of Kawaii Feelings for Evaluation of Products,” and the work presented in it are my own. I confirm that:
This work was done wholly or mainly while in candidature for a research degree at Shibaura Institute of Technology.
Where any part of this thesis has previously been submitted for a degree or any other qualification at Shibaura Institute of Technology or any other institution, this has been clearly stated.
Where I have consulted the published work of other, this is always clearly attributed. Where I have quoted from the work of others, the source is always given. With the
exception of such quotations, this thesis is entirely my own work. I have acknowledged all main sources of help.
Where the thesis is based on work done by myself jointly with other, I have made clear exactly what was done by others and what I have contributed myself.
Signed: ___________________________________ (Tipporn LAOHAKANGVALVIT)
ii
Abstract
For more than twenty years, Kansei engineering, which is a consumer-oriented methodology, has been recognized as an important part in a broad range of Japanese manufacturing. By making products to which kansei values are added, products can provide greater emotional fulfilment and make a larger impact on first impressions, which is a key to motivate consumer purchases. According to success of many kawaii products, kawaii is considered as one important kansei value for future product design and development. Therefore, this conduct this research to study kawaii feelings to clarify effectiveness of eye tracking to measure kawaii feelings, construct model of kawaii feelings, and employ eye movement indexes to clarify effective attributes to design kawaii products.
To clarify effectiveness of eye tracking to measure kawaii feelings, I experimentally evaluated the kawaiiness of illustrations while the eye tracking was being recorded. As the results, I clarified the relationship between kawaii feelings and eye movement indexes, and identified two new indexes. Therefore, I clarified that eye tracking was effectively used to evaluate kawaii feelings.
iii
To clarify effective attributes to design kawaii products using eye tracking, I performed two steps. First, I defined candidates of effective attributes based on the results of the constructed models. For the model for spoon designs constructed by SVM algorithm, it can generate the attributes as output. However, the model constructed by Deep CNN algorithm cannot generate such output. Therefore, I developed a new method to evaluate the attributes, which was to modify images of cosmetic bottles and employed the model to predict the kawaiiness of those images. Second, I employed eye movement indexes identified in previous experiment to clarify effective attributes for both spoon designs and cosmetic bottles. Finally, I clarified the relationship between attributes and eye movement indexes. The results clarified effective attributes to design kawaii products and confirmed the effectiveness of using eye tracking for product evaluation.
iv
“We don’t look backwards for very long.
We keep moving forward, opening up new doors, and doing new things, because we’re curious…and curiosity keeps leading us down new paths.”
vi
Acknowledgments
I would like thank all people who had assisted and supported me throughout my research. My deepest thanks and appreciation are given to my supervisors, Prof. Michiko Ohkura, Ph.D. and Assoc. Prof. Tiranee Achalakul, Ph.D., for their guidance and encouragement. Their kindnesses to see something in me that I did not see in myself have motivated me to keep opening new doors and make a positive difference in my life. Moreover, I would like to thank my research committees, Prof.Masaomi Kimura, Prof.Eiji Kamioka, Prof.Ryota Horie, and Prof.Toshi Kato, who serve as my committee members even at during their difficult times.
In addition, I would like to thank the Shibaura Institute of Technology (SIT) and Department of Computer Engineering of King Mongkut’s University of Technology Thonburi (KMUTT) to select me as a student in Hybrid Twinning Program under the financial support by Monbukagakusho (MEXT) scholarship. Furthermore, I would like to thank all the participants, especially students from Shibaura Institute of Technology and King Mongkut’s University of Technology, for their cooperation in my research.
viii
Contents
Declaration of Authorship ... i Abstract ... ii Acknowledgments ... vi Contents ... viiiList of Figures ... xii
List of Tables ... xvi
Abbreviations ... xviii
Chapter 1 Introduction ... 1
1.1 Motivation ... 1
1.2 Problem Statement ... 3
1.3 Research Questions ... 4
1.4 Research Goals and Contribution ... 4
1.5 Organization of Thesis ... 5
Chapter 2 Related Works ... 7
2.1 Kansei Engineering ... 7
2.2 Kansei Value ... 8
2.3 Kawaii ... 9
2.4 Kansei Measurement... 11
Chapter 3 Clarification of Relationship between Kawaii Feelings and Eye Movements ... 15 3.1 Background ... 15 3.2 Experiment Method ... 17 3.2.1 Visual Stimuli ... 17 3.2.2 Comparison System ... 17 3.2.3 Experimental Setup ... 19 3.2.4 Experimental Procedure ... 20 3.3 Experimental Results ... 21 3.3.1 Participants ... 21 3.3.2 Cumulative Results ... 21 3.3.3 Questionnaire Results ... 22
ix
3.4 Discussion ... 31
3.5 Conclusion ... 34
Chapter 4 Evaluation of Spoon Designs based on Kawaiiness between Genders and Nationalities ... 35
4.1 Background ... 35
4.2 Preparation ... 36
4.2.1 Collection of Spoon Designs ... 36
4.2.2 Preparation of Spoon Designs ... 37
4.3 Preliminary Experiment ... 37
4.3.1 Participants ... 37
4.3.2 Preliminary Experimental Procedure ... 38
4.3.3 Preliminary Experimental Results ... 38
4.4 Experiment on Comparison of Spoon Designs ... 39
4.4.1 Candidates of Spoon Designs ... 39
4.4.2 Comparison System ... 40
4.4.3 Experimental Setup and Procedure ... 42
4.5 Experimental Results ... 42
4.5.1 Participants ... 42
4.5.2 Comparison Results ... 43
4.6 Discussion ... 49
4.7 Conclusion ... 50
Chapter 5 Construction of Models of Kawaii Feelings for Spoon Designs ... 51
5.1 Background ... 51
5.2 Method for Model Construction ... 53
5.2.1 Dataset Preparation ... 53
5.2.2 Feature Extraction ... 54
5.2.3 Model Training ... 56
5.2.4 Model Validation ... 57
5.3 Results of Model Construction ... 58
5.3.1 Classification Results ... 58
5.3.2 Results of Effective Attributes ... 58
5.4 Discussion and Conclusion ... 61
Chapter 6 Relationship between Physical Attributes of Spoon Designs and Eye Movements Caused by Kawaii Feelings ... 63
6.1 Background ... 63
6.2 Experiment Method ... 64
6.2.1 Selection of Attributes for Spoon Designs ... 64
6.2.2 Candidates of Spoon Designs ... 66
6.2.3 Comparison System ... 67
6.2.4 Experimental Setup and Procedure ... 68
6.3 Experimental Results and Discussion ... 69
6.3.1 Participant ... 69
6.3.2 Cumulative Result ... 70
6.3.3 Questionnaire Result ... 70
6.3.4 Results of Eye Tracking Data ... 70
6.3.5 Comparison Results among Physical Attributes, Cumulative Result, and Eye Movement Data ... 74
x
Chapter 7 Construction of Models of Kawaii Feelings for Cosmetic Bottles and Their
Relationship with Eye Movements ... 79
7.1 Background ... 79
7.2 Data Collection on Evaluation of Kawaiiness for Cosmetic Bottles ... 81
7.2.1 Experiment Method ... 81
7.2.2 Experimental Results and Discussion ... 82
7.3 Model Construction of Kawaii Feelings for Cosmetic Bottles ... 85
7.3.1 Method for Model Construction ... 85
7.3.2 Results of Model Construction ... 89
7.3.3 Discussion ... 90
7.4 Evaluation of Attributes of Cosmetic Bottles using Model ... 91
7.4.1 Evaluation Procedure ... 91
7.4.2 Evaluation Results and Discussion ... 91
7.5 Relationship among Physical Attributes of Cosmetic Bottles, Model, and Eye Movements Caused by Kawaii Feelings ... 96
7.5.1 Experiment Method ... 96
7.5.2 Experimental Results ... 103
7.5.3 Discussion ... 116
7.6 Conclusion ... 117
Chapter 8 Discussion ... 119
8.1 Summary of previous chapters ... 119
8.2 Clarification of relationship between kawaii feelings and eye movement indexes ... 120
8.3 Construction of model of kawaii feelings ... 121
8.4 Clarification of effective attributes to design kawaii products ... 122
8.5 Potential of this research ... 122
Chapter 9 Conclusion and Future Work ... 125
9.1 Conclusion ... 125
9.2 Future Work ... 127
References ... 129
xii
List of Figures
Figure 1.1 Structure of this thesis ... 5
Figure 2.1 Structure of kansei engineering [1] ... 8
Figure 2.2 Characteristic of industrial products in which kansei value is proposed as new value axis ... 9
Figure 2.3 Examples of attributes to design kawaii products [15] ... 10
Figure 3.1 Eye movements recorded during an evaluation of six kawaii illustrations ... 16
Figure 3.2 Original kawaii illustrations ... 17
Figure 3.3 Example of page in comparison system showing two illustrations and selection arrows ... 18
Figure 3.4 Experimental setup where participant looks at illustrations on PC monitor while eye tracking system records his eye movements ... 19
Figure 3.5 EyeTech TM3 non-intrusive eye tracker ... 19
Figure 3.6 Experiment scene ... 20
Figure 3.7 Example of AOIs of two illustrations with identical shape and size showing areas included in analysis of eye tracking data ... 24
Figure 3.8 Total AOI duration vs. illustration groups of females in their 20’s ... 25
Figure 3.9 Total number of fixations vs. illustration groups of all participants ... 26
Figure 3.10 Total number of fixations vs. illustration groups and participant groups of females in their 20’s ... 26
xiii
Figure 3.12 Number of transitions between AOIs and differences of kawaii scores of all
participants ... 27
Figure 3.13 Example of method to calculate number of matchings between last-eye-position illustrations and selected illustrations ... 28
Figure 3.14 Number of matchings between last-eye-position and selected illustration of first 15 illustration pairs for each participant ... 28
Figure 3.15 Total duration of decision and difference of kawaii scores for females in their 20’s ... 29
Figure 3.16 Example of illustration divided into three focused areas (head, body, and other areas) ... 30
Figure 3.17 Example of illustration showing method to measure head and body heights . 30 Figure 3.18 Percentage of first fixations for all participant and illustration groups ... 31
Figure 4.1 Layout of spoon design (Aoyoshi Co., Ltd.) ... 36
Figure 4.2 Screenshot of questionnaire in preliminary experiment ... 38
Figure 4.3 Candidates of spoon designs ... 39
Figure 4.4 Screenshot of spoon comparison system displaying two spoon designs... 40
Figure 4.5 Tree structure of quicksort-based comparison ... 42
Figure 4.6 Example of the method to rank and score the spoon designs ... 43
Figure 4.7 Comparison of average scores among participant groups for each shape of spoon designs ... 44
Figure 4.8 Comparison of average scores among shapes of spoon designs for each participant groups ... 45
Figure 4.9 Average scores of 39 spoon designs among four participant groups... 46
Figure 4.10 More kawaii spoon designs for Japanese males (left) and females (right) ... 47
Figure 4.11 Top 10 kawaii spoon designs in general ranked by average scores of all participants ... 47
Figure 5.1 Overall procedure of model construction ... 53
Figure 5.2 Procedure of dataset preparation ... 54
Figure 5.3 (A) Original spoon design with “smiley” shape (B) Black pixels that represent the area of “smiley” shape (C) Black pixels that represent background area ... 55
Figure 5.4 Procedure of training a classifier using prepared dataset ... 57
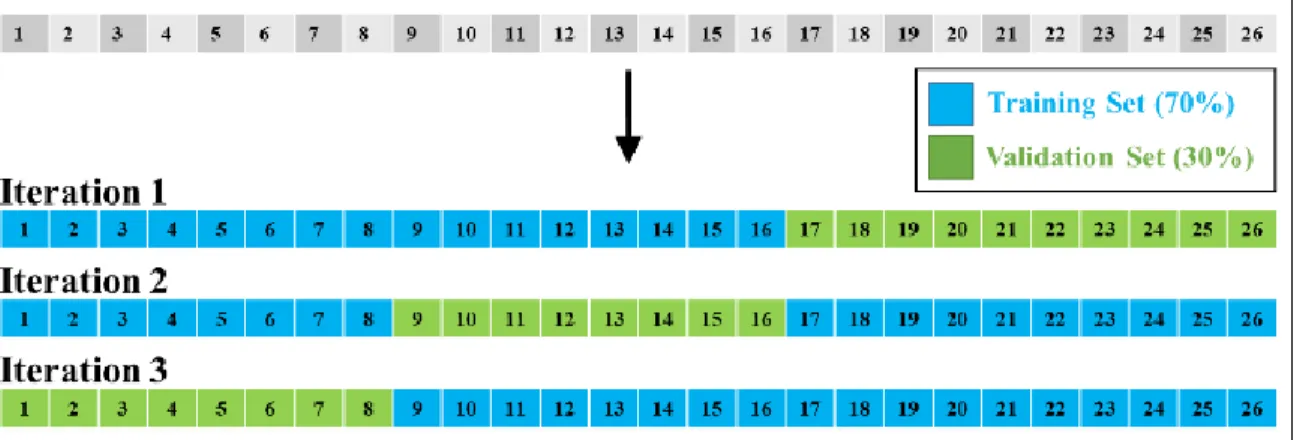
Figure 5.5 Training and validation sets for each iteration of 3-fold cross validation ... 57
Figure 5.6 Examples of more kawaii and less kawaii spoon designs for male participants59 Figure 6.1 Decision tree result ... 65
Figure 6.2 Spoon designs for evaluation ... 66
xiv
Figure 6.4 Screenshot of spoon comparison system displaying two spoon designs and
countdown timer ... 68
Figure 6.5 Experiment setup of spoon design comparison ... 69 Figure 6.6 Experiment scene of comparison of spoon designs during a record of eye tracking
... 69
Figure 6.7 Two AOIs with identical shape and size (red brackets) showing areas included in
the analysis of eye movement data in a pair of spoon designs ... 71
Figure 6.8 Total AOI durations of four spoon designs for 12 pairs of comparison ... 72 Figure 6.9 Total number of fixations (times) of four spoon designs for 12 pairs of
comparison ... 73
Figure 7.1 Deep Convolutional Neural Network Architecture ... 80 Figure 7.2 Example of cosmetic bottle images ... 81 Figure 7.3 Example of a page in questionnaire system showing a cosmetic bottle image and
arrows used for evaluation ... 82
Figure 7.4 Steps to prepare training and testing sets ... 86 Figure 7.5 Confusion matrix ... 89 Figure 7.6 Method to calculate difference of kawaii probabilities between cosmetic bottle
images with/without caps ... 93
Figure 7.7 Mean difference of kawaii probabilities among cosmetic bottle images grouped
by objects on the bottle caps for Thai participants ... 94
Figure 7.8 Mean difference of kawaii probabilities among cosmetic bottle images grouped
by objects on the bottle caps for Japanese participants ... 95
Figure 7.9 Screenshot of comparison system displaying two cosmetic bottle images and
countdown timer ... 102
Figure 7.10 The most kawaii cosmetic bottle images based on average scores divided by
hues ... 105
Figure 7.11 The least kawaii cosmetic bottle images based on average scores divided by
hues ... 105
Figure 7.12 Average scores between flower and ribbon as “cap” attribute divided by hues
... 108
Figure 7.13 Average scores between round and square as “shape” attribute divided by hues
... 108
Figure 7.14 Average scores between three levels of “lightness/saturation” attribute divided
by hues ... 108
Figure 7.15 Example of AOIs of two cosmetic bottle images with sizes corresponding to
round and square shapes showing areas included in analysis of eye tracking data ... 110
xv
Figure 7.17 Total number of fixations vs. group of “cap” attribute divided by hue ... 112 Figure 7.18 Total number of fixations vs. group of “cap” attribute divided by hue ... 112 Figure 7.19 Number of matchings between last-eye-position and selected images ... 113 Figure 7.20 Correlation analysis result between the average scores and kawaii probabilities
xvi
List of Tables
Table 2.1 Summary of “kawaii rules” proposed by [15] ... 10
Table 3.1 Number of participants with/without eye tracking data divided by participant groups ... 21
Table 3.2 Rankings based on kawaii scores, which are cumulative values as total number of selections ... 22
Table 3.3 Ranking based on illustrations selected as more kawaii ... 22
Table 3.4 Ranking based on illustrations selected as favorites ... 23
Table 3.5 Structure information of six illustrations ... 30
Table 4.1 Comparison results between participant groups by Spearman’s rank-order correlation ... 48
Table 5.1 List of attributes defined by manual observation method ... 54
Table 5.2 List of attributes defined by image processing method... 55
Table 5.3 Classification accuracy of 3-fold cross validation divided by participant groups ... 58
Table 5.4 Important attributes of the 3 iterations for male participants ... 59
Table 5.5 Values of important attributes for high and low rank groups for male participants ... 60
Table 5.6 Important attributes of the 3 iterations for female participants ... 60
xvii
Table 6.1 Candidates of spoon designs and their corresponding physical attributes and
average ranks ... 66
Table 6.2 Spoon designs and their kawaii scores ... 70
Table 6.3 Sum of total AOI duration of four spoon designs for the first half of comparison ... 72
Table 6.4 Sum of total number of fixations of four spoon designs for the first half of comparison ... 73
Table 6.5 Spoon designs ordered/grouped by kawaii scores, attribute and eye movement indexes ... 74
Table 7.1 Evaluation Results of Cosmetic Bottle Images of Thai Participants ... 83
Table 7.2 Evaluation Results of Cosmetic Bottle Images of Japanese Participants... 84
Table 7.3 Result of performance test among five kinds of CNN algorithms ... 87
Table 7.4 Classification Results of All Models of Thai Participants ... 89
Table 7.5 Classification Results of All Models of Japanese Participants ... 90
Table 7.6 Cosmetic Bottle Images Grouped by Objects on Bottle Caps for Thai Participants ... 92
Table 7.7 Cosmetic Bottle Images Grouped by Objects on Bottle Caps for Japanese Participants ... 93
Table 7.8 Cosmetic bottle images used as candidates of cap ornamentation ... 97
Table 7.9 Two bottle shapes of each hue ... 98
Table 7.10 Three levels of lightness/saturation of each hue ... 99
Table 7.11 All modified cosmetic bottle images ... 100
Table 7.12 Combination of compare pairs of cosmetic bottle images divided by hues .... 101
Table 7.13 Average scores of all cosmetic bottle images divided by hues ... 104
Table 7.14 Results of 3-factor ANOVA for monochrome images ... 106
Table 7.15 Results of 3-factor ANOVA for blue images ... 106
Table 7.16 Results of 3-factor ANOVA for pink images ... 107
Table 7.17 Correlation analysis for monochrome images ... 114
Table 7.18 Correlation analysis for blue images ... 115
xviii
Abbreviations
ANN = Artificial neural network AOI = Area of interest
CNN = Convolutional neural network EEG = Electroencephalography EMG = Electromyography
METI = Ministry of Economy, Trade and Industry
MS = Millisecond
Chapter 1
Introduction
1.1 Motivation
For more than twenty years, Kansei engineering, which is a consumer-oriented methodology, has been recognized as an important part in a broad range of Japanese manufacturing. It is defined as “a kind of technology that translates the customer’s feeling (kansei) into design specifications” [1]. By making products to which kansei values are added, products can provide greater emotional fulfilment and make a larger impact on first impressions, which is a key to motivate consumer purchases [2].
of kansei values that have been widely applied to products are enjoyment, coolness, and user friendliness. Kawaii or Kawaiiness is also considered as one kansei value that denotes such positive connotations as cute, lovable, and charming and plays an important role in the worldwide success of many products, such as Hello Kitty [4] and Pokémon [5]. Based on this success, I believe that kawaii will be a key factor for future product design and development.
Based on kansei engineering approach, the products should be designed based on the customer’s feeling [1]. Therefore, this research focuses on study of kawaii feelings together with product attributes which cause the feelings. Generally, “kawaii” is an adjective related to physical characteristics or attributes of the products. However, the human emotion on perceiving kawaiiness from the products is also focused, which is called as “kawaii feeling” in this research. The importance of product design focusing on emotional aspect is not limited to only kawaii feelings, but also various other products and other feelings as described in the following examples.
Design of children’s wheelchair that is fun or has a positive emotional impact [6]
Design of ladies’ shoes based on comfort [7]
Design of car interior to understand the characteristics of styling for a desired impression [8].
revealed that it is effective to recognize human emotional states. However, it has not been scrutinized yet to study kawaii feelings. Therefore, it should be employed in kawaii-related research to clarify the eye movement indexes related to kawaii feelings.
Researches have explored kawaii attributes for designing kawaii products such as shape, size, color, texture, and tactile sensation [15]. They systematically analyzed kawaii attributes, which is a bottom-up approach that the attributes must be specified from the first. This approach is considerably difficult to employ for many kawaii products since they usually contained various attributes. Instead, kansei modeling, which is top-down approach, has been proposed. In many kansei-related researches, they proposed kansei models and used the models to evaluate the user’s feelings. Therefore, the model of kawaii feelings should also be proposed and used to evaluate kawaii products as well.
1.2 Problem Statement
Based on the motivation, there are several problems. I discussed them and the proposed solution as follows:
1. Clarification of relationship between kawaii feelings and eye movement indexes Even though eye tracking has been successfully employed in many researches, only few researches employed it to study kawaii feelings. In addition, there were no researches that clarify relationship between kawaii feelings and eye movement indexes. Therefore, it remains unclear about their relationship. In addition, the eye movement indexes that can be used to evaluate kawaii feelings are still unknown. Therefore, eye tracking should be employed to study kawaii feelings in order to clarify their relationship and propose effective eye movement indexes, which can confirm the effectiveness of using eye tracking to evaluate kawaii feelings.
2. Construction of Model of Kawaii Feelings
the model for a specific product is needed to be clarified. Then, method for model construction as well as the possibility to employ the same method for other products should be clarified.
3. Clarification of effective attributes to design kawaii products
Even though the model of kawaii feelings can be constructed, the effective attributes to design kawaii products cannot be clarified yet. Since clarifying the effective attributes is very important step to provide suggestion to design kawaii products, it is necessary to explore the method to obtain the effective attributes from the model. From the solution of the first problem statement, eye movement indexes related to kawaii feelings should be clarified. Then, they can be employed to clarify the relationship with attributes in order to propose effective ones to design kawaii products.
1.3 Research Questions
Based on the problem statement, several issues related to the clarification of the effectiveness of using eye tracking to evaluate kawaii feelings and the construction of model of kawaii feelings must be solved.
1. Is there a relationship between kawaii feelings and eye movement indexes? If so, which eye movement indexes can be used to clarify their relationship?
2. Are there any possibilities to construct model of kawaii feelings? If so, what kind of products and methods are appropriate to employ for model construction? 3. Which method can be used to evaluate the candidates of effective attributes from
the constructed model? Also, how to clarify effective ones to design kawaii products?
1.4 Research Goals and Contribution
According to the problem statements and research questions, eye tracking should be taken into account to study kawaii feelings. The research goals and contribution are described below.
and also identifying new eye movement indexes related to kawaii feelings
2. Constructing models of kawaii feelings and clarifying appropriate products and methods for model construction
3. Clarifying effective attributes to design kawaii products using the constructed model and eye movement indexes
1.5 Organization of Thesis
This thesis consists of nine chapters including this one, which are organized as illustrated in Figure 1.1.
Chapter 2 presents related works on kansei engineering and kawaii-related researches. Chapter 3 presents a clarification of relationship between kawaii feelings and eye movement indexes which are later employed in Chapter 6 and the last section of Chapter 7. Chapters 4, 5 and 6 present studies on spoon designs. Chapter 4 presents an evaluation of spoon designs based on kawaiiness, which is a step to collect data for model construction in Chapter 5. Next, Chapter 5 presents a construction of model of kawaii feelings for spoon designs by Support Vector Machine (SVM) algorithm, which suggested candidates of effective attributes to design kawaii spoons. Finally, Chapter 6 presents a clarification of effective attributes of kawaii spoon designs using eye movements. This chapter employed eye tracking indexes obtained from Chapter 3 to evaluate spoon designs and their attributes obtained from Chapters 4 and 5.
Chapter 7 presents a study on cosmetic bottles. This chapter is divided into four sections. First, Section 7.2 presents an evaluation of cosmetic bottles based on kawaiiness, which is a step to collect data for model construction in Section 7.3. Next, Section 7.3 presents a construction of model of kawaii feelings for cosmetic bottles using the Deep Convolutional Neural Network (CNN) algorithm. Then, Section 7.4 presents an evaluation of attributes for cosmetic bottles using the constructed model. Finally, Section 7.5 presents a clarification of effective attributes of kawaii cosmetic bottles using eye movement indexes obtained from Chapter 3.
Chapter 8 presents a discussion of this thesis, especially the method to solve the problems and achieve the research goals. Also, this chapter discusses its news findings.
Chapter 2
Related Works
2.1 Kansei Engineering
In addition, there are similar researches in a field close to kansei engineering. Picard started a branch of affective computing which firstly focused on the interaction between machine and emotional state of humans [18]. Fukuda et al. have conducted researches in a field of emotional engineering which focuses on user-centric design proposing that emotion and individual human needs become more important [19]. Even though these researches used different terms, e.g. kansei, affect, and emotion, all of them indicate the importance to consider kansei as important factor in the design of products and systems.
Figure 2.1 illustrates a structure of kansei engineering. As proposed in [1], such physiological signals as eye movements, Electroencephalography (EEG), Electromyography (EMG), are important to measure kansei and achieve kansei product design. Only one or the combination of them can be used for the measurement. However, it is necessary to firstly confirm that it can successfully reach the customer’s kansei.
Figure 2.1 Structure of kansei engineering [1]
2.2 Kansei Value
kansei value as a new value axis, becoming the fourth most critical characteristic of industrial products after function, credibility, and cost [3] (Figure 2.2). When added to ordinary products, kansei values can increase their economic worth. By making products to which kansei values are included, products can provide greater emotional fulfillment and make a larger impact on first impressions, which is a key to motivate consumer purchases [2].
Figure 2.2 Characteristic of industrial products in which kansei value is proposed as new
value axis
Examples of kansei values that have been widely applied to products are enjoyment, coolness, and user friendliness. Kawaii (or Kawaiiness) is also considered as one kansei value that plays an important role in worldwide success of many products [21]. Based on their success, kawaii is taken into account as a key factor for future product design and development.
2.3 Kawaii
emotional response to infantile, baby-like, delicate, and heart-warming characteristics [23], [24], [25].
Researches have explored various attributes for designing kawaii products such as shape, color, size, texture, and tactile sensation [15] (Figure 2.3) Table 2.1 summarizes the “kawaii rules” proposed by [15], which suggested attributes for kawaii product design.
Researches [26], [27], [28] emphasize the importance of visual appearance of consumer’s choice of products that the decisions are often made based on the aesthetics when the candidates of product are similar in functions. Therefore, focusing on visual appearance for product design is considered important to increase its kansei value. The visual appearance can be defined as product properties or attributes, which include size, shape, color, texture, material, glossiness, transparency, and so on [28], [29].
Figure 2.3 Examples of attributes to design kawaii products [15]
Table 2.1 Summary of “kawaii rules” proposed by [15]
Attribute Value of Attribute
Kawaii Non-kawaii
Shape Curved (e.g. sphere, torus, circle) Straight-lined
Color Warmer Colder
Brightness Higher Lower
Saturation Higher Lower
In recent kawaii-related researches, they did not focus only on the attributes, but also the overall impression of kawaii products. Research [30] proposed to design kawaii spoons for the elderly to help increase their appetite. Research [31] clarified that kawaii things narrow an attentional focus, which will be useful to improve careful behavior in many situations such as driving and office work. Research [32] proposed various factors that influenced the cuteness perception such as facial expression, posture, body shape, clothing, eye roundedness, etc.
2.4 Kansei Measurement
In kansei-related researches, many measurement methods have been employed to measure kansei. Such subjective evaluation methods as questionnaires are commonly used for the measurement because it has many advantages. However, human’s emotional states are implicit and usually expressed unpredictably, which are difficult to evaluate just by using subjective evaluation methods [9]. To solve those difficulties, many researches employed such objective evaluation methods as measuring physiological signals [10], which can provide quantitative output and usually be able to catch unconscious and immediate human’s responses [11].
As mentioned above, various physiological signals were effectively used for emotion recognition. However, this research focuses only on eye tracking according to its various advantages over other physiological signals as follows:
Can dynamically capture user’s attention more directly than other biological signals, which is useful especially for product design [42].
Requires quick set-up and no complicated hardware configuration [43].
Has affordable price and portability, making it a practical device for future research in product design [44].
Eye tracking has been widely and successfully used in various research fields including cognitive and experimental psychology, human-computer interaction, and product development, which revealed that it can effectively recognize emotional states and implicit needs of human.
Several researches employed eye tracking for emotion recognition, in which various eye movement indexes were effectively used. Some examples are described as follows:
Studies on behaviors influenced by emotional pictures revealed that longer gaze duration and larger pupil size were induced by emotional or interesting pictures [45] and [46].
Children’s preferential attention to various baby schema images were induced cuteness perception and gaze allocation [47].
In decision-making tasks, the first and last fixations were more likely to be made toward the chosen alternatives [48].
Person’s interest level and the focus of attention were drawn by eye position tracking and such indirect measures as number of fixations and fixation duration [42].
User interaction and eye gaze behavior were analyzed within different contexts such as advertising, websites, television news, and video games, by measuring fixations and saccades [49].
directly capture user’s attention [42], is useful for the detailed analysis of the design of product features as described in the following examples.
Evaluation the design of wristwatches [50] analyzed fixation duration, saccades, and scan paths to determine parts of product that attract user attention and evoke positive emotions.
Design evaluation of mobile phones revealed possible relationship between people's gazes and preferences in the designs by analyzing average number of fixations [51].
Perception evaluation analysis of beer bottles with eye tracking revealed attentional focus on the product by using total fixation duration and gaze patterns, and proposed that fixations are the most commonly used parameter when assessing consumer’s attention [52].
Visual cognitive features on the design of car utilizing the front appearance was studied to analyze the main area of interest of consumers [53].
Investigation of relationship between the product elements to design fuel tanker was performed by employing fixation duration, fixation transition rate, and number of fixation [54].
Evaluation of eye movement patterns on Yellow Pages advertising revealed that such features as color and font boldness caused people to notice an ad [55].
Analysis of drug labels using eye tracking revealed that text positioning, clear background, and consistent font caused lower information processing demands [56].
calculation [59]. Finally, it can be an important assistive technology for people with disabilities that it can help people to use their eye movements instead of hand or other movements in controlling tasks [60].
Chapter 3
Clarification of Relationship between
Kawaii Feelings and Eye Movements
3.1 Background
of the display. The result clarified the differences between favorite and most kawaii illustrations as well as the differences in preferences between genders. However, the accuracy of the eye tracking result from a calibration-free eye tracking device was insufficient to scrutinize and clarify the relationship between kawaii feelings and eye movement indexes. Also, the six illustrations were shown simultaneously, which complicated the eye movements (Figure 3.1).
Figure 3.1 Eye movements recorded during an evaluation of six kawaii illustrations
Even though the research [61] did not clarify the relationship between kawaii feelings and eye movement indexes, the results suggested the possibility of using eye tracking as a method to evaluate kawaii feelings. Therefore, I continued to use eye tracking for this research to clarify its effectiveness for evaluating kawaii feelings.
3.2 Experiment Method
3.2.1 Visual Stimuli
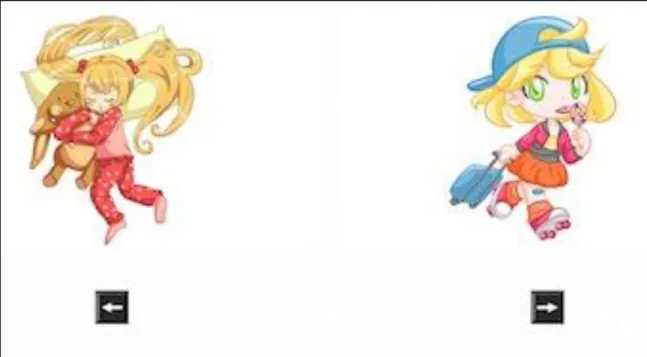
Since the word “kawaii” is often used to describe girls or characters, the previous research [61] used girl illustrations in their experiment, which are usually easiest to understand by every genders and generations. In addition, the illustrations had certain differences, which were appropriate stimuli for eye tracking analysis. Therefore, I used the same six kawaii illustrations as visual stimuli (No.1 to No.6) (Figure 3.2), which were originally drawings to eliminate potential preference bias from famous cartoon characters. Sharp sign (#) with number denotes illustration number that represents six illustrations, #1, #2, #3, #4, #,5, and #6, as shown above each illustration.
Figure 3.2 Original kawaii illustrations
3.2.2 Comparison System
I designed a comparison system to solve the problem of previous experiment [61] as follows. 1. The illustrations were displayed in pairs at a time randomly selected from the six. 2. The illustrations were enlarged to show their details more clearly.
The comparison system was modified from a system that evaluated kawaii ribbons [63]. The illustrations were displayed in pairs with left-right counterbalanced. The total number of compared pairs was 30 times. All of the system content was described in Japanese. The structure of the system is described as follows:
1. Top page: questionnaire explanation 2. Selection of participant’s gender and age
3. Explanation of illustration selections: the illustrations were displayed in pairs for five seconds. Selection of more kawaii illustrations was performed using the keyboard’s left or right arrow keys.
4. Illustration selection: 30 pairs were randomly displayed for each participant. An example of this page’s screenshot is shown in Figure 3.3.
5. Questionnaire: three subjective questions were asked: reason for selecting the illustrations (free description), most kawaii illustration, and favorite illustration. 6. After the participants submitted their questionnaires, the results of the illustration
selections and the questionnaires were saved in a database.
Figure 3.3 Example of page in comparison system showing two illustrations and selection
3.2.3 Experimental Setup
Figure 3.4 shows the experimental setup. The comparison system was accessed from the eye tracking system through a web browser, i.e., Google Chrome, whose system ran on a separate PC due to limited resources. The eye tracking system employed the EyeTech TM3 non-intrusive eye tracker (EyeTech Digital Systems, Inc.) (Figure 3.5) and QG-PLUS software (DITECT Co., Ltd.) to record the eye movements and display the eye tracking data. I used a 19-inch LCD monitor with resolution of 1280 x 1024 pixels. The experiment scene is shown in Figure 3.6.
Figure 3.4 Experimental setup where participant looks at illustrations on PC monitor while
eye tracking system records his eye movements
Figure 3.6 Experiment scene
3.2.4 Experimental Procedure
The following are the experimental procedures: 1. Participants sit on chairs in front of the PC. 2. They read the explanation sheet.
3. Experimenter calibrates the eyes of the participants.
4. Experimenter shows the comparison system and starts recording the eye tracking. 5. They answer their general information: gender and age.
6. They select from 30 pairs of illustrations.
7. They answer the questionnaires on three questions as follows:
Which is the most kawaii illustration?
Which is the favorite illustration?
3.3 Experimental Results
3.3.1 Participants
As shown in Table 3.1, the experiment was performed with 38 Japanese volunteers: 14 males in their 20’s, 10 females in their 20’s, and 14 females over 65 years old. However, only 21 bits of eye tracking data (7 males in their 20’s, 8 females in their 20’s, and 6 females over 65 years old) were successfully collected. The other 17 participants without eye tracking data were not included in eye tracking analysis due to two reasons: (1) ceiling light and sunlight affected to eye tracking device which failed to calibrate or track eye movements, and (2) some participants used a mouse instead of a keyboard during the selection of illustrations which might cause slower eye movements and increase cognitive workload for the hand-eye interactions.
Table 3.1 Number of participants with/without eye tracking data divided by participant groups
Participant Group Number of Participants
With Eye Tracking Data Without Eye Tracking Data
Male 20’s 7 7
Female 20’s 8 2
Female over 65 6 8
Total 21 17
3.3.2 Cumulative Results
Table 3.2 Rankings based on kawaii scores, which are cumulative values as total number
of selections. Sharp sign (#) with number denotes illustration number. Number inside parentheses () show data used for ranking kawaii scores.
Participant Group Ranking of illustration: kawaii scores
1st 2nd 3rd 4th 5th 6th Male 20’s (90) #3 (79) #2 (73) #4 (63) #6 (59) #5 (56) #1 Female 20’s #2 (69) #4 (60) #1 (51) #3,#6 (41) #5 (38) Female over 65 #1 (99) #3 (77) #6 (69) #2 (67) #4 (63) #5 (45)
3.3.3 Questionnaire Results
The questionnaire results consist of three items:
1. Number of illustrations selected as the more kawaii 2. Number of illustrations selected as favorites
3. Reasons for selecting more/favorite illustrations (free description)
The results of questionnaire items 1 and 2 were used to rank the illustrations, as shown in Table 3.3 and Table 3.4. The ranking results showed that the first and last rankings of Table 3.2 and Table 3.3 are similar. Furthermore, the first rankings for all of the participant groups of Table 3.4 were the same, which shows that all three participant groups preferred illustration #4.
Table 3.3 Ranking based on illustrations selected as more kawaii. Details are identical as
described in Table 3.2, where data used for ranking are “number of illustrations selected the most kawaii” from questionnaire item 1.
Participant Group Ranking of illustration: kawaii scores
1st 2nd 3rd 4th 5th 6th
Male 20’s #3,#4 (4) (3) #6 (2) #2 (1) #5 (0) #1
Female 20’s (4) #2 #3,#6 (2) #4,#5 (1) (0) #1
Table 3.4 Ranking based on illustrations selected as favorites. Details are identical as
described in Table 3.2, where data used for ranking are “number of illustrations selected as favorites” from questionnaire item 2.
Participant Group Ranking of illustration: kawaii scores
1st 2nd 3rd 4th 5th 6th Male 20’s (5) #4 (3) #3 #2,#5,#6 (2) (0) #1 Female 20’s #4 (5) #2 (4) #6 (1) #1,#3,#5 (0) Female over 65 #4 (6) #3 (3) #1,#2 (2) #6 (1) #5 (0) The participants also described why they selected the illustrations in questionnaire item 3. I summarized the results based on the number of times that they mentioned each area in the illustrations as follows:
Most participants selected the illustrations based on eye size, face shape, and hairstyle.
Other selection reasons mentioned the total atmosphere, colors, gestures, costumes, facial expressions, and the baby-like deformed shape of the illustrations.
3.3.4 Results of Eye Tracking Data
Based on the rankings of the cumulative results, I recalculated and ranked only data from the 21 participants whose eye tracking data were successfully recorded.
Figure 3.7 Example of AOIs of two illustrations with identical shape and size showing
areas included in analysis of eye tracking data
I analyzed the eye tracking data by employing six eye movement indexes, all of which I describe in the following sections.
3.3.4.1 Total AOI duration (sum of durations of all eye positions inside AOI)
Figure 3.8 Total AOI duration vs. illustration groups of females in their 20’s where highest
kawaii refers to illustrations with highest kawaii scores, lowest kawaii refers to illustration with lowest kawaii scores, selected kawaii refers to illustrations selected as most kawaii,
and selected prefer refers to illustrations chosen as favorites, of each participant
3.3.4.2 Total number of fixations (sum of all fixations inside AOI)
I analyzed the total number of fixations with two factors: participant and illustration groups. I performed a statistical analysis with the same method as that for the total AOI duration. The result of all participants from the paired t-tests showed a significant difference in the total number of fixations between the highest and lowest kawaii scores (p<0.05) and between the most selected kawaii and lowest kawaii score (p<0.05) (Figure 3.9).
Figure 3.9 Total number of fixations vs. illustration groups of all participants (details are
identical as described in Figure 3.8)
Figure 3.10 Total number of fixations vs. illustration groups and participant groups of
females in their 20’s (details are identical as described in Figure 3.8)
3.3.4.3 Number of transitions between AOIs (sum of times that the eyes moved between AOIs for each pair of illustrations)
I counted the eye movement from one position in an AOI to another position in another AOI as a transition. For example shown in Figure 3.11, the number of transitions is 3 times as the eye positions move for 3 times between left and right AOIs.
I analyzed the number of transitions between the two AOIs for all participants and each participant group. Since I considered the illustrations pair by pair, the difference of kawaii scores between each pair was calculated from the cumulative and questionnaire results that I used to analyze this eye tracking metric. A Pearson product-moment correlation determined the relationship between the number of transitions and the differences of the kawaii scores. A scatter plot between these two variables (Figure 3.12) shows a linear relationship with a negative correlation. The result shows a statistically significant (R2 =-0.125, p<0.01) negative correlation between the number of transitions and the differences of kawaii scores.
Figure 3.12 Number of transitions between AOIs and differences of kawaii scores of all
participants where red line shows negative linear relationship between these two variables I also analyzed the number of transitions between AOIs for each participant group. The results showed similar tendencies as the result of all participants for both males in their 20’s and females 65 or older. There were negative correlations between the number of transitions and the differences of kawaii scores with a statistical significance for males in their 20’s (p<0.05) and females 65 or older (p<0.1). The result of the females in their 20’s did not show a statistical difference for the correlation. However, it did have a similar tendency as in the other participant groups, where a negative linear relationship existed between the number of transitions and the differences of the kawaii scores.
0 1 2 3 4 5 6 7 8 9 10 0 1 2 3 4 5 6 7 8 9 10 Num b er of T ran sition s (t im es)
Difference of kawaii scores
3.3.4.4 Number of matchings between last-eye-position illustrations and selected illustrations
I collected and analyzed the matched and unmatched numbers for each pair of illustrations between the last-eye-position illustrations and the selected illustration from the cumulative and questionnaire results (Figure 3.13). Paired t-tests determined whether a statistically significant mean difference existed between the number of matched and unmatched selections for each participant group. The result from each participant group showed a significant difference in the number of matchings between the last-eye-position and the selected illustrations (p<0.01) (Figure 3.14).
Figure 3.13 Example of method to calculate number of matchings between
last-eye-position illustrations and selected illustrations
Figure 3.14 Number of matchings between last-eye-position and selected illustration of
3.3.4.5 Total duration of decision (time from occurrence of pair of illustrations to selection by arrow keys)
I compared the total duration to identify the differences of the kawaii scores for each participant group. A Pearson product-moment correlation determined the relationship between these two variables. A scatter plot for the female participants in their 20’s (Figure 3.15) shows a statistically significant (R2 = -0.206, p<0.05) linear relationship with a negative correlation between the total duration of decision and the differences of the kawaii scores for females in their 20’s. The results for males in their 20’s and females 65 or older did not show a statistical difference for the correlation.
Figure 3.15 Total duration of decision and difference of kawaii scores for females in their
20’s where red line shows negative linear relationship between these two variables
3.3.4.6 Number of initial eye positions on each focused area (sum of eye positions that were first inside each focused area in AOI)
To collect the number of initial eye positions, I defined the focused areas that participants tended to look on their first glance. Since all of the illustrations were composed of human structure, I categorized the focused areas into three groups: head, body, and others (Figure 3.16). 0 1000 2000 3000 4000 5000 6000 0 1 2 3 4 5 6 7 8 9 10 11 12 T otal d u ration of d ec isi on (m s)
Difference of kawaii scores
I measured and calculated the head-to-body ratios for all the illustrations using head and body heights (Figure 3.17). I also listed the objects for other areas that included the objects that surrounded the head and body. The structure information of the six illustrations is shown in Table 3.5. The head-to-body ratio showed the varieties of head and body sizes. Moreover, there were various objects in the other areas for all six illustrations.
Figure 3.16 Example of illustration divided into three focused areas (head, body, and other
areas)
Figure 3.17 Example of illustration showing method to measure head and body heights Table 3.5 Structure information of six illustrations
Illustration No. Head Height (pixels) Body Height (pixels) Head-to-body Ratio Surrounding objects 1 155 187 0.829 Stars 2 74 209 0.354 Wings, bird 3 88 207 0.425 Bear, pillow
4 105 244 0.430 Tea pot, tea cup
5 119 199 0.598 Rope
I analyzed the number of initial eye positions using a two-factor ANOVA between the focused areas and the participant groups for each illustration. The result showed significant differences (p<0.01) among the focused areas for all the illustrations. I performed a low-level analysis using the percentage of the number of first eye positions shown in Figure 3.18. The head area tended to have the highest percentage of initial eye positions. In addition, the graph showed a tendency between genders where the numbers of first eye positions on body areas were larger in the female participants than in the male participants.
Figure 3.18 Percentage of first fixations for all participant and illustration groups. Each
bar graph shows percentage of first fixations among head, body, and other areas of each illustration.
3.4 Discussion
The eye tracking analysis included six eye tracking indexes and the following results:
Total AOI duration of females in their 20’s showed significant differences
between the illustrations with the highest and lowest kawaii scores. They tended to look longer at the kawaii illustrations, while the two other participant groups showed average attention to all the illustration groups.
Total number of fixations of all participants showed significant differences
between the illustrations with the highest kawaii scores and the selected kawaii illustrations versus illustrations with the lowest kawaii scores. The illustrations with the highest kawaii scores and the selected kawaii illustrations had more fixations.
Total number of fixations of females in their 20’s showed significant differences
between selected kawaii illustrations and the illustrations with the lowest kawaii scores, and between their selected favorite illustrations and the illustrations with the lowest kawaii scores. They tended to look more frequently at their more kawaii selections and favorite illustrations.
Number of transitions between AOIs versus the differences of kawaii scores
had a significantly negative correlation for all participants, males in their 20’s, and females 65 or older. For females in their 20’s, the result also showed negative tendencies that resembles the other two participant groups.
Number of matchings between the last-eye-position illustrations and the selected illustration showed a significant difference for the three participant
groups. The larger number of matchings showed that the participants tended to take one final look at the illustrations they selected.
Total duration of decision versus the differences of the kawaii scores had a
significantly negative correlation for females in their 20’s, who tended to take a longer time to decide if the kawaiiness of the pairs of illustrations were similar.
Number of first fixations for each focused area showed a significant difference.
looked more at the head areas than the other areas. Even though the head might be large or small, it attracted the most initial attention, showing that the participants looked first at the heads regardless of their sizes. The result of participants who looked first at the head area most corresponds to the result of question (3) where the participants selected illustrations based on eye size, face shape, and hairstyle. In another tendency, the females also first looked at the body and other areas in addition to the head than males, suggesting interest in other areas in addition to the head. These results show that there is possibility to clarify kawaii parts by defining AOIs to various parts and analyzing this eye movement index. From our analyzed results, females in their 20’s tended to look longer and more frequently at more kawaii illustrations, suggesting that they have the strongest interest in kawaii. All participants repeatedly compared the illustrations before selecting when the kawaiiness of two illustrations were similar. Finally, our results also revealed that females tend to judge kawaiiness based on the complete atmosphere while males focused on faces.
The correlation results of two eye movement indexes (number of transitions between AOIs and total duration of decision) were too weak to conclude the relationship between these eye movement indexes and kawaii feelings. However, these indexes were still candidates to measure kawaii feelings. If number of participants is increased, there is possibility that the result is more significant.
As a result, I clarified the relationship between kawaii feelings and eye movement indexes and identified two new indexes: (1) number of transitions between AOIs and (2) number of matchings between last-eye-position illustrations and selected illustrations. In addition, there is possibility that other indexes can be identified by using other analysis methods. For example, if eye movements are classified into longer or shorter fixation duration, then the relationship between classification result and kawaii scores can be analyzed.
During this experiment, I faced some problems that might complicate collecting and analyzing eye tracking data. The problems will be used to improve the comparison system and experimental setup in further study.
Identical illustrations were displayed at the same position during two consecutive pairs.
The participants did not have default eye position before they started evaluating the illustrations.
Some participants used a mouse instead of a keyboard during the selection of illustrations which might cause slower eye movements and increase cognitive workload for the hand-eye interactions.
Ceiling light and sunlight affected to devices which failed to calibrate or track eye movements.
3.5 Conclusion
This chapter presents my study of kawaii feelings using eye tracking. I experimentally used a comparison system with an eye tracking system and used the cumulative results, the questionnaire results, and the recorded eye tracking data for analysis. I clarified the relationship between kawaii feelings and eye movement indexes.
Females in their 20’s tended to look longer and more frequently at more kawaii and their favorite illustrations. All participants tended to take longer to compare pairs whose kawaiiness was similar. The participants all tended to take one last look at the illustration they selected. Finally, all participants tended to focus on the head area when they first looked at the illustrations.
Chapter 4
Evaluation of Spoon Designs based on
Kawaiiness between Genders and
Nationalities
4.1 Background
Thailand is one country that has been strongly influenced by kawaii culture for several years. Research [67] pointed out that Thailand has been strongly influenced by kawaii culture by demonstrating that kawaii is expressed through various forms of daily products such as clothing and cosmetics. These kawaii products have been embraced by Thai people, especially young females. Moreover, the word “kawaii” itself is transliterated and frequently used in daily conversation by both Thai males and females. However, various factors might impact the shifting of kawaii impressions away from the idea’s original connotations. Thus, it remains unclear whether the impressions of kawaii perceived by Thai people actually resemble those of Japanese people. Revealing the similarities and the differences between such impressions in Japan and Thailand will be useful for the design of future kawaii products that serve the desires of customers in both countries. Therefore, this research focused not only on the study of kawaii feelings but also its similarities and differences between Japanese and Thai people.
4.2 Preparation
4.2.1 Collection of Spoon Designs
Female students at Tokyo Woman’s Christian University participated in the design of kawaii spoons. I used a layout of spoon design provided by Aoyoshi Co., Ltd. [70], a manufacturer of household goods. This layout consists of top and side views (Figure 2.2). The participants were asked to design a kawaii spoon by drawing on the given layout. I collected 182 spoon designs.
4.2.2 Preparation of Spoon Designs
I prepared spoon designs to select the best examples for our experiment. In this step, I considered only the top-view spoon designs because some side-view spoon designs were difficult to draw which could misrepresent the actual intention of the designs. Also, based on the practicality of actually using the spoon, I only considered the designs of the handles.
I excluded 20 out of 182 spoon designs based on the following criteria:
Three designs with cartoon characters: This group of designs was excluded to eliminate potential preference bias caused by the cartoon characters.
17 designs with non-surfaced decorations: This group included designs with items that were placed over the spoon’s surface. They were excluded due to such practicality issues as difficulty in using or cleaning.
I divided the remaining 162 spoon designs into groups based on the appearances or the shapes of the objects on the designs, such as flowers, hearts, smileys, stars, cats, etc. I counted the number of designs of each group and selected spoon designs from the three shape groups with highest numbers of designs: the flower group (37 designs), the heart group (13 designs), and the smiley group (13 designs). I selected them as candidates for the experiment and excluded the other 99 designs.
4.3 Preliminary Experiment
I obtained 63 designs and divided them into three shape groups. However, the number of designs in the flower group was much larger than the other two groups. Therefore, I performed a preliminary experiment to reduce the number of flower designs.
4.3.1 Participants
4.3.2 Preliminary Experimental Procedure
I created a questionnaire using Google Form. The participants answered it online using their own PCs. The questionnaire started with an instruction part that described how to evaluate the spoon designs. Then it advanced to the question parts, which included 37 questions, each of which showed spoon design image, and asked “How kawaii is the spoon design?” (Figure 4.2). The participants rated the designs using 4-point rating scales: 0 (not at all), 1 (low), 2 (moderate), and 3 (high). After rating all 37 spoon designs, the participants clicked the “submit” button to save the questionnaire results in the system.
Figure 4.2 Screenshot of questionnaire in preliminary experiment
4.3.3 Preliminary Experimental Results
4.4 Experiment on Comparison of Spoon Designs
4.4.1 Candidates of Spoon Designs
From the previous steps, I obtained 39 spoon designs and divided them into three shape groups: 13 flower designs, 13 heart designs, and 13 smiley designs. However, since these designs were originally hand-drawn by students with different drawing ability, all 39 designs were graphically redrawn by a professional artist to remove any potential bias in different drawing quality that might affect the comparison results (Figure 4.3). Then I used them in the experiment.
4.4.2 Comparison System
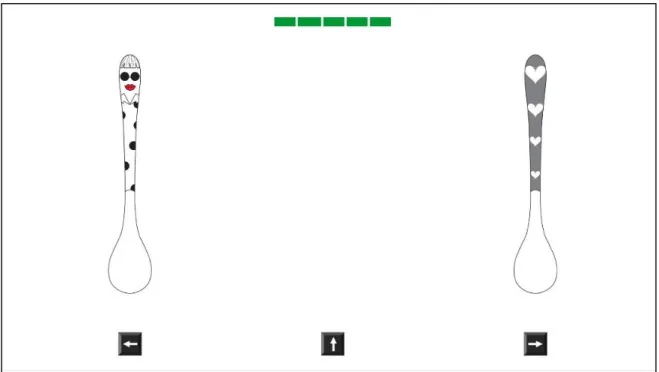
I modified a spoon comparison system from previous schemes that evaluated kawaii ribbons [63] and kawaii illustrations (Chapter 3). This system collected the comparison results of kawaii spoon designs. As visual stimuli, the system used 39 graphical spoon designs that were displayed in pairs on a PC monitor (Figure 4.4).
Figure 4.4 Screenshot of spoon comparison system displaying two spoon designs
The system’s structure is described as follows: 4. Top page: explanation of comparison method;
5. Consent form: brief explanation about the experiment and permission to use their data; 6. Selection of participant’s gender and nationality;
7. Instruction of method to answer the comparison result of spoon designs;
8. Spoon design comparison: pairs of spoon designs were displayed with a countdown timer for five seconds. Then the system asked participants to select from three comparison results (more, less, or equally kawaii) using the keyboard’s arrow keys.
The comparison method used in the system was a quicksort algorithm (Figure 4.5). Since the number of spoon designs for comparison was large, this method reduced the comparison number and duration, but all of the spoon designs could still be evaluated. The following steps explain our method:
1. A spoon design was randomly selected and shown on the left side as a pivot (P). 2. The other spoon design (Q) was selected and shown on the right side.
3. Participants compared a pair of spoon designs: P vs. Q.
4. Participants answered using the keyboard’s arrow key. Then Q was sorted into one of the following groups based on the answers:
5. If Q was deemed more kawaii than P, then it was sorted into the “more kawaii” group.
6. If Q was deemed less kawaii than P, then it was sorted into the “less kawaii” group.
7. If P and Q were deemed equally kawaii, then it was sorted into the “equally kawaii” group.
8. The system repeated Steps 2 to 4 until all the spoon designs were compared. 9. Spoon designs were divided into three groups: more kawaii (A), less kawaii (B),
and equally kawaii (C). Spoon designs in the “less kawaii” group were compared again through Steps 1 to 5, and then followed by those in the “more kawaii” groups. For spoon designs in the “equally kawaii” group, the system stopped the comparison.
Figure 4.5 Tree structure of quicksort-based comparison
4.4.3 Experimental Setup and Procedure
The comparison system was displayed on a web browser with a 13-inch monitor and resolution of 3200x1800 pixels. The following are the experimental procedures:
1. Participants sat on a chair in front of a PC.
2. The experimenter showed the spoon comparison system. 3. Participants read the explanation and instruction on the display.
4. Participants submitted a consent form and agreed to cooperate in the experiment. 5. Participants compared the pairs of spoon designs from those shown on the PC display. 6. Participants input their answers about the comparison results.
4.5 Experimental Results
4.5.1 Participants
4.5.2 Comparison Results
From the comparison results of each participant, I sorted all 39 spoon designs and ranked them using the method described below.
With the sorting result as a tree structure, the spoon designs in the bottom “more kawaii” group were ranked as the most kawaii or the 1st rank. The spoon designs in the bottom “less kawaii” group were ranked as the least kawaii. Two or more spoon designs in the “equally kawaii” group had the same rank.
From the rankings, I calculated the scores of all the spoon designs. The score of the 1st rank was 39. If the rank was worse, the score was lowered. I used the scores to analyze the comparisons of the spoon designs and to describe the analyzed results in the following sections. Example of the method to rank and score the spoon designs is shown in Figure 4.6.