after Separation by Adsorption of its Oxinate on Microcrystalline Naphthalene
journal or
publication title
福井大学工学部研究報告
volume 28
number 2
page range 197‑206
year 1980‑09
URL http://hdl.handle.net/10098/4393
MEMOIRS OF THE FACULTY OF ENGINEERING FUKUI UNIVERSITY
VOL.28 No.. 2 1980
Spectrophotometric Determination of Iron(III) after Separation by Adsorption of its Oxinate on Microcrystalline Naphthalene
Masatada SATAKE and Yukio MATSUMURA
*
(Received Jul. 31, 1980)
A spectrophotometric method for the determination of
iron(III) after adsorption of its oxinate onto microcrystalline naphthalene has been developed. A water-insoluble oxinate formed with iron(III) is quantitatively adsorbed from aqueous solution with microcrystalline naphthalene. This oxinate in naphthalene-dimethylformamide solution has three peaks at 378, 462 and 580 nm. The optimum pH range for the adsorption is 4.1-10.3. The Beer's law was obeyed over the range 5-95 ~g
iron(III) in dimethylformamide solution. The molar absorptivity
6 3
- 1 - 1of the chelate is .0 x 10 l'mol ·cm ,while the sensitivity is 0.0093 Mg·cm-l
for iron(III) for 0.001 absorbance. Ten replicate analysis of samples containing 50 Mg of iron(III) gave a mean absorbance of 0.535 with relative standard deviation of 0.75%. In the present experiments, the effect of variables such as pH, amounts of reagent and naphthalene, digestion and shaking time, aqueous volume and diverse ions have been examined. The method has been applied to the determination of iron(III) in
standard reference and environmental samples and the results compared with 1,10-phenanthroline method,
1 Introduction
Oxine(8-hydroxyquinoline) reacts with various metal ions to form water-insoluble stable chelates(oxinate), and these oxinates have been widely used for the spectrophotometric determination of metals using organic solvents such as chloroform or benzene as extractant.
"
Since 1969, a new method Analysis of metals by solid-liquid
"
separation after liqid-liquid extraction has been successfully applied by authors using molten organic compound with appropriate degree of melting point(namely, solidified at room temperature and liquefied on a water bath) as extractant, e.g., naphthalene(m.p. :
*
Division of Applied Science197
80.5°C), biphenyl(m.p. : 70.5°C), etc. The method is based on the formation of metal chelate, the extraction of the chelate into molten naphthalene, the dissolution of the extract in a suitable organic solvent, and then absorbance measurement of the solution. Further- more, a new method of analysis of metals involving adsorption of metal chelates onto microcrystalline naphthalene, and their
subsequent spectrophotometric determinations has been developed by authors and demonstrated for palladium and nickel with a-furildioxime and copper with Ammonium Pyrrolidinedithiocarbamate. The present communication describes the optimum conditions for an improved procedure for the adsorption of iron(III)-oxinate onto micro- crystalline naphthalene at room temperature(-25°C) and subsequent determination of this metal. This method was applied to the deter- mination of trace amounts of iron(III) in the standard reference, metallic aluminum and river water.
2 Experimental method 2.1 Reagents
Standard iron(III) solution, 10 ppm. Prepared by diluting 10 ml of standard iron solution(lOOO ppm, Wako PUre Chemical Industries, Osaka, Japan) to 1000 ml with distilled water.
Oxine solution, 1%. Prepared by dissolving 1 g of oxine in 2ml of glacial acetic acid on a water bath, and diluting to 100 ml with water.
Naphthalene solution, 20%. Prepared by dissolving 20 g of naphthalene in acetone and diluting to 100 mI.
Buffer solutions. Prepared by mixing 1M acetic acid and 1M ammonium acetate solution for pH
3-6;
1M aqueous ammonia and 1M ammonium acettate solution for pH 8-11.Naphthalene, acetone, dimethylformamide and all other reagents were of analytical reagent grade, and were used without further purification.
L.2 Apparatus
A Hitachi Model 200-20 double beam spectrophotometer was used for the absorbance measurements.
All pH measurements were done with a Toa Dempa, HM-5A pH meter~
equipped with a combination calomel and glass electrode assembly.
Naphthalene was dried with a Tabai Model K-2 dryer(Tabai Mfg.
Ltd., Japan).
2.3 Procedure
To 50 ml of sample solution containing 5-95 Vg of iron(III) in
a 100-ml Erlenmeyer flask, add 2.0 ml of 1% oxine solution and adjust to pH 5.0 with 2.0 ml of the buffer solution. Mix the solution well and digest for 40 min at 30-40oC. After cooling to room temperature, transfer into this solution as fast as possible 2.5 ml of 20% naph- thalene solution using a small nozzled pipet attached to a rubber bulb, and shake vigorously for 1.5 min. Separate the solid by filtration using a filter paper(e.g., No5C, Toyo Roshi Co.~ Japan) placed flat on a filter plate in a funnel, or through a sinteredglass filter(No2). Wash with water and dry at 50-60°C in a dryer. Then dissolve the product in dimethylformamide and make up to 10 ml.
Measure the absorbance of the solution in a 10~mm glass cell at 462 nm against a reagent blank prepared similarly.
3 Results and discussion 3.1 Absorption spectra
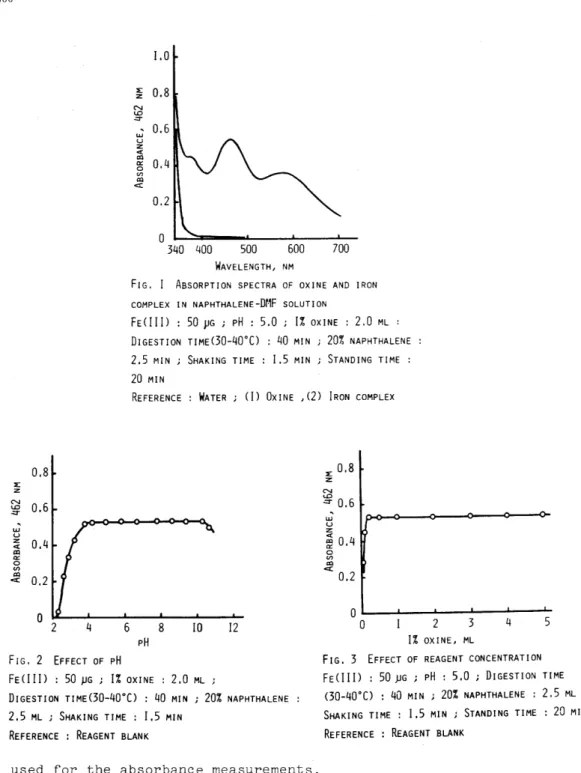
The absorption spectra of oxine and iron(III) oxinate in naph- thalene-dimethylformamide solution, measured against water, are shown in Fig.l. The absorbance curve of iron(III) oxinate shows three peaks at 378, 462 and 580 nm. The reagent blank shows strong
absorption below 360 nm. Beyond this wavelength, there is practically a negligible absorption due to the reagent blank. Therefore~ all the absorbance measurements were performed at 462 nm.
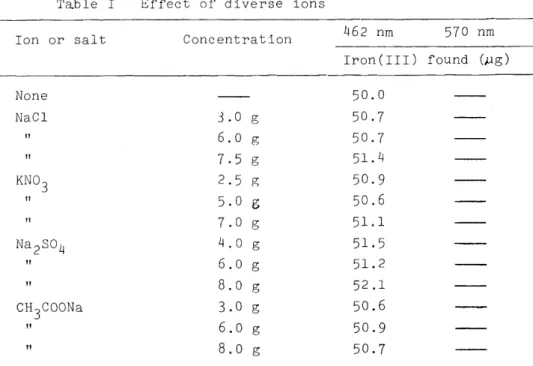
3.2 pH
The effect of pH on the absorbance of the chelate was investigated with 50 ml of sample containing 50 pg of iron(III), 2.0 ml of 1% oxine solution and 2.0 ml of an appropriate buffer solution. The pH of the solution after adsorption of the chelate was measured at room temper- ature. The absorbance variation against pH, is shown in Fig.2. The absorbance curve shows that the absorption starts virtually from pH 2.1, increases sharply up to pH4.l, and gives a definite and maximum value in the pH region 4.1-10.3. Therefore, a pH region of 4.1-10.3 is suitable for the quantitative adsorption. In this study, a pH 5.0 was selected for the absorbance measurements.
3.3 Effect of reagent concentration
Varying amounts of oxine reagent were added to the samples
containing 50 ~g of iron(III) and 2.0 ml of the acetate buffer solution, and variations in the absorbance of the adsorbed chelate were observed at 482 nm. The results are shown in Fig.3. The absorbance of the chelate increased sharply by an increase in the oxine concentration up to 0.2 ml of 0.1% oxine solution and then remained almost constant in the region 0.2-5.0 mI. Therefore, 2.0 ml of 1% oxine solution was
0.8
:E Z
N 0.6
<.D .::r
~ u
z 0.4
« al a:: 0 II)
al 0.2
ex::
0
2 4 6
FIG, 2 EFFECT OF pH 1.0
:E 0.8
z
N <.D .::r
UJ 0.6
u z
« al
0.4
a:: ~ c:x:: al
0.2
WAVELENGTH, NM
FIG. I ABSORPTION SPECTRA OF OXINE AND IRON COMPLEX IN NAPHTHALENE-DMF SOLUTION
FEUI!) 50 JlG i pH : 5.0 i 1% OXINE : 2.0 ML DIGESTION TIME(30-40·C) : 40 MIN 20% NAPHTHALENE 2.5 MIN i SHAKING TIME: 1.5 MIN STANDING TIME:
20 MIN
REFERENCE WATER (I) OXINE ,(2) IRON COMPLEX
8 IO 12
pH
:E 0.8
z
N
<.0 .::r 0.6
UJ U Z
~ 0.4
~ cQ
ex::
0.2
OL---~--~--~--~--~
o 2 3 4 5
1% OXINL ML
FIG. 3 EFFECT OF REAGENT CONCENTRATION FECI II) : 50 pG i 1% OXINE : 2.0 ML i FECII!) : 50)JG ; pH : 5.0 i DIGESTION TIME
C30-40·C) : 40 MIN; 20% NAPHTHALENE: 2.5 ML SHAKING TIME : 1.5 MIN i STANDING TIME : 20 MIN REFERENCE : REAGENT BLANK
DIGESTION TIME(30-40·C) : 40 MIN ; 20% NAPHTHALENE 2.5 ML i SHAKING TIME: 1.5 MIN
REFERENCE : REAGENT BLANK
used for the absorbance measurements.
3.4 Effect of buffer solution and digestion time
Varying volumes of the acetate buffer solution were added to the samples containing 50 pg of iron(III) and 2.0 ml of 1% oxine solution, and the adsorption of the chelate was was carried out according to the
::E 0.8 z
N
<.0 .=:T
.;; 0.6
~o 0 0 0 0-
w z
<I:
~ 0.4
~
I:Q
cC
0.2
0
0 IO 20 30 40 50 60 70 DIGESTION TIME, MIN FIG. 4 EFFECT OF DIGESTION TIME
FE <I I J) : 50 ~G j pH : 5.0 j 1% OXINE : 2.0 ML j 20% NAPHTHALENE : 2.5 ML ; SHAKING TIME : 1.5 MIN REFERENCE : REAGENT BLANK
::E 0.8
z
N <.0 .::r
.;; 0.6
/ '
0 c 0 c CPw Z
<I:
I:Q 0.4
c::
0 (I) I:Q
cC
0.2
o~--~--~--~--~~--~
o
2 3 4 520% NAPHTHALENE, ML FIG. 5 EFFECT OF NAPHTHALENE CONCENTRATION FE <I II) : 50).JG j pH : 5.0 ; I% OXINE : 2.0 ML DIGESTION TIME<30-40°C) : 40 MIN; SHAKING TIME : 1.5 MIN; STANDING TIME; 20 MIN
REFERENCE : REAGENT BLANK
procedure. The amounts of the buffer solution(pH 5.0) added had no effect on the absorbance over the range 1.0-5.0 ml of the solution.
The solution containing iron(III) oxinate at pH 5.0 was digested in a hot water at 30-40
cc.
The absorbance of the chelate increased by an increase in digestion time up to 20 min and remained almost constant in the range 20-70 min. consequently, 35 min of digestion time was selected for the fUrther work(Fig.4).3.5 Effect of naphthalene concentration and shaking time The adsorption of iron(III) oxinate onto microcrystalline
naphthalene was performed by the procedure at different concentration varying from 0.2 to 5.0 ml of 20% naphthalene solution. From the experimental results, the iron(III) oxinate was completely adsorbed on microcrystalline naphthalene in the addition of 1.0-5.0 ml of 20%
naphthalene solution. Consequently, 2.5 ml of 20% solution were used as the most suitable amount for the further work. 2.5 ml of
201
20% naphthalene solution were added to the sample containing the iron(III) oxinate at pH 5.0 and the mixture was shaken vigorously for periods of time ranging from 2 to 100 sec. The experimental data show that the chelate is adsorbed quantitatively onto microcrystalline naphthalene by vigorous shaking in a few sec. Nonetheless 1.5 ml shaking period was selected(Fig.5 and Fig.6).
3.6 Effect of aqueous volume and standing time
Since the ratio of the organic to aqueous phase is very important factor in such procedures, the effect of aqueous dilution on the ab- sorbance of the Chelate was studied. The results are shown in Fig.7.
E: 0.8
z
N
<..0
:::r
0.6
UJ u Z
<I:
III 0.4
0::
0 (J)
<C III
0.2
a a
20 40 60 80 100E: 0.8
z
N ~ 0.6
UJ
z U
<I:
~ 0.4 o
(J)
« III
0.2
o o
300 600 900 I200 1500SHAKI~G TIME, SECOND FIG. 6 EFFECT OF SHAKING TIME
AQUEOUS VOLUME, ML FI~. 7 EFFECT OF AQUEOUS VOLUME FEUl!) : 50 JJG ; pH : 5.0 ; I% OXINE : 2.0 ML ;
DIGESTION TIME(30-40°C) : 40 MIN ;
20% NAPHTHALENE: 2.5 ML ; STANDING TIME: 20 MIN REFERENCE : REAGENT BLANK
FE<IlI> : 50 j./G ; pH : 5.0 ; l% OXINE : 4.0 ML ; DIGESTIONTIME(30-400() : 60 MIN; 20% NAPHTHALENE:
4.0 ML ; SHAKING TIME: 5 MIN; STANDING TIME: 2 Om i n REFERENCE : REAGENT BLANK
Under the experimental conditions given above, the absorbance remains almost constant up to about 400 ml of the aqueous phase. With larger increases in the aqueous volume, however, the absorbance is gradually decreases. The mixture of the chelate and naphthalene was dissolved in dimethylformamide, and the effect of standing time on the absorbance was studied. The results are shown in Fig.8. From the experimental data, it is seen that the absorbance of the chelate in dimethylformamide almost constant for at least 180 min.
1.0
E:
Z
N 0.8
<..0
:::r
~ <I:
w 0.6
u Z <I:
III 0::
0.4
0 (J)
<C III
0.2
0
0 30 60 90 120
STANDING TIME, MIN FIG. 8 EFFECT OF STANDING TIME
150 180
FE<IlI> : 50).JG ; pH : 5.0 ; l% OXINE 2.0 ML 20% NAPHTHALENE: 2.5 ML i SHAK I NG T I ME 15 MIN REFERENCE : REAGENT BLANK
I.O
E: 0.8
z
N
<..0
:::r
.;; 0.6
u z
<I:
III
0:: 0.4
0 (J) III
<C
0.2
FECIlI), jJG/IO ML DMF FIG. 9 CALIBRATION CURVE FOR IRON
pH : 5.0 ; l% OXINE : 2.0 ML ; DIGESTION TIME (30-40°C) : 40 MIN; 20% NAPHTHALENE: 2.5 ML SHAKING TIME: l.5 MIN; STANDING TIME: 20 MIN REFERENCE : REAGENT BLANK
203
3.7 Calibration graph
With the optimum conditions described above, a calibration graph for iron(III) in dimethylformamide solution was constructed at 462 nm.
It was found to be linear over the concentration range of 5-95 ~g
iron(III) in 10 ml of dimethylformamide. The experimental data for iron(III) are shown in Fig.9. The molar absorptivity of the chelate was found to be 6.0 x 10 3 l.mol-l.cm-l
, while the sensitivity was 0.0093 ug.cm -1 for iron(III) for 0.001 absorbance. Ten
replicate analysiS of samples containing 50 Mg of iron(III) gave a mean absorbance of 0.535 with relative standard deviation of 0.75%.
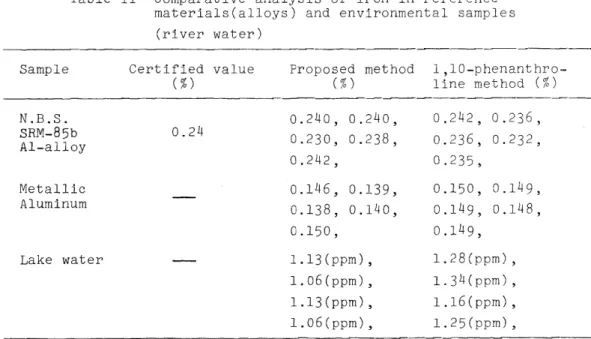
3.8 Effect of diverse ions
Alkali metal salts and chloride or nitrate of cations were added to 50 ml of solutions containing 50 ug of iron(III) and the described procedure was applied. The analytical data shown in Table I repre- sent tolerance limits of various ions tried. The common anions such as Cl-, N0
3-, 3°42 -, CH
3COO-, SCN- and I- even at 6.0 g concentration level, have very little influence on the determination. Especially oxalate and EDT A give serious interference. The tolerance limits, given in ug in parentheses, for cations are: Cu2
+(30), 2n2
+(50), Cd 2+(100), Bi 3+(200), Co 2+(30), A1 3 +(100), Ni 2+(200) and Cr6+(lOOO).
. . 2+ 2+ 2+ 2+
The followlng catlons, Ca ,Mn ,Mg and Pb , a t 8000 pg concen- tration, do not interfere.
Table I Effect of diverse ions
Ion or salt Concentration 462 nm 570 nm Iron(III) found (pg)
None 50.0
NaCl 3.0 g 50.7
"
6.0 g 50.7"
7.5 g 51.4KN03 2.5 g 50.9
"
5.0 g 50.6"
7.0 g 51.1Na 2S04 4.0 g 51.5
"
6.0 g 51.2"
8.0 g 52.1CH3COONa 3.0 g 50.6
"
6.0 g 50.9"
8.0 g 50.7Na2HP04·12H20 1.0
g49.4
" 2.0
g47.0
" 3.0
g46.5
" 5.0
g45.8
Sodium tartrate 2.0 g 51.1 .
" 3.0 g 52.9
" 5.0 g 55.2
Sodium citrate 0.4 g 49.5
" 1.0 g 47.1
" 3.0 g 39.2
" 5.0 g 34.7
KSCN 4.0 g 48.2
" 6.0 g 48.0
" 8.0 g 45.7
Sodium oxalate 0.2 mg 48.3
" 0.6 rng 45.8
" 8.0 mg 39.8
" 20.0 rng 38.6
" 60.0 mg 31.8
" 100.0 rng 25.8
KI 2.0 g 48.4
" 4.0
g47.8
" 6.0 g 49.5
" 8.0
g47.6
Disodiurn EDTA
0.010mg 49.3
" 0.025 rng 46.9
" 0.050 rng 42.3
" 0.100 rng 36.9
NH 4Cl 6.0 g 52.4
" 8.0 g 53.6
CuCII) 10
)1g50.3 50.1
" 30 ,ug 52.8 49.7
" 60 ,ug 56.6 49.6
" 90 ,ug 60.5 50.3
ZnCII) 30 ,ug 50.1 49.5
" 50 )Jg 53.2 48.3
" 100
Pg56.7 48.8
" 150 ,ug 59.9 48.6
Cd(II) 100 ,ug 50.8 50.2
" 200 )lg 54.6 50.3
" 400 ,ug 63.0 49.1
II
Bi(III)
"
II
Co(II)
"
"
Al(lII)
"
"
CaClI)
"
"
Mn(lI)
"
"
Mg(II)
"
II
Ni(II)
"
If
Pb(II)
"
"
Cr(VI)
II
If
"
pH : 5.0 ; 1% oxine
600 .ug 100 )lg 200 pg 300 )1g 30 )lg 80 pg 100 )1g 100 )1g 200 )lg 400 pg 600 )1g 3000 )1g 5000 pg 8000 pg 2000 )J.g 3000 )lg 5000 )1g 8000 Pg 3000 )1g 5000 Jlg
8000 Jlg 150 )1g 200 )Jg 300 )lg 3000 Jlg 5000 Jlg
8000 Jlg 1000 )lg 2000 )lg 3000 Jlg 5000 )1g 7000 J1g
70.8 49.8 52.8
55.7
52.657.0
59.2 50.6 53.7 60.4 66.5 51.0 49.850.4
50.551.1
51.4 51.0 50.1 51.251.7 50.0
52.465.4
50.4 50.1 50.550.3
56.8 60.779.0
88.7 2.0 ml ; 20% naphthalene51.0 48.8 49.1 49.6
48.1 45.8
46.049.8
50.1 51.5 52.8 50.949.2
50.250.3
50.6 51.250.6 49.7
50.2 50.1 33.2 33.4 33.9 50.549.8
50.248.7 50.6
50.9 55.757.2 2.5
ml 3.9 Iron analysis in reference and environmental samples205
The new method was employed for the determination of iron in reference materials(e.g. alloys) and river water samples. The
results were compared with other standard spectrophotometric procedure for iron employing 1.10-phenanthroline.
Standard aluminum alloy(N.B.S. SRM-85B, containing Cu(3.99%), Mg(1.49%), Mn(0.6l%), Fe(O.24%), CrCO.2l%), Sl(0.18%), Ni(0.089%),
2n(0.03%), Ti(0.022%), Pb(0.021%), Ga(0.019%), and V(0.006%» was analyzed for iron using this procedure. A 432.1 mg alloy sample
(N.B.S.) was gently dissolved in 20 ml of 6N HCl and treated with 1.5 ml of 30% H
202. The excess of peroxide was decomposed by heating the solution on a water bath and the volume completed to 100 ml with
distilled water.
A
5-ml aliquot was transfered to a 100-ml separatory funnel containing 25 ml of 6N HCl, and 25 ml of water were addedfurther. Iron in this sample was extracted with vigorous shaking for 5 min with 20 ml of methyl isobutyl ketone. It was extracted again from the organic phase with 25 ml of distilled water and the new procedure was applied for its determination.
used for metallic aluminum system.
The same technique was Samples of river water were filtered to remove suspended
particulates and filtrates were analyzed for the iron content using this method. The analytical results are shown in Table
Ir.
The method was compared very favorably with 1,10-phenanthroline method for iron analysis.
In conclusion this simple, rapid and inexpensive procedure for iron analysis can be successfully applied for the industrial and environmental samples analysis.
Table II Comparative analysis of iron in reference materials(alloys) and environmental samples
Sample
N.B.S.
SRM-85b AI-alloy Metallic Aluminum
Lake water
(river water) Certified value
(% )
0.24
Proposed method ( % )
0.240, 0.240, 0.230, 0.238, 0.242,
0.146, 0.139, 0.138, 0.140, 0.150,
1.13 (ppm), 1.06(ppm), 1.13(ppm), 1.06 (ppm) ,
1,10-phenanthro- line method
(%)
0.242, 0.236 , 0.236, 0.23 2 , 0.235,0.150, 0.1 4 9, 0.1 4 9, 0.148, 0.1 4 9,
1.28(ppm) , 1.34(ppm) , 1.16(ppm), 1.25(ppm),