after Separation by Adsorption of its
pyrrolidinedithiocarbamate on Naphthalene
journal or
publication title
福井大学工学部研究報告
volume 28
number 2
page range 207‑216
year 1980‑09
URL http://hdl.handle.net/10098/4394
MEMOIRS OF THE FACULTY OF ENGINEERING FUKUI UNIVERSITY VOL.28 No. 2 1980
Spectrophotometric Determination of Iron(III) after Separation by Adsorption of its
pyrrolidinedithiocarbamate on Naphthalene Masatada SATAKE and Nobusute YOSHIDA
*
(received Jul. 31, 1980)
A method is presented for the spectrophotometric determination of trace amounts of iron(III) after adsorption of its pyrrolidine- dithiocarbamate with microcrystalline naphthalene. Iron(III) forms a stable chelate with pyrrolidinedithiocarbamate ammonium salt and this chelate is quantitatively adsorbed onto micro- crystalline naphthalene at room temperature in the pH range of 2.9-6.6. The mixture of the chelate and naphthalene is dissolved in chloroform. The chelate in naphthalene-chloroform solution obeys Beer's law over the range 2.3-49 Mg of iron(III) in 10 ml of chloroform. The molar absorptivity is 1.1 x 10⁴
l.mol-l~
cm-l at 357 nm, the sensitivity being 4.9 x 10⁻³ Mg/cm2 for the ab- sorbance of 0.001. The relative standard deviation for the present analysis of iron(III) is 1.0% for ten determinations.In the present experiments, the effect of variables such as pH~
amounts of reagent and naphthalene, digestion and shaking time and diverse ions have been examined. The method has been applied to the determination of iron(III) in reference and environmental samples and results compared with l,lO-phenanthroline method_
1 Introduction
207
Ammonium pyrrolidinedithiocarbamate(abbreviated as APDC) reacts with many metal ions to form water-insoluLle chelates. These chelates have been widely employed for the gravimetry of Nbl ) and Te2), solvent extraction-spectrophotometry of Cu3 ), As4
), Sn,
Sb~
Bi and MIBK ex- traction-atomic absorption spectrophotometry of cu5 ), Ni6 ),Te7)~8)
cr 9 ), Zn and Pb.
Recently we have developed a new method of analysis involving adsorption of metal chelates onto microcrystalline naphthalene and their subsequent spectrophotometric determinations, and demonstrated for palladiumlO
) and nickell l
) with a-furildioxime and copper12
) with Ammonium Pyrrolidinedithiocarbamate.
*
Division of Applied ScienceIn the present work, APDC as a chelating reagent was chosen for the determination of iron(lll). The procedure was successfully applied for the determination of iron(lll) in the reference materials and environmental samples.
2 Experimental method 2.1 Reagents
Standard iron(lll) solution, 10 ppm. Prepared by diluting 10 ml of standard iron(lll) solution(lOOO ppm, Wako Pure Chemical Industries, Osaka, Japan) to 1000 ml with deionized water.
APDC solution, 0.2%.
ml of water.
Prepared by dissolving 0.2 g of APDC in 100 Naphthalene acetone solution, 20%. Prepared by dissolving 20 g of naphthalene in acetone and diluting to 100 mI.
Buffer solutions. Prepared by mixing 1M acetic acid and 1M am- monium acetate solution for pH 3-6; 1M aqueous ammonia and 1M ammonium acetate solution for pH 8-11.
Naphthalene, acetone and all other reagents were of analytical re- agent grade, and were used without further purification~
2.2 Apparatus
A Hitachi Model 200-20 double beam spectrophotometer was used for the absorbance measurements.
All pH measurements were done with a Toa-Dempa, HM-5~, pH meter, equipped with a combined calomel and glass electrode assembly.
The naphthalene was dried with a Tabai Model K-2 dryer(Tabai Mfg.
Ltd., Japan).
2.3 Procedure
Transfer about 40 ml of sample solution containing 30 ~g of iron(lll) to a tightly stoppered Erlenmeyer flask, add 2.0 ml of 0.2% APDC so- lution and adjust pH of the solution to 4.7 with 2.0 ml of the buffer solution. Mix the solution well and stand for 20 min at 20-25°C.
Transfer into this solution as fast as possible 2.0 ml of 20% naphtha- lene solution using a small nozzled pipet attached to a rubber bulb, and shake vigorously for 1.5 min. Separate the solid by filtration using a filter paper(e.g., No5C, Toyo Roshi Co. Japan) placed flat on a filter plate in a funnel, or through a sintered glass filter(N02).
Wash with water and dry at 50-60°C in a dryer. Then dissolve the product in chloroform and make up to 10 ml. Measure the absorbance of solution in a lO-mm glass cell at 357 nm against a reagent blank
perpared similarly.
3 Results and discussion 3.1 Absorption spectra
209
Sample solution containing 30 Mg of iron(lll), 2.0 ml of 0.2% APDC solution and 2.0 ml of the buffer solution was prepared by the
procedure, and the adsorption of the chelate was performed. Figure 1 shows the absorption spectra of APDC and iron(III)-APDC chelate in naphthalene-chloroform solution. The absorption spectra was measured in the range of 330-650 nm against water. The iron(III) chelate has three peaks at 357, 500 and 590 nm, whereas the reagent APDC is almost negligible absorption above 350 nm. therefore, 357 nm was chosen as the most sensitive wavelength.
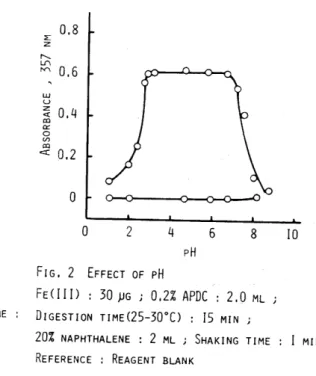
3.2 Effect of pH
The relationship between the absorbance and the pH of the solution after adsorption was investigated in the pH range 1.0-8.8. The
result is shown in Fig.2. From the exp~~imental data, the absorbance of the iron (III) -APDC chelate increasect'··sharply with increasing pH, reached the maximum and constant over the range 2.9-6.6, and decreased sharply above pH 6.6. Therefore, the pH of the solution was adjusted to
4.7
for the absorbance measurements.1.0 0.8
FE(III)-APDC COMPLEX
w 0.6
u z
« "l a:: 0.4
0
(/)
~ APne
"l c:t:
0.2
a
300 400 500 600
WAVELENGTH~ NM
FIG. I ABSORPTION SPECTRA OF APDC AND IRON(III) COMPLEX IN NAPHTHALENE-CHCL3 FE(III) : 30 ~G i pH : 4,7 i DIGESTION TIME IS MIN i 0.2% APDC : 2.0 ML
REFERENCE WATER
L 0.8
z:
r--..
Lf\
N"'I 0.6
w u
~ 0.4
a::
0
(/)
"l
<I: 0.2
a
a
2 4 6 8pH FIG. 2 EFFECT OF pH
FE(IrI) : 30 ~G i 0.2% APne : 2.0 ML DIGESTION TIME(2S-30°C) : IS MIN
10
20% NAPHTHALENE : 2 ML i SHAKING TIME I MIN REFERENCE : REAGENT BLANK
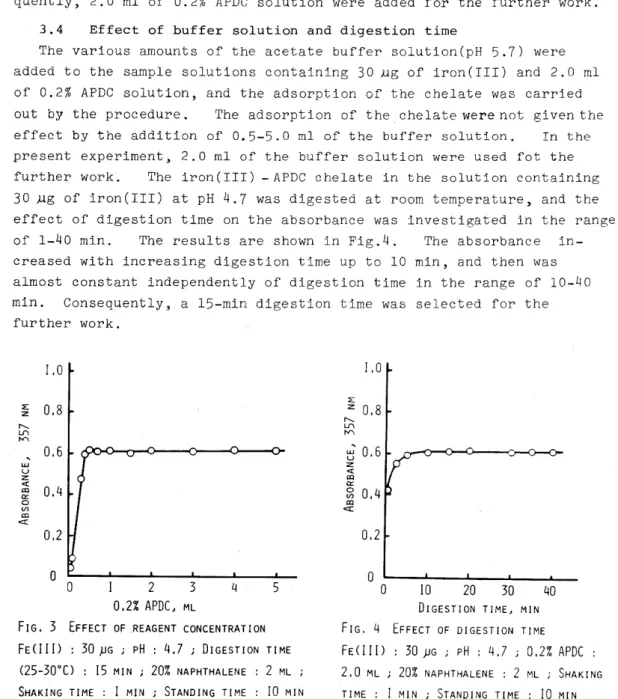
3.3 Effect of reagent concentration
Varying amounts of APDC reagent were added to the samples containing 30 Mg of iron(III) and 2.0 ml of the buffer solution, and variations in the absorbance of the chelate were studied at 3S7 nm. The results are shown in Fig.3. It can be seen that the absorbance increased with increasing amounts of APDC solution up to 0.5 ml of 0.2% APDC solution and remained practically constant in the range of 0.5-5.0 mI. Conse- quently, 2.0 ml of 0.2% APDC solution were added for the further work.
3.4 Effect of buffer solution and digestion time
The various amounts of the acetate buffer solution(pH 5.7) were added to the sample solutions containing 30 llg of iron(rII) and 2.0 ml of 0.2% APDC solution, and the adsorption of the chelate was carried out by the procedure. The adsorption of the chelate were not given the effect by the addition of 0.5-5.0 ml of the buffer solution. In the present experiment, 2.0 ml of the buffer solution were used fot the further work. The iron(III) -APDC chelate in the solution containing 30 ~g of iron(III) at pH 4.7 was digested at room temperature, and the effect of digestion time on the absorbance was investigated in the range of 1-40 min. The results are shown in Fig.4. The absorbance in- creased with increasing digestion time up to 10 min, and then was almost constant independently of digestion time in the range of 10-40 min. Consequently, a IS-min digestion time was selected for the
further work.
1.0
:E 0.8
z r--....
l.I1 I'rI
~ 0.6
u z
« 0.4
CQ a::
0
(/) CQ
<:t:
0.2
0 0 2 3 4 5
0.2% APDC ML
FIG. 3 EFFECT OF <REAGENT CONCENTRATION FE(III) 30 ~G ; pH : 4.7 ; DIGESTION TIME
(25-30°C) : 15 MIN ; 20% NAPHTHALENE 2 ML SHAKING TIME : I MIN ; STANDING TIME 10 MIN REFERENCE : REAGENT BLANK
1.0
:E z 0.8
r--....
l.I1 I'rI
~ 0.6
z «
CQ a::
0 0.4
(/) CQ
<:t:
0.2 0
0 lO 20 30 40
DIGESTION TIME, MIN FIG. 4 EFFECT OF DIGESTION TIME FE(III) : 30 pG ; pH : 4.7 ; 0.2% APDC
2.0 ML ; 20% NAPHTHALENE: 2 ML ; SHAKING TIME: I MIN; STANDING TIME: 10 MIN REFERENCE : REAGENT BLANK
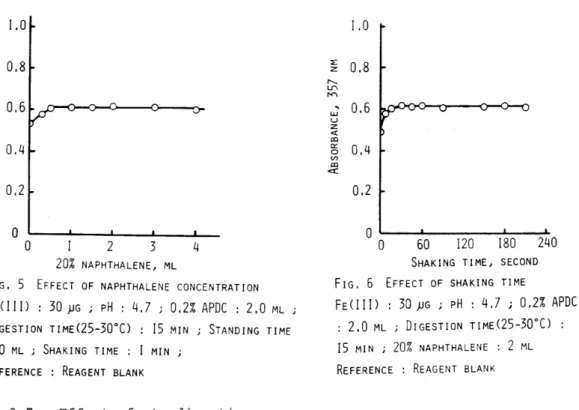
3.5 Effect of naphthalene concentration
Various amounts of naphthalene were added to the sample solution containing the iron(III)-APDC chelate~ and the adsorption of the
211
chelate was performed by the procedure. Figure 5 shows the effect of addition of naphthalene on the absorbance. From the experimental data~
the addition of 0.5-4.0 ml of 20% naphthalene solution did not cause the effect on the absorbance.
added for the further work.
Consequently~ 2.0 ml of 20% solution were
3.6 Effect of shaking time
The effect of shaking time on the absorbance of the chelate was in- vestigated by the procedure. The results are shown in Fig.6. The adsorption of the chelate onto microcrystalline naphthalene was com- pleted by the vigorous shaking for 20 sec. Consequently, 1 min of shaking time was selected for the fUrther work.
1.0
:::E 0.8
z ,...
1..1"\
/'1"\
uJ 0.6
u z
<t a::l a: 0.4
0 U)
c:r c:Q
0.2
0
0 2 3 4
20% NAPHTHALENE, ML
FIG. 5 EFFECT OF NAPHTHALENE CONCENTRATION FECIII) : 30 ~G i
pH :
4.7 j 0.2% APDC : 2.0 ML DIGESTION TIMEC25-30°C) IS MIN i STANDING TIME: 10 ML j SHAKING TIME: MIN i
REFERENCE : REAGENT BLANK
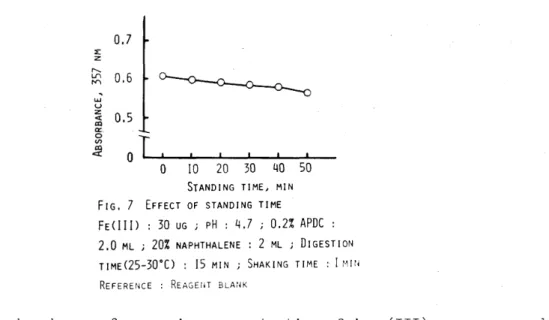
3.7 Effect of standing time
1.0
:::E
0.8 z ,...
1..1"\
/'1"\
... 0.6
UJ
u Z
<t a::l
a: 0.4
0
U)
ex: c:Q
0.2
0
0 60 120 180 240
SHAKING TIME, SECOND FIG. 6 EFFECT OF SHAKING TIME
FE(III) : 30 pG i
pH :
4.7 j 0.2% APDC : 2.0 ML i DIGESTION TIME(25-30°C) 15 MIN i 20% NAPHTHALENE : 2 ML REFERENCE : REAGENT BLANKThe adsorbed mixture of the chelate and naphthalene was separated from the solution , dried in a dryer and dissolved in chloroform. The color of the chelate in chloroform solution decreased by less than 4.6%
over the range 5-40 min. Consequently, a 10-min standing time was selected for the further work.
3.8 Calibration graph
0.7
L Z r--...
0.6
~
L.r\
t<'I
UJ U z
0.5
-=: III 0::
0
oT
~ en
0 10 20 30 40 50
STANDING TIME, MIN FIG. 7 EFFECT OF STANDING TIME FEU!!) : 30 UG i pH : 4.7 i 0.2% APDe 2.0 ML i 20% NAPHTHALENE: 2 ML i DIGESTION TIME(25-30°C) : IS MIN; SHAKING TIME: I r·qt,
REFERENCE : REAGEiH BLM,K
The absorbances for varying concentration of iron(III) were measured at 357 nm against the reagent blank under the optimum conditions de- scribed above. Table 1 shows calibration graph, precision, molar absorptivity and sensitivity for iron(III).
Table 1 Calibration graph, precision~ molar ~bsorptivity
and sensitivity for iron{III) (A) Calibration graph for iron(III)
As (0.205)·C - (0.005)
As Absorbance vs reagent blank C : pg iron(III), 2.3 ~ C ~
49
(B) Precision for iron(III)
n
=
10, C=
30 Mg, C.V.=
1.0%(C) Molar absorptivity and sensitivity for iron(III) Wavelength
(nm) 357 500 590
Molar absorptivity ( l·mol -1 . cm -1)
10
4
1.1 x
3.7
x 103
3.7 x 10 3
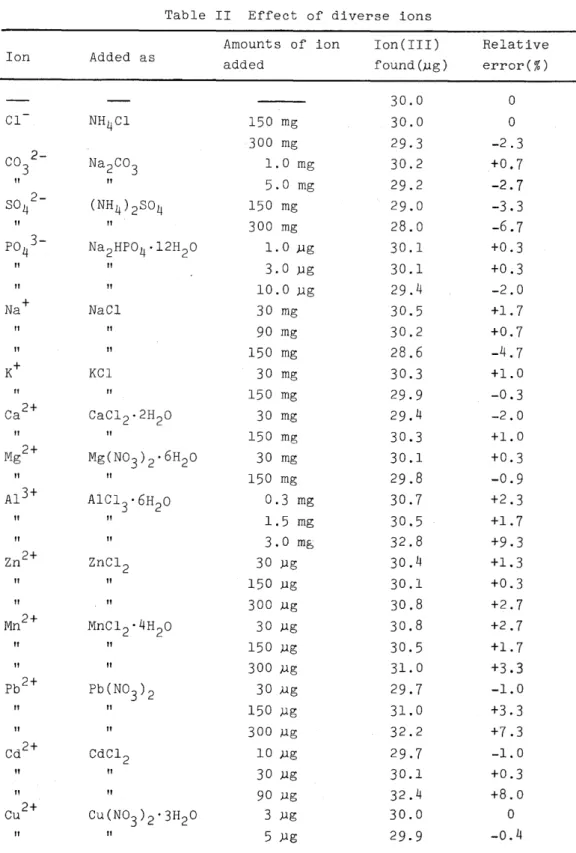
3.9 Effect of diverse ions
Sensitivity (pg/cm2)
4.9
x 10-3
1.5 x 10⁻² 1.5 x 10⁻²
Alkali metal salts and metal ions were individually added to the so- lutions containing 30 pg of iron(III) and the described procedure was
213
applied. The analytical data are shown in Table
II.
Table I I Effect of diverse ions
Amounts of ion Ion(III) Relative
Ion Added as added found c.ug) error(%)
30.0 0
Cl NH 4Cl 150 mg 30.0 0
300 mg 29.3 -2.3
co
2-3 Na 2C03 1.0 mg 30.2 +0.7
" "
5.0 mg 29.2-2.7
SO 2-
4 ( NH 4)2 S04 150 mg 29.0 -3.3
" "
300 mg 28.0 -6.7PO 3-
4 Na 2HP0 4 ·12H2O 1.0 ).lg 30.1 +0.3
" "
3.0 .ug 30.1 +0.3" "
10.0 ).lg 29.4 -2.0Na+ NaCl 30 mg 30.5 +1.7
" "
90 mg 30.2 +0.7" "
150 mg 28.6 -4.7K+ KCl 30 mg 30.3 +1.0
" "
150 mg 29.9 -0.3Ca 2+ CaC1 2 ·2H 2O 30 mg 29.4 -2.0
" "
150 mg 30.3 +1.0Mg 2+ Mg(N0 3 )2· 6H20 30 mg 30.1 +0.3
" "
150 mg 29.8 -0.9A1 3+ AIC1
3'6H2O 0.3 mg 30.7 +2.3
" "
1.5 mg 30.5 +1.7" "
3.0 mg 32.8 +9.3Zn 2+
ZnC1 2 30 ).lg 30.4 +1.3
" "
150 .ug 30.1 +0.3" "
300 ).lg 30.8 +2.7Mn2+ MnC1 2 ·4H 2O 30 .ug 30.8 +2.7
" "
150 ).lg 30.5 +1.7" "
300 ).lg 31.0 +3.3Pb 2+ Pb(N03)2 30 .ug 29.7 -1.0
" "
150 ).lg 31.0 +3.3" "
300 .ug 32.2 +7.3Cd 2+ CdC1 2 10 ).lg 29.7 -1.0
" "
30 ).lg 30.1 +0.3" "
90 .ug 32.4 +8.0Cu 2+ Cu(N03 )2' 3H20 3 ).lg 30.0 0
" "
5 ).lg 29.9 -0.4" "
10 )lg 31.2 +4.0Co 2 + Co(N0
3)2' 6H20 0.5 pg 30.1 +0.3
" "
2.0 pg 30.1 +0.3" "
3.0 pg 31.4 +4.7Ni 2 + Ni(N03)2· 6H 20 0.5 )lg 30.4 +1.3
" "
2.0 )lg 31.3 +3.7" "
3.0 pg 32.8 +9.3Iron(III) 30 pg ; pH : 4.7 ; 0.2% APDC 2.0 ml ; Error ~ 3%
in the determination of iron(III) was considered tolerable. The tolerance limits, given in mg or )lg in parentheses, for cations and
. + + 2+ 2+
anlons are: K (150 mg), Na (150 mg), Ca (150 mg), Mg (150 mg), A1 3 +(1.5 mg), C1-C300 mg), S042-C150 mg), C0
3
2-(5 mg), Zn2+C300 pg),
2+ 2+ 2+ 2+ 2+
Mn (300 .ug), Pb (150 .ug), Cd (30 )lg), Cu (5 )lg), Co (2 )lg), Ni2
+(2 )lg), P0
4
3 -(10 .ug). The following ions interfered seriously Cu2+,
c0
2+, Ni2+, P043 -. These metal ions must be preliminary elimi- nated before adsorption by some methods such as ion-exchange separation, solvent extraction, addition of masking reagent or pH adjustment.
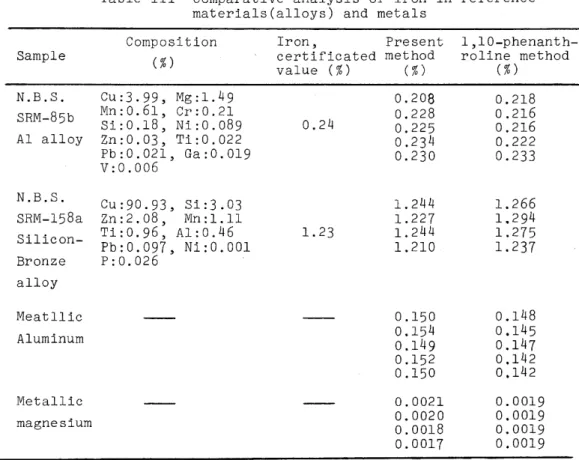
3.10 Iron analysis in standard reference and environmental samples The present method was used for the determination of iron in
standard reference materials(e.g. alloys), metallic aluminum, metallic magnesium and natural water samples. The results were compared with the standard spectrophotometric procedure for iron using 1,10-phenan- throline, as shown in Tables III and IV.
The recommended procedure of samples is as follows :
(A) Aluminum alloy(N.B.S., SRM-85b) : Take 0.8424 g of this alloy and dissolve it in 40 ml of HCl(l+l) and then treat with 2.0 ml of 30% H20 2 . The excess of H202 was decomposed by heating the so- lution on a water bath and the volume completed to 100 ml with double distilled water. A 3-ml aliquot was transfered to a 100-ml separatory funnel containing 25 ml of HCl(l+l), and 25 ml of water were added further. Iron in this sample was extracted with vigorous shaking for 5 min with 20 ml of MIBK. It was extracted again from the organic phase with 25 ml of water and the new procedure was applied for its determination~
was used for other samples.
The same technique
(B) Copper Silicon(N.B.S., SRM-158a) : Take 0.1086 g of this alloy and dissolve it in 10 ml of HC1(1+1), 10 ml of H2S04 (1+1), 1 ml of HN0
3 and 1 ml of 30% H20 2 . The solution was gently heated on a water
bath. The excess of H202 and acid was evaporated and then the volume was completed to 200 ml with water. A 5-ml aliquot was used for the procedure.
(C) Metallic aluminum(shot) : A 2.0S15 g of aluminum shot was gently dissolved in 90 ml of HCl(1+3) and then treated with 2 ml of 30%
H20 2 . The excess of H202 was decomposed by heating the solution on a water bath and the volume completed to 200 ml with water.
A 2-ml aliquot was used for the present procedure described above.
(D) Metallic magnesium(powder) : A 10.lS16 g of magnesium powder was gently dissolved in 150 ml of HCl(l+l) and treated with 5 ml of 30% H20 2 . The excess of H202 was decomposed by heating the so- lution on a water bath and the volume completed to 200 ml with water. A 35-ml aliquot was used for the procedure described.
215
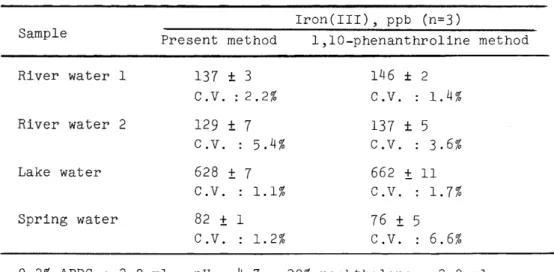
(E) Natural water sampl~s : Samples were filtered to remove suspended particulates and filtrates were analyzed for the iron content using this method and 1,10-phenanthroline method.
Sample N.B.S.
SRM-S5b Al alloy
N.B.S.
SRM-15Sa 3ilicon- Bronze alloy Meatllic Aluminum
Metallic magnesium
Table III Comparative analysis of iron in reference materials(al10ys) and metals
Composition Iron, Present 1,10-phenanth- (% ) certificated method roline method
value ( % ) ( % ) (% )
CU:3.99, Mg: 1.49 0.208 0.21S
Mn:0.61, Cr:0.21 0.228 0.216
Si:O.lS, Ni:0.OS9 0.24 0.225 0.216
Zn:0.03, Ti:0.022 0.234 0.222
Pb:0.021, Ga:0.019
v:0.006 0.230 0.233
Cu:90.93, 3i:3.03 1.244 1.266
Zn:2.0S, Mn:l.l1 1.227 1.294
Ti:0.96, Al:0.46 1.23 1.244 1.275
Pb:0.097, Ni:O.OOl 1.210 1.237
p:0.026
0.150 0.14S 0.154 0.145 0.149 0.147 0.152 0.142 0.150 0.142 0.0021 0.0019 0.0020 0.0019 O.OOlS 0.0019 0.0017 0.0019
Table IV Analytical results of natural water for iron Iron(III), ppb (n=3)
Sample
Present method 1,10-phenanthroline method River water 1 137 ± 3 146
±
2C.V. : 2.2% C.V. : 1.4%
River water 2 129
±
7 137±
5 C .V. : 5.4% C.V. : 3.6%Lake water 628
±
7 662±
11C.V. 1.1% C.V. 1.7%
Spring water 82
±
1 76±
5C.V. 1. 2% C.V. 6.6%
0.2% APDC : 2.0 ml ; pH 4.7 ; 20% naphthalene: 2.0 ml
The analytical results by the proposed method were in good agreement with 1,10-phenanthroline method.
REFERENCES
1) I.M.Gihalo, I.P.Alimarin and P.Davadorzh: Zh. Analit. Kim., 18, 835(1963).
2) K.Hayashi, K.lto and S.Tanabe: Presented at 24th annual meeting, Chemical society of Japan (1971).
3) R.W.Looyenga and D.F.Boltz: Talanta, 19, 82(1972).
4) R.A.Chalmers and D.M.Dick: Anal. Chim. Acta, 31, 520(1964).
5) K.Kremling and H.Peterson: Anal. Chim. Acta, 70, 35(1974).
6) P.G.Brewer and D.W.Spencer: Amer. Soc. Test. Mater. Spec. Test.
Pub1., No.443, 70(1969).
7) H.A.Drall: At Absorption Newsletter,
I,
90(1968).8) C.E.Mulford: At Absorption Newsletter, ~, 88(1966).
9) M.R.Midgett and M.J.Fishman: At Absorption Newsletter, ~, 128(1967).
10) M.Satake, Y.Matsumura, T.Fujinaga and Y. Takagi: Bunseki Kagaku, 27,486(1978).
11) M.Satake, Y.Matsumura and T.Fujinaga: Talanta, ~, 718(1978).
12) T.Fujinaga, Y.Takagi and M.Satake: Bull. Chern. Soc. Jpn., 52, 2556(1979).