Mechanisms of Cellular Senescence and Longevity
in Saccharomyces cerevisiae
A Doctoral Thesis
Submitted to Graduate School of Bioscience
Nagahama Institute of Bio-Science and Technology
Yuka Kamei
1
Contents
Mechanisms of Cellular Senescence and Longevity in Saccharomyces cerevisiae
(出芽酵母の細胞老化と寿命決定機構に関する研究)
Chapter 1 General introduction
1.1 Genetic and environmental determinants of lifespan 1.2 Cellular senescence in mammals
1.3 Budding yeast as a model organism in cellular aging research 1.4 A metabolomic approach for lifespan study
1.5 Objectives of this study
Chapter 2 Replicative lifespan regulation by GABA metabolism pathway genes
2.1 Introduction
2.2 Materials and methods 2.3 Results
2.4 Discussion 2.5 Summary
Chapter 3 Transcriptomic and metabolomic analyses during the early stage of replicative cellular senescence
3.1 Introduction
3.2 Materials and methods 3.3 Results
3.4 Discussion 3.5 Summary
Chapter 4 Replicative lifespan regulation by vitamin B6
2 4.2 Materials and methods
4.3 Results 4.4 Discussion 4.5 Summary
Chapter 5 Conclusion and general discussion
References
List of publications
Acknowledgments
3
Chapter 1
General introduction
Lifespan is generally considered an important indicator for quality of life. Everyone might concern their own lifespan and care to slow aging for the quality of their life. As accompanied with development of medical care and improvement of nutrition, the average human lifespan is extending year after year; especially the Japanese life expectancy at birth is one of the longest in the world (women; 87.0 at rank 1, men; 80.0 at rank 8 in 2012) (1). Recently, further challenges to extend healthspan, rather than lifespan, by delaying senescence would be expected.
1.1 Genetic and environmental determinants of lifespan
Lifespan is thought to be largely determined by the combined effects of genetics and environmental factors (Figure 1.1). Many genes involved in aging have been identified in a variety of organisms, including mice, nematodes, and yeasts (2-4). Premature aging disorders, like Werner syndrome, Bloom’s syndrome, and Hutchinson–Gilford Progeria Syndrome (HGPS), have been the subjects of immense interest as they recapitulate many of the phenotypes observed in physiological aging (5). They arise from mutations of a single gene. For example, the most common cause of HGPS is a single-letter "misspelling" in a gene on chromosome 1 that codes for lamin A, a protein that is a key component of the membrane surrounding the cell’s nucleus (6).
One of the most important environmental factors is lifestyle, such as calorie intake. Oxidative stress is worldwide recognized as a fundamental component of the aging. Ultraviolet B-induced DNA damage, when left unrepaired, leads to accumulation of mutations, predisposing people to carcinogenesis as well as to premature aging (7). In response to many different environmental and physiological signals, nutrient and stress sensors modulate lifespan. Reduced activity of nutrient-sensing pathways or dietary restriction slows aging and increases lifespan (8). The nutrient-sensing pathways include the kinase target of rapamycin (TOR), AMP-activated protein kinase (AMPK), sirtuins, and insulin/insulin-like growth factor (IGF-1) signaling, among others (9), and these
4
Figure 1.1 Cellular lifespan is determined by the combined effects of genetics and
environmental factors. For genetic determinants, progeria genes are well studied. For environmental determinants, nutrient (including glucose), insulin, and oxidative stress modulate lifespan. The nutrient and stress sensors are also involved in aging.
nutrient signaling molecules also regulate stress response pathways (10).
1.2 Cellular senescence in mammals
Senescence is the biological process of cellular and organismal changes that deteriorate physiological function with the passage of time, resulting eventually in death. Accelerated cellular senescence and progressed organ dysfunction lead to a gradual decline in the physical and mental faculties of individuals (11). This deterioration is believed to be due to cumulative damage to molecular and cellular structures, and by programmed alteration of gene expression. Human somatic cells have a limited capacity to divide in culture and eventually enter replicative senescence, a state of irreversible proliferation arrest (Figure 1.2A), leading to tissue dysfunction (12). Biological aging is the main risk factor for human pathologies, such as cancer, diabetes, cardiovascular disorders, and neurodegenerative diseases (13), and removal of senescent cells can prevent or delay tissue dysfunction and extend the healthspan (14).
In mammals, senescent cells exhibit diverse alterations in their cellular and biochemical features: an enlarged and flattened cellular morphology, an increase in the production of reactive oxygen species (ROS), senescence-associated -galactosidase
Glucose Nutrient Oxidative stress Insulin Cell death Progeria genes *
5
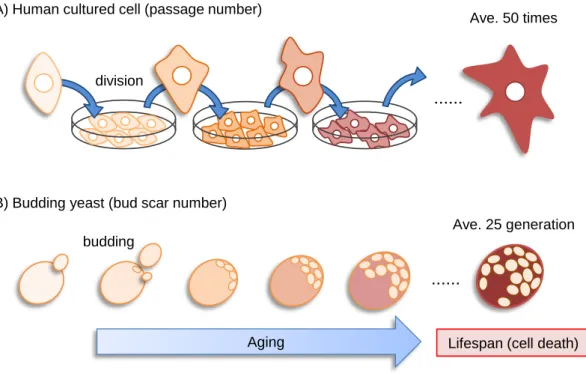
Figure 1.2 Budding yeast as a model for cellular senescence. (A) Cellular senescence of
human cultured cells. The term passage number refers to the number of times that a cell population has been removed from the culture vessel and undergone a subculture (passage) process. (B) Cellular senescence of budding yeast. As cells undergo cell divisions, senescence proceeds.
(SA--gal) activity, and senescence-associated secretory phenotype (SASP) (13,15). Some of these age-related cellular phenomena are explained by time-series gene expression profiles; the senescent process is divided into four stages (early, middle, advanced, and very advanced), with specific genes being prominently expressed at each of these stages (16).
1.3 Budding yeast as a model organism in cellular aging research
The budding yeast, Saccharomyces cerevisiae, is a useful and powerful model for cellular aging research. Most benefits of using yeast are based on its short generation time, convenient and cheap experimental setups, straightforward genetic approaches (17). Furthermore, yeast has similarities (homologues and orthologues) with mammalian (including human) cells, making it good model for human diseases (18).
Yeast cells age as they undergo division, as do cultured mammalian cells: their size Lifespan (cell death) Aging
budding
(A) Human cultured cell (passage number)
(B) Budding yeast (bud scar number) division
Ave. 25 generation Ave. 50 times
……
6
increases, their shape is altered, their cell cycle slows down, and they become sterile (19). Furthermore, the nucleolus of aged yeast cells tends to be larger and/or more fragmented, and the mitochondria become dysfunctional (19,20). The rate of protein synthesis and ribosome activity decrease linearly with age (21). In mother cells during the budding process, oxidative stress, protein aggregation, and extrachromosomal rDNA circles (self-replicating circles of ribosomal DNA) accumulate and cause senescence (20). These accumulations are relieved by calorie restriction, which helps slow aging and extend the lifespan in yeast (22).
In the yeast, two types of cellular aging have been proposed: chronological and replicative (Figure 1.3). The chronological lifespan is the length of time a population remains viable in the post-diauxic and stationary phases (23). The replicative lifespan of a yeast cell is defined as the number of daughter cells that a mother cell can generate before dying (24). The budding yeast is a unique model for studies on the lifespan of a single cell, because its asymmetric division makes it easier to analyze a population of cells compared with symmetrically-dividing mammalian cells (Figure 1.2B). The median replicative lifespan of most wild-type strains is ~25 generations; the maximum recorded is ~40 generations (25). Similarly to mammals, calorie restriction extends the replicative lifespan in yeast. Calorie restriction caused a metabolic shift from fermentation to respiration, resulting in activation of Sir2p, a nicotinamide adenine dinucleotide (NAD+ )-dependent deacetylase belonging to the sirtuin family that acts as a master regulator of anti-aging (26), or reduction of activity of the nutrient-responsive kinases Sch9p and TOR (27).
1.4 A metabolomic approach for lifespan study
Metabolomics is an established and useful tool in functional genomics. But, many reports have suggested that a combination of metabolomics and transcriptomics is required for the complete elucidation of gene function (28,29). Together with transcriptomics and proteomics, metabolomics is also applicable for elucidation of aging and lifespan.
7
Figure 1.3 Model of two types of cellular aging in the yeast. (A) The chronological
lifespan is the length of time a population remains viable in the non-dividing state. (B) The replicative lifespan is defined as the number of daughter cells that a mother cell can generate before dying.
In a previous study, fingerprinting of identified compounds using gas chromatography–mass spectrometry (GC-MS) and capillary electrophoresis-mass spectrometry (CE-MS) revealed a correlation between replicative lifespan and metabolic profile in S. cerevisiae (30). The levels of amino acids (e.g., glutamine and proline) and nucleotide derivatives (e.g., inosine and cAMP) correlated most closely with replicative lifespan. Furthermore, Yoshida et al. predicted replicative lifespan-related genes using multivariate analysis of the metabolome data and found novel genes that regulates replicative lifespan. These showed that longevity can be quantitatively expressed using the whole metabolic profile of the cell, while metabolomics was conventionally used only to discriminate among a few different cell types. However, it remains unclear that whether correlated metabolites is a cause of longevity and that how these genes regulates replicative lifespan.
1.5 Objectives of this study
In this thesis, what regulates replicative lifespan was investigated using the budding (A) Chronological aging
(B) Replicative aging Mother cell Daughter cell …… Growth arrest Cell death Cell death 1st generation 1 day X days Xth generation
8
yeast S. cerevisiae from the point of view of metabolism and gene expression in various mutants and during aging process. This Chapter 1 shows the background information for this study.
In Chapter 2, it was investigated that how -aminobutyric acid (GABA) metabolism pathway genes regulate replicative lifespan. Alteration of cellular metabolism expect for GABA contents seemed to cause lifespan regulation. In Chapter 3, to determine what change initiates the aging process, the early stage of replicative aging cells was focused. In the cells at about half the mean lifespan, amino acid biosynthesis declined, and sugar and tricarboxylic acid (TCA) cycle metabolism increased. In Chapter 4, whether vitamin B6 affects replicative lifespan was investigated. Vitamin B6 was shown to be important to replicative lifespan in yeast.
9
Chapter 2
Replicative lifespan regulation by GABA metabolism pathway genes
2.1 Introduction
It has been reported that many metabolism-related genes, including genes that encode metabolic transcription factors and enzymes, are involved in lifespan (4,31-33). Recently, Yoshida et al. revealed a correlation between replicative lifespan and metabolic profile of identified compounds using GC-MS and CE-MS in S. cerevisiae (30). The levels of amino acids (e.g., glutamine and proline) and nucleotide derivatives (e.g., inosine and cAMP) correlated most closely with replicative lifespan. Furthermore, they established a multivariate model to predict lifespan from a metabolic profile and demonstrated that three genes—utilization of GABA (UGA)3, five zinc fingers (FZF)1, and uridine hydrolase (URH)1—are aging-related genes because disruption of UGA3,
FZF1, or URH1 resulted in lifespan extension.
The UGA3 gene encodes a zinc-finger transcription factor necessary for GABA-dependent induction of the UGA structural genes, UGA1, UGA2, and UGA4 (34,35) (Figure 2.1). Uga1p (GABA transaminase) deaminates GABA to succinate semialdehyde. Uga2p (succinate semialdehyde dehydrogenase) converts succinate semialdehyde to succinic acid, which is supplied to TCA cycle. Uga4p (GABA permease) transports GABA to the vacuole. These UGA structural genes are involved in the use of GABA as a nitrogen source (34). Uga3p is required for transcriptional induction of the UGA structural genes in the presence of GABA and maintenance of basal transcription of the UGA genes in the absence of GABA (36).
To understand the cause of the replicative lifespan increase in the UGA3 deletion mutant, deletions of each UGA structural gene that is under the control of Uga3p for effects on replicative lifespan were tested. Deletion of UGA1 extended lifespan, but deletion of UGA2 or UGA4 did not. It was also found that GAD1, which encodes a GABA-metabolizing enzyme, was involved in aging. Respiration was not increased in
10
Figure 2.1 The synthesis, conservation and metabolism of GABA. Gad1p, glutamic acid
decarboxylase; Uga1p, -aminobutyric acid (GABA) transaminase; Uga2p, succinic semialdehyde (SSA) dehydrogenase; Uga4p, GABA permease. Transcription factor Uga3p activates transcription of UGA1, UGA2, and UGA4 genes.
the long-lived uga1 and gad1 cells. Deletion of SIR2, a yeast sirtuin, prevented lifespan
extension by deletion of UGA1 and GAD1. Based on these findings, the hypothesis that reduced activity of the GABA-metabolizing enzymes increases lifespan in a SIR2-dependent manner was discussed.
2.2 Materials and methods
2.2.1 Strains and medium
All S. cerevisiae strains used in this study were derived from BY4742 (MAT
ura30 leu20 his31 lys20). Deletion strains were obtained from the MAT ORF deletion collection (Open Biosystems, USA). Yeast extract (1%), Bacto Peptone (2%), dextrose (2%) (YPD) medium was used for routine cultures.
2.2.2 Replicative lifespan determination
Replicative lifespan was assayed with minor modifications as described previously (37). Yeast cells were thawed from frozen stock and streaked onto YPD agar plates or
UGA1
Uga3 GABA transaminase
Glutamine Glutamic acid
GABA SSA dehydrogenase Proline Succinic acid SSA Uga1 Uga2 Gad1 Glutamate decarboxylase GABA permease Uga4 vacuole TCA cycle Malic acid Fumaric acid Succinic acid Isocitric acid Citric acid Oxaloacetic acid 2-Oxoglutaric acid Acetyl-CoA Pyruvic acid Succinyl-CoA UGA2 UGA4 Uga3 Uga3
11
YPD plates containing 200 μg/mL G418. After 3 days, a single colony was transferred to 2 mL of YPD liquid media, and cells were grown overnight. The culture was diluted 1:500 in fresh YPD liquid medium, and a sample was spread onto YPD agar plate containing 10 μg/mL phloxine B. YPD agar plates containing GABA (0.1% or 0.5%) were used as indicated in the text. Using a micromanipulator, 48 cells were arrayed on a YPD plate and allowed to undergo 1 or 2 divisions. Virgin cells were then selected and subjected to lifespan analysis. Except during manipulation, plates were sealed with Parafilm and incubated at 30°C during the day and stored at 4°C at night to avoid excessive budding. Daughter cells were removed by gentle agitation with a dissecting needle and scored every 2 h. For each of the 48 cell lines, buds from each mother cell were counted until division of living cells ceased or cells were stained with phloxine B. This assay was performed at least twice with each strain. For statistical analysis, lifespan data sets were compared by a Wilcoxon rank-sum test. Two strains are stated to have a significant difference in lifespan when P < 0.01.
2.2.3 GC-MS analysis
Sample preparation from dried yeast cells and GC-MS analysis were performed as described previously (30). GC-MS analysis was performed independently 5 times for each strain. For comparison of intracellular levels of GABA, succinic acid, and glutamic acid, the area under the peak representing the compound was measured. To process GC data, raw chromatographic data (Pegasus file, *.peg) were converted into ANDI files (Analytical Data Interchange Protocol, *.cdf). The ANDI formatted data was converted and transferred between different mass spectral instruments. Baseline correction, peak detection, and peak alignment was performed with the free software MetAlign (Wageningen UR, The Netherlands, freely available at http://www.pri.wur.nl/UK/products/MetAlign/). The distinctive m/z peak for each compound was normalized on the basis of the intensity of the ribitol peak. Each metabolite was identified on the basis of an in-house chemical library. An m/z peak was selected as a distinctive m/z peak in the mass spectrogram if its intensity was not affected by neighboring peaks.
12
2.2.4 1H-nuclear magnetic resonance (NMR) analysis
Extraction of metabolites from yeast cells was performed as described previously (38). Yeast cell cultures (25 mL) were inoculated at 4.0 106 cells/mL and grown between 5–6 h to reach an OD of 1.0. The cells were isolated from culture medium by
centrifugation (5 min; 1,750 g), washed in water once. Then, 2 mL of 75% (v/v) ethanol
solution, at 80°C, was added directly to the cell pellet. This mixture was mixed by vortex
for 30 sec and heated for 3 min to 80°C. The mixture was cooled on ice for 3 min and
subsequently dried in rotary vacuum concentrator at 35°C.
1H-NMR analysis was performed as described previously (39). The dried extracts
were dissolved in 0.6 mL of 0.1 M potassium phosphate buffer, pH 7.0, in D2O, containing
1 mM sodium 3-trimethylsilyl-2,2,3,3-tetradeuteropropionate (TSP), mixed by vortex,
and then centrifuged at 16,000 g for 10 min to remove material that had not dissolved.
1H-NMR spectra were acquired at 400 MHz into 4,096 data points using a pulse angle of
90°, an acquisition time of 0.8 sec, and a sweep width of 5 kHz. The overall pulse repetition time was 5 sec. The samples were spun at 16 Hz and maintained at 30°C during data acquisition. The spectra were the sum of 128 transients. The chemical shift scale was referenced to the signal from TSP at 0.0 ppm.
Reduction of date from 1H-NMR analysis was carried out by binning the spectra into
0.05 ppm regions; i.e., each spectrum was divided into 0.05 ppm regions, and the total signal within each region was integrated between 0.0 ppm and 10 ppm. The region from 4.4 ppm to 5.5 ppm, which contained the residual signal from the water resonance, was excluded. This resulted in each spectrum being reduced to a vector of length 176.
2.2.5 Multivariate analysis
The data sets from 1H-NMR and GC-MS analyses were judged in all cases by
orthogonal projection on latent structure-discriminant analysis (OPLS-DA) using
SIMCA-P+ 12.0.1 (Umetrics, Sweden).
2.2.6 Fluorescence-based assay of cell respiration
13
to manufacturer’s protocol (Luxcel Biosciences, Cork, Ireland) and as described previously (40). Cultured cells were diluted with medium to the desired concentration (OD=1.0), and 150 L/well was dispensed into a 96-well plate (black body, flat bottom). An oxygen-sensitive probe supplied as dry powder in a vial, was reconstituted in 1 mL of water. Next, 10 L of this solution was transferred into each well, and the wells were then covered with 100 L of prewarmed (30°C) mineral oil to block ambient oxygen from the cells. Time-resolved measurements were carried out at 30°C on a Fusion -FP Microplate Analyzer (PerkinElmer Life Sciences, Waltham, MA, USA) using 400-nm excitation and 645-nm emission filters, reading every 1.5 minutes for 120 min. Oxygen consumption rates were assessed by determining the rate of increase in the probe fluorescent signal for each sample. Experiments were performed in triplicate.
2.3 Results
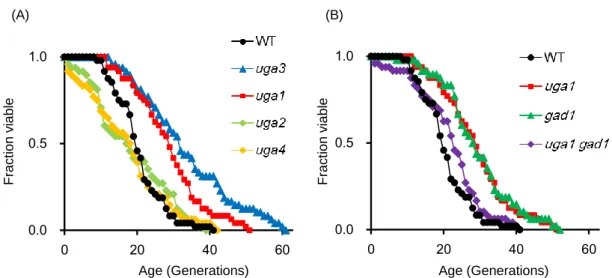
2.3.1 The UGA1 gene encoding GABA transaminase regulates replicative lifespan
Deletion of the UGA3 gene extends replicative lifespan; UGA3 deletion mutant budding yeast cells produce about 60% more buds than wild-type cells (30). The UGA3 gene encodes a zinc-finger transcription factor that is required for induction of UGA1,
UGA2, and UGA4 when GABA is present in culture medium (34,36). Even in the absence
of GABA, deletion of UGA3 down-regulates the basal transcription of UGA1 (36). Therefore, it was expected that down-regulation of the Uga3p target genes caused increased lifespan.
To determine whether UGA1, UGA2, and/or UGA4 were involved in aging, the replicative lifespan of each individual deletion mutant was measured (Figure 2.2A). Deletion of UGA1 resulted in an increase in an average replicative lifespan of approximately 40% compared with the wild-type strain BY4742, while no increase in lifespan was observed for uga2 or uga4 mutants. Therefore, it was concluded that the UGA1 gene, which encodes the GABA transaminase that deaminates GABA to succinate
semialdehyde, negatively regulated replicative lifespan. These findings suggested that longevity of the uga3 mutant was caused by transcriptional down-regulation of UGA1,
14
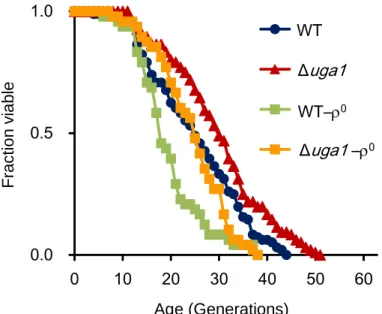
Figure 2.2 Replicative lifespans of cells carrying a deletion in UGA1 or GAD1, genes
encoding GABA-metabolizing enzymes. (A) Lifespan of deletion mutants of Uga3p target genes was determined. (B) Lifespan of the GAD1 deletion mutant and the UGA1
GAD1 double mutant was determined. Replicative lifespan was measured at least twice
for each strain, and one measurement for each strain is shown. Average lifespans: BY4742 (wild type, WT), 20.7 generations; uga3, 33.7; uga1, 28.9; uga2, 18.4; uga4, 17.4; gad1, 29.3; uga1 gad1, 21.9.
2.3.2 The GAD1 gene encoding glutamate decarboxylase regulates replicative lifespan
Because Uga1p catalyzes deamination of GABA, another GABA-metabolizing enzyme gene (GAD1) that encodes glutamate decarboxylase, which converts glutamic acid into GABA (41) (Figure 2.1), was investigated. Deletion of GAD1 resulted in an increase in average lifespan of approximately 40%, similar to that of UGA3 and UGA1 (Figure 2.2B). It was concluded that the GAD1 gene also negatively regulated replicative lifespan. These results indicated that the GABA-metabolizing enzyme genes, UGA1 and
GAD1, are aging genes.
The increase in lifespan associated with the UGA1 and GAD1 deletion mutants led to the speculation that these deletions may additively increase lifespan. Auga1 gad1
double deletion mutant strain was constructed by tetrad dissection and determined its replicative lifespan. Contrary to the expectation, lifespan of the double mutant was shorter than that of the uga1 and gad1 single mutants and comparable to that of the wild-type
strain (Figure 2.2B). 0.0 0.5 1.0 0 20 40 60 0.0 0.5 1.0 0 20 40 60 (A) (B) Fract ion v iab le Fract ion v iab le Age (Generations) Age (Generations)
15
2.3.3 Supplementation of GABA to culture media has no effect on lifespan
Addition of 0.1% GABA to culture media induces transcription of the UGA1, UGA2, and UGA4 genes (34,36), and replicative lifespan of the wild-type strain was measured on YPD plate medium supplemented with GABA. There was no significant difference between lifespan on GABA-containing and GABA-free media for wild-type cells. The mean lifespan on 0.1% GABA medium was 21.7 ± 8.9 generations and the maximal lifespan was 44 generations while the mean lifespan on YPD medium without GABA 22.4 ± 8.4 and the maximal lifespan 42. When GABA concentration was increased to 0.5%, the mean lifespan was 21.4 ± 7.2 generations and the maximal lifespan was 41 generations. Therefore, it was concluded that addition of GABA sufficient to activate transcription of the UGA structural genes had no effect on lifespan. Interestingly, increased transcription of the Uga3p target genes seemed not to affect lifespan, while deletion of UGA3 did. This result was similar to the case of a RAS1 deletion; RAS1 encodes a GTPase involved in G-protein signaling in the adenylate cyclase activating pathway. A RAS1 deletion increases lifespan, but overexpression of RAS1 does not result in a change in lifespan (42). There is no report indicating that GABA supplements extend lifespan in any organism, including yeast.
2.3.4 The metabolomic profile of GABA-metabolizing enzyme mutants correlates with replicative lifespan
To investigate the reason for the increase in lifespan of uga1 and gad1 cells, the
metabolites in the GABA metabolic pathway (GABA, glutamic acid, and succinic acid) in the long-lived (uga3, uga1, and gad1) and normal-lived (uga2, uga4, uga1 gad1, and wild type) strains were measured using GC-MS analysis. The intracellular
GABA levels of all deletion mutants except for uga2 were comparable to that of the
wild-type strain (Figure 2.3A). This result indicated that intracellular GABA levels did not regulate replicative lifespan. There was almost no difference in intracellular level of glutamic acid, the substrate of Gad1p, between strains; however, there was a slight decrease in uga3 single and uga1 gad1 double mutant cells (Figure 2.3B). This
16
Figure 2.3 Comparison of intracellular levels of GABA metabolites in mutants carrying
deletions of genes in the GABA metabolic pathway. (A) GABA. (B) glutamic acid. (C) succinic acid. Data are expressed as mean ± SEM. *P < 0.05 (n=5).
levels do not correlate with lifespan extension (30). Succinic acid levels were significantly lower in the UGA2 deletion mutant. Interestingly, the level of succinic acid in the long-lived uga1 and gad1 mutants was elevated (Figure 2.3C), suggesting that succinic acid
might be a key contributor to lifespan extension. Low levels of succinic acid in the long-lived uga3 mutant may be a consequence of down-regulating UGA2 expression.
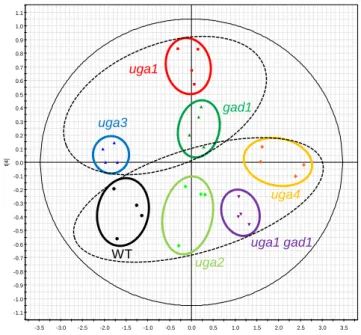
Analysis of levels of the metabolites in the GABA metabolic pathway did not reveal a striking correlation between longevity and metabolite levels in the UGA mutants; therefore, the whole-cell metabolite levels were surveyed by 1H-NMR-based metabolomic analysis. The cell extracts were prepared from mid-logarithmic phase yeast liquid cultures of the long-lived mutants (uga3, uga1, and gad1), mutants with
normal lifespans (uga2, uga4, and uga1 gad1), and the wild-type strain grown in
YPD and 1H-NMR analysis was performed independently four times (Appendix 1). The NMR-derived metabolomic profile was visualized by orthogonal projection on latent structure-discriminant analysis (OPLS-DA) (Figure 2.4). OPLS-DA score plot indicated that all four plots from each mutant strain coalesced into clusters. It was found that the clusters separated into two large groups and that group position along axis 4 correlated with lifespan. One group contained the three long-lived mutants, uga3, uga1,
andgad1. The other contained the strains with normal lifespans, uga2, uga4, uga1 gad1, and wild type. These results indicate that the GABA metabolic pathway mutants
0 1 2 3 4 0 0.5 1 1.5 0 0.5 1 1.5
-Aminobutyric acid Glutamic acid Succinic acid
(A) (B) (C) * * * * * * * *
17
Figure 2.4 Orthogonal projection on latent structure-discriminant analysis (OPLS-DA)
of 1H-NMR spectra of GABA metabolic pathway mutants. OPLS-DA score plot (axis 1 vs. axis 4) is indicated. Plots from each strain coalesced into a cluster as shown by a circle. OPLS axis 4 separated the clusters into two groups, the long-lived mutants (uga3, uga1
and gad1) and the strains with ordinary lifespans (wild type, uga2, uga4 and uga1 gad1), and each group is encircled by a dashed line.
have metabolomic profiles that correlate with replicative lifespan.
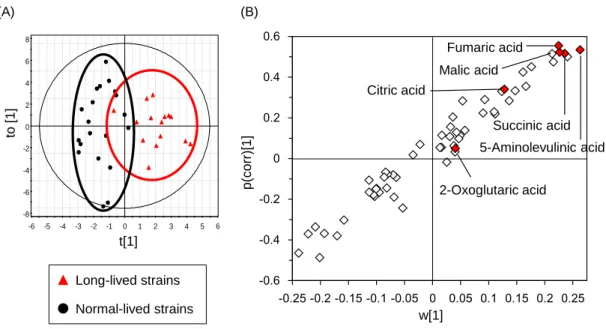
2.3.5 Tricarboxylic acid cycle intermediates contribute to lifespan extension
The above data indicated that succinic acid contributed to lifespan extension and that the metabolomic profile from 1H-NMR spectra correlated with longevity. To identify
other specific metabolites that may affect lifespan, 57 compounds were identified and measured by GC-MS analysis (Appendix 2) and correlations between levels of individual metabolites and replicative lifespan were examined. The GABA metabolic pathway mutants were classified into the long-lived and normal-lived mutants and OPLS-DA was performed using the GC-MS data (Figure 2.5). The scatter plot (S-plot) indicates levels of three neighboring TCA cycle intermediates (succinic acid, fumaric acid, and malic acid) positively correlated with lifespan extension; however, other TCA cycle intermediates (citric acid and 2-oxoglutaric acid) did not. Interestingly, 5- aminolevulinic acid, the first compound in the porphyrin synthesis pathway that leads to heme production,
-1.1 -1.0 -0.9 -0.8 -0.7 -0.6 -0.5 -0.4 -0.3 -0.2 -0.1 0.0 0.1 0.2 0.3 0.4 0.5 0.6 0.7 0.8 0.9 1.0 1.1 -3.5 -3.0 -2.5 -2.0 -1.5 -1.0 -0.5 0.0 0.5 1.0 1.5 2.0 2.5 3.0 3.5 t[ 4 ] t[1]
integration 4.4-5.5 single+uga1gad1.M3 (OPLS/O2PLS-DA) t[Comp. 1]/t[Comp. 4]
Colored according to classes in M3
R2X[1] = 0.331308 R2X[4] = 0.0306387
Ellipse: Hotelling T2 (0.95) SIMCA-P+ 12.0.1 - 2011-01-20 13:33:28 (UTC+9)
gad1 uga3 uga1 uga2 uga4 WT uga1 gad1
18
Figure 2.5 OPLS-DA of GC-MS metabolite profiles from GABA metabolic pathway
mutants. (A) Score plot and (B) Scatter plot (S-plot; loading (w[1]) vs. correlation (p(corr)[1])). Plot positions of TCA cycle intermediates (succinic acid, malic acid, fumaric acid, citric acid, and 2-oxoglutaric acid) and 5-aminolevulinic acid are indicated.
also positivelycorrelated with lifespan extension. Such a shift in carbon metabolism may cause the lifespan extension observed in uga1 and gad1 single mutants. Moreover, this
hypothesis is consistent with the observation that the TCA cycle intermediates and 5-aminolevulinic acid did not increase in the uga1 gad1 double mutant, which displayed
a normal lifespan.
2.3.6 Deletion of GABA-metabolizing genes does not increase respiration
Reportedly, calorie restriction extends replicative lifespan in budding yeast by increasing respiration (26). In yeast, when glucose levels are high, fermentation takes precedence over respiration. When glucose is limiting, respiration takes precedence and carbon is shunted to the mitochondrial TCA cycle, thereby increasing electron transport and respiration. The UGA1 and GAD1 deletions may have caused a shift in carbon metabolism toward the TCA cycle and increased respiration, as calorie restriction does.
To investigate this possibility, oxygen consumption rates of cells deleted for GABA-metabolizing genes, including UGA3, UGA1, and GAD1, were measured. Deletion of
-0.6 -0.4 -0.2 0 0.2 0.4 0.6 -0.25 -0.2 -0.15 -0.1 -0.05 0 0.05 0.1 0.15 0.2 0.25 p( corr )[ 1] w[1] 2-Oxoglutaric acid 5-Aminolevulinic acid Citric acid Succinic acid Malic acid Fumaric acid (A) (B) Normal-lived strains Long-lived strains -8 -6 -4 -2 0 2 4 6 8 -6 -5 -4 -3 -2 -1 0 1 2 3 4 5 6 to [1 ] t[1] 57metabolites x-1.M1 (OPLS/O2PLS-DA) t[Comp. 1]/to[XSide Comp. 1] Colored according to classes in M1
R2X[1] = 0.0822196 R2X[XSide Co mp. 1] = 0.210123 Ellipse: Hotelling T2 (0.95)
SIMCA-P+ 12.0.1 - 2015-01-04 12:23:20 (UTC+9)
to
[1]
19
Figure 2.6 Oxygen consumption measurement. Cells deleted for GABA metabolism
pathway genes (A) and carrying no mtDNA (0) or a deletion in HXK2 (B) were grown and assayed with 2% glucose YPD medium. Results shown here represent the average of 3 experimental trials.
these GABA-metabolizing genes did not alter the oxygen consumption rate (Figure 2.6A). The oxygen consumption rate of the strain lacking mitochondrial DNA (mtDNA) (
was decreased (Figure 2.6B). Deletion of HXK2, which encodes one of three hexokinases that introduce glucose into glycolysis, is expected to mimic the effect of growth in low glucose and has been shown to increase respiration rate (26). The oxygen consumption
rate of the hxk2 cells was increased compared with that of wild-type cells (Figure 2.6B).
These results indicated that deletion of UGA1 and GAD1 does not enhance mitochondrial respiration and does not cause lifespan extension through increasing TCA cycle intermediates.
2.3.7 Deletion of UGA1 extended lifespan independently of respiration
Since respiration of uga1 cells did not increase, deletion of UGA1 is supposed to
extend lifespan independently of respiratory activity. It has been reported that respiration-deficient cells experience shorter, not longer, lifespans (43). It was examined that whether
deletion of UGA1 gene in the mitochondrial respiratory dysfunction cells increase lifespan. Replicative lifespan of the uga1 strain lacking mtDNA was shorter than that of
the cells with intact mtDNA (Figure 2.7). Deletion of UGA1 in the cells lacking mtDNA 0
50 100 150 200
WT uga1 uga2 uga3 uga4 gad1
0 100 200 300 400 500 WT rho0 hxk2 Intensi ty ( R FU /m in) Inten si ty ( R F U /min ) (A) (B) 0
20
Figure 2.7 Replicative lifespans of cells without mtDNA. Lifespan of the
respiration-deficient cells with or without UGA1 deletion was determined. Average lifespans: BY4742 (wild type, WT), 25.2 generations; uga1, 30.1; WT-0, 19.6; uga1-0, 24.6. increased replicative lifespan compared with UGA1+cells, indicating that deletion of
UGA1 extends replicative lifespan independently of respiration.
2.3.8 Deletion of GABA-metabolizing genes extended lifespan in SIR2-dependent manner
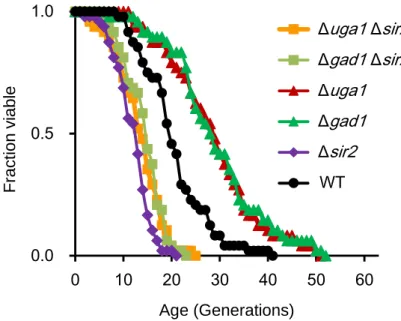
Lifespan extension by deletion of UGA1 did not required respiratory function. Reportedly, one mechanism by which calorie restriction extends the replicative lifespan is activation of Sir2p, an NAD+-dependent deacetylase, through shift in carbon metabolism toward the TCA cycle and by increased respiration (26). To examine the possibility that the UGA1 and GAD1 deletions cause activation of Sir2p to result in lifespan extension, the effect of deletion of the SIR2 gene on lifespan extension by deletion of UGA1 and GAD1 was tested (Figure 2.8). The uga1 sir2 and gad1 sir2
strains showed short lifespan comparable with sir2 strain. These results revealed that SIR2 is required for lifespan extension by deletion of UGA1 and GAD1. This suggested
that deletion of UGA1, probably also GAD1, might activate Sir2p function to extend lifespan independently of respiration.
Fract ion v iab le Age (Generations) 0.0 0.5 1.0 0 10 20 30 40 50 60 WT Δuga1 WT-ρ0 Δuga1-ρ0Δuga1 –0 Δuga1 WT WT–0
21
Figure 2.8 The effect of deletion of the SIR2 gene on lifespan extension by deletion of
UGA1 and GAD1. Average lifespans: BY4742 (wild type, WT), 20.7 generations; uga1,
28.9; gad1, 29.3; sir2, 12.1; uga1 sir2, 13.6; gad1 sir2, 14.6.
2.4 Discussion
Previous study showed that deletion of the UGA3 gene—which encodes a zinc-finger transcription factor necessary for GABA-dependent induction of the UGA1, UGA2, and UGA4 genes—extends replicative lifespan in the budding yeast. Here, it was found that deletion of UGA1 and GAD1, like UGA3, lengthened the lifespan, indicating that the two genes in the GABA metabolism pathway were lifespan-related genes. Multivariate analysis of 1H-NMR spectra for the whole-cell metabolite levels demonstrated a separation between long-lived and normal-lived strains. GC-MS analysis of identified metabolites showed that levels of TCA cycle intermediates positively correlated with lifespan extension. Respiration was not enhanced in the long-lived uga1 and gad1
strains. Lifespan extension by deletion of UGA1 and GAD1 required yeast sirtuin SIR2 gene. These results suggest that reduced activity of the GABA-metabolizing enzymes extends lifespan through activation of Sir2p function independently of respiration.
Metabolome analysis in the GABA-related gene deletion mutants indicates levels of some TCA cycle intermediates (succinic acid, fumaric acid, and malic acid) positively correlated with lifespan extension, suggesting that respiration is enhanced in the long-
0.0 0.5 1.0 0 10 20 30 40 50 60 uga1 sir2 gad1 sir2 uga1 gad1 sir2 WT Δuga1 Δsir2 Δgad1 Δsir2 Δuga1 Δgad1 Δsir2 F rac ti on v iab le Age (Generations) WT
22
Figure 2.9 Model of lifespan regulation by GABA metabolic enzyme genes. (A) Model
of lifespan extension by calorie restriction. Calorie restriction causes the shunting of carbon metabolism toward the mitochondrial TCA cycle to increase respiration. Enhanced respiration increases the cellular NAD+, and an NAD+-dependent deacetylase Sir2p belonging to the sirtuin family acts as a master regulator of anti-aging. (B) Model of lifespan regulation by Uga1p and Gad1p. Deletion of UGA1 and GAD1 results in increase of NAD+ content or activation of Sir2p independent of respiration.
lived mutants. However, respiration was not increased in the long-lived mutants. This is different from a mechanism for lifespan extension by calorie restriction, which increases another TCA cycle intermediates (citric acid and 2-oxoglutaric acid) to enhance respiration. As the other mechanism for lifespan extension by deletion of UGA1 and
GAD1, Uga1p and Gad1p seem to inhibit Sir2p activity downstream of respiration (Figure
2.9). Since Sir2p activity is dependent on NAD+ content, deletion of UGA1 and GAD1 would increase NAD+ content in an unknown manner. Since malic acid content accumulates slightly in the uga1 and gad1 cells, conversion of oxaloacetic acid into
malic acid is supposed to be enhanced, resulting in increase of content of NAD+ (44). This study is the first to demonstrate that a GABA transaminase gene regulated aging, although there are age-related changes in GABA transaminase (GABA-T) immunoreactivity in the hippocampus and dentate gyrus of the gerbil, a burrowing
Calorie restriction Sir2p Longevity Respiration TCA cycle NAD+ Respiration Sir2p Longevity NAD+ TCA cycle ? Uga1p Gad1p (A) (B)
23
mouse-like rodent (45). GABA-T protein content is elevated in gerbils in postnatal month 12, but levels decreased after that point. The GABA transaminase UGA1 gene is upregulated between the 7th and 11th generations as described in Chapter 3 although it is unclear which generation in yeast is equivalent to the postnatal month 12 of the gerbil.
In human visual cortex, expression of the GABA synthesizing enzyme (GAD65), which is the homolog of yeast Gad1p, increases from early in life to the teen and adult years, and GAD65 levels decline in older adults (46). Similarly, the expression of yeast
GAD1 gene is increased in the early stage of cellular senescence as described below. Since
transcription of the GAD1 gene is regulated by Mtl1p, which activates general stress response during glucose starvation and oxidative stress via the transcription factor Msn2p/Msn4p (47), glutamate decarboxylase Gad1p might regulate lifespan in response to nutrient limitation and/or oxidative stress with aging.
2.5 Summary
Many of the genes involved in aging have been identified in organisms ranging from yeast to human. Previous study showed that deletion of the UGA3 gene—which encodes a zinc-finger transcription factor necessary for GABA-dependent induction of the UGA1,
UGA2, and UGA4 genes—extends replicative lifespan in the budding yeast Saccharomyces cerevisiae. In this chapter, it was found that deletion of UGA1 lengthened
the lifespan, as did deletion of UGA3; in contrast, strains with UGA2 or UGA4 deletions exhibited no lifespan extension. Deletion of GAD1 also increased lifespan. Therefore, two genes in the GABA metabolism pathway, UGA1 and GAD1, were identified as aging genes. Unexpectedly, intracellular GABA levels in mutant cells (except for uga2 cells)
did not differ from those in wild-type cells. Addition of GABA to culture media, which induces transcription of the UGA structural genes, had no effect on replicative lifespan of wild-type cells. Multivariate analysis of 1H-NMR spectra for the whole-cell metabolite levels demonstrated a separation between long-lived and normal-lived strains. GC-MS analysis of identified metabolites showed that levels of TCA cycle intermediates positively correlated with lifespan extension, but respiration was not enhanced in long-lived strains. Lifespan extension due to uga1 and gad1 required yeast sirtuin gene,
24
SIR2. These results suggest that reduced activity of the GABA-metabolizing enzymes
25
Chapter 3
Transcriptomic and metabolomic analyses during the early stage of replicative cellular senescence
3.1 Introduction
In the previous study described by Yoshida et al. (30) and in Chapter 2, metabolomic profiling indicated correlated compounds, following identification of lifespan-related genes.These metabolomic analyses were performed by using cells in logarithmic growth phase, in which most of the cells dose not undergo cell divisions. It was surprised that metabolome data from such young cells led to the candidates of replicative lifespan-related genes. Furthermore, metabolic information of cells during the process of aging is considered to be more valuable for understanding lifespan determination.
A lot of changes in physiological phenomena during cellular senescence have been demonstrated. In mammals, senescent cells exhibit an enlarged and flattened cellular morphology and an increase in the production of reactive oxygen species (ROS) (13,15). Some of these age-related cellular phenomena are explained by time-series gene expression profiles; the senescent process is divided into four stages (early, middle, advanced, and very advanced), with specific genes being prominently expressed at each of these stages (16). Yeast cells age as they undergo division, as do cultured mammalian cells: their size increases, their shape is altered, their cell cycle slows down, and they become sterile (19). Furthermore, the nucleolus of aged yeast cells tends to be larger and/or more fragmented, and the mitochondria become dysfunctional (19,20). The rate of protein synthesis and ribosome activity decrease linearly with age (21). In mother cells during the budding process, oxidative stress, protein aggregation, and extrachromosomal rDNA circles (self-replicating circles of ribosomal DNA) accumulate and cause senescence (20).
Several transcriptome analyses comparing old cells with young cells have shown pathway changes in expression during replicative aging (25,48-50). In all cases, a shift from glycolysis toward gluconeogenesis and energy storage (glyoxylate cycle, lipid
26
metabolism and glycogen production) was observed in old cells. In addition, the expression of ribosome genes, and genes involved in protein synthesis, folding, and degradation, all decreased (49,50). Besides changes in metabolic gene expression, environmental stress response genes were induced in aged cells (25) although oxidative stress gene expression did not change (49). Genes involved in DNA damage repair, such as homologous recombination and nucleotide excision repair, were also induced in old cells (25,50). These transcriptome studies examined 18-20-generation-old yeast cells (i.e., approaching the end of an average lifespan) prepared by using biotin-streptavidin technology or a centrifugal elutriator (25,49,50). About half the population of cells is dead by the average generation time, so the transcriptome data from the 18th-20th-generation cells may contain information from dead cells. Alternatively, the removal of old cells with an average lifespan might result in losing information from dead cells, since yeast cells lyse at the end of their lifespan (25).
There may be few investigations focusing on the early stage of replicative aging cells. To determine what change initiates the aging process, metabolomic and transcriptomic profiles of yeast cells at the 1st, 4th, 7th, and 11th generation were generated. Distinctive changes in transcription appeared after 11 generations: decreased amino acid biosynthesis, and increased sugar and TCA cycle metabolism. These transcriptional changes were confirmed at the metabolite level. Moreover, the expression of stationary phase-induced genes was highly enhanced after 11 generations, despite the presence of adequate nutrients in the medium. These observations suggest that nutrient sensing and/or signaling begin to deteriorate in the early stage of replicative senescence.
3.2 Materials and methods
3.2.1 Strains and media
S. cerevisiae strains used in this study were BY4742 (MAT ura30 leu20 his31 lys20) (51) and X2180-1A (MATa SUC2 mal mel gal2 CUP1) (52). Yeast extract (1%),
27
3.2.2 Replicative lifespan determination
Replicative lifespan was assayed with minor modifications as described in Chapter 2. Yeast cells were thawed from frozen stocks and streaked onto YPD agar plates. After 2 days, a single colony was transferred to a fresh YPD agar plate, and cells were grown overnight. A sample was spread onto a new YPD agar plate containing 10 μg/mL phloxine B. Using a micromanipulator, 48 cells were arrayed on a YPD plate and allowed to undergo 1 or 2 divisions. Virgin cells were then selected and subjected to lifespan analysis. Except during manipulation, plates were sealed with Parafilm, incubated at 30°C during the day and stored at 4°C at night to avoid excessive budding. Daughter cells were removed by gentle agitation with a dissecting needle and scored every 2 h. For each of the 48-cell lines, buds from each mother cell were counted until division of living cells ceased or cells were stained with phloxine B.
3.2.3 Isolation of old yeast cells
Isolation of old cells was performed as described previously (53). Cells were grown in YPD medium to OD600 of 1.0. 5107 cells were spun, washed with 1PBS (137 mM
NaCl, 2.7 mM KCl, 10 mM Na2HPO4, and 1.8 mM KH2PO4), and resuspended in 0.2 mL
of 1PBS. Separately, 4.0 mg of EZ-Link Sulfo-NHS-LC-Biotin (Thermo Scientific, Rockford, IL, USA) was dissolved in 0.15 mL of 1PBS at room temperature and added to the cell suspension. The mixture was shaken for 15 min by vortexing at a slow setting at room temperature. Cells were then spun and washed three times with 1 mL of 1PBS. Biotin-labeled cells were then diluted and grown in YPD until the 4th or 7th generation, then spun down and resuspended in 20 mL of cold 1PBS. Dynabeads Biotin Binder (Invitrogen, Carlsbad, CA, USA) were added, 4 beads per biotinylated cell. Cells and beads were rotated for 2 h at 4°C, then the suspension was placed in a test tube in a DynaMag-50 magnet (Invitrogen) at 4°C. After 20 min, the supernatant was carefully aspirated, 10 mL of cold YPD was added, and the mixture was gently agitated. The cells were again placed in the sorter for 15 min, and the process was repeated seven times. For the 11th generation cells, the isolated 7th generation cells were grown in YPD for four generations and the sorting procedure was repeated. The average bud scar count of each
28
sorted cell population was determined by staining an aliquot with fluorescent brightener 28 (MP Biomedicals, Illkirch, France) and counting bud scars under a fluorescence microscope.
3.2.4 Microarray analysis and reverse transcription quantitative polymerase chain reaction (RT-qPCR)
Total RNAs were isolated from yeast cells using an RNeasy Mini Kit (Qiagen, Valencia, CA, USA). Antisense RNA was synthesized and labeled with Cy3 for the 4th, 7th, and 11th generation and with Cy5 for the 1st generation. Each mixture of Cy3- and Cy5-labeled antisense RNA was hybridized on a 3D-Gene Yeast Oligo Chip 6K (Toray, Kanagawa, Japan). The hybridized array was scanned with a 3D-Gene Scanner 3000 (Toray). The average intensity of the background was subtracted from the detected signals, then the sample values were determined by the global normalization method (Cy3/Cy5 ratio median=1). Genes with Cy3/Cy5 normalized ratios greater than 2.0 or less than 0.5 were defined, respectively, as up- or down-regulated genes. For the 7th/4th, 11th/4th, and 11th/7th ratios, correction factors were calculated as the ratios between the global normalization values of the 1st generation of each array measured, and used for normalization of the ratios of the designated ages. The microarray data are available from the NCBI Gene Expression Omnibus (accession number GSE59797).
Extracted total RNAs were subjected to cDNA synthesis using a PrimeScript RT Master Mix (Takara, Shiga, Japan) with random primers. Quantitative PCR was carried out using a SYBR Premix Ex Taq II (Takara) on a Thermal Cycler Dice (Takara). The expression level was normalized to that of the UBC6 gene.
3.2.5 Metabolome analysis
Samples for quantifying intracellular metabolites in yeast were prepared as described previously (30) with minor modifications. The dried yeast cells were resuspended in 1 mL of a single phase solvent mixture of methanol/water/chloroform (2.5:1:1 v/v/v) and 40 L of a ribitol solution (8 g/mL) as the internal standard, then homogenized and disrupted in a ball mill at 20Hz for 3 min. The extraction was carried out at 37°C for 30
29
min with vigorous shaking (1,200 rpm). After centrifugation at 12,000 rpm for 3 min, the supernatant (900 L) was transferred to a new 1.5 mL microfuge tube and mixed with 400 L of water. After centrifugation, 1 mL of the supernatant was placed in a vacuum for 4 h and dried in a freeze-dryer until dry. Derivatization of hydrophilic metabolites was carried out at 30°C for 90 min with 100 L of methoxyamine hydrochloride in pyridine (20 mg/mL) and subsequently at 37°C for 30 min with 50 L of N-methyl-N-(trimethylsilyl)trifluoroacetamide (MSTFA). To analyze the compounds in the growth medium, yeast cell cultures were centrifuged (13,000 rpm, 3 min) and the supernatant was filtered through a Millex-LG filter (0.20 m, hydrophilic, PTFE) (Millipore, Billerica, MA, USA). Supernatant (20 L) was mixed with 1 mL of methanol/water/chloroform with ribitol (1 g/mL) and incubated at room temperature for 10 min. The hydrophilic phase was dried as described above. Derivatization was carried out with 50 L of methoxyamine hydrochloride and 25 L of MSTFA. GC-MS analysis was performed as described previously (30), independently 4 times for each generation. Compounds that are not distinguishable from each other by GC-MS analysis, such as pyruvic acid and oxaloacetic acid, are described as pyruvic acid + oxaloacetic acid.
3.2.6 Multivariate analysis
GC-MS data was processed as described previously (30) and judged by principal component analysis (PCA) using the SIMCA-P+ program, version 12.0.1 (Umetrics, Malmö, Sweden).
3.3 Results
3.3.1 Experimental concepts for the early stage of replicative senescent cells
Wild-type haploid cells of S. cerevisiae, such as BY4742 strain, had a replicative median lifespan of 24 generations and a maximum lifespan of 43 generations (Figure 3.1). Transcriptome analysis of 18-20-generation-old wild-type cells was previously reported and showed that cellular aging is associated with a shift toward gluconeogenesis and energy storage, and a response to genome instability (25,50). The transcripts at this age, however, might include information from dead cells or exclude information from lysed
30
Figure 3.1 Early stage of replicative senescence in budding yeast cells. Cells of wild-type
BY4742 strain have a replicative median lifespan of 24 generations, with a maximum of 43 generations. The transcriptome and metabolome of young cells (1st generation) and old cells at early stages of replicative senescence (4th, 7th, and 11th generation) were analyzed. Before 11 generations (blue arrow), almost all the cells were viable.
cells. To characterize cellular aging processes in the absence of dead cells, and to determine when cellular aging behavior begins, an earlier stage of replicative cellular senescence (approximately 10 generations), when most cells are alive (Figure 3.1) was focused. Therefore, synchronized cultures of young cells (1st generation) and older cells (4th, 7th, and 11th generation) were assessed for changes in transcription and metabolism as cells approach senescence.
Wild-type cells of designated ages were isolated by labeling the surface of mother cells with biotin and sorting the senescent cells using streptavidin-magnetic beads. Bud scars on the isolated cells of designated ages were counted to determine their generation under a fluorescence microscope after staining the cells with calcofluor (Figure 3.2). Cells from the 1st generation fraction had no bud scar (unbudded) or 1-2 bud scars, while cells from the 4th generation fraction had 3-6 bud scars. Cells from the 7th and 11th generation fractions had the highest number of bud scars, around 7 and 11, respectively. These cell fractions were used for DNA microarray and GC-MS analyses, as described below.
0th 4th 7th 11th Median lifespan (24 generations) 0.0 0.5 1.0 0 10 20 30 40 Fr a c tion v iab le Age (Generations) Maximum lifespan (43 generations) 1st early stage …. Cell death
31
Figure 3.2 Distribution of young and old cells, isolated by generation. (A-F) Cell
fractions containing the 1st, 4th, 7th and 11th generations were collected and the bud scars on cells from each fraction were stained with calcofluor. (A) Images the cells with stained bud scars from each fraction. The number of bud scars per cell was counted under a fluorescence microscope. The average number of bud scars per cell was 0.9 in the 1st fraction (B), 4.8 in the 4th fraction (C), 7.3 in the 7th fraction (D), and 10.2 in the 11th fraction (E). These cell fractions were used for transcriptomic analysis. (F) Metabolomic analysis was conducted on four independently-prepared cell fractions for each generation studied. The average number of bud scars per cell was 1.0 in the 1st fraction, 4.7 in the 4th fraction, 6.8 in the 7th fraction, and 11.1 in the 11th fraction.
0 10 20 30 Num be r o f c el ls 0 10 20 30 Num be r o f c el ls 0 10 20 30 Num be r o f c el ls 0 10 20 30 Num be r o f c el ls (B) (C) (D) (E) (F) 0 10 20 30 Num be r o f c el ls 0 10 20 30 Num be r o f c el ls 0 10 20 30 Num be r o f c el ls 0 10 20 30 Num be r o f c el ls 1st 4th 7th 11th
Number of bud scars Number of bud scars
Number of bud scars Number of bud scars
Number of bud scars Number of bud scars
Number of bud scars Number of bud scars
#1 #2 #3 #4 1st 4th 7th 11th (A)
32
3.3.2 Outline of transcriptomic changes in an age-dependent manner
Transcriptome analysis was performed by probing a DNA microarray with total RNAs extracted from the 1st, 4th, 7th, and 11th generation cells. A scatter plot of the transcriptomes of cells of designated ages versus that of the 1st generation showed moderate increases and decreases in transcripts by the 7th generation, and drastic up- and down-regulation after 11 generations (Figure 3.3A-C). The number of genes regulated in an age-dependent manner was compared between successive time points, using a threshold of a minimum two-fold change in transcript level relative to the 1st generation (Figure 3.3F and G). After 4 generations, up- and down-regulation was observed for 538 and 557 genes, respectively, for a total of about 20% of the genes in the whole genome; few further changes were observed by the 7th generation (590 and 572 genes). Genes whose expression commonly changed at the 4th and 7th generation constituted a major group among the respective generations (blue and orange bars in Figure 3.3F and G): up-regulated genes, 85% (455/538) at the 4th generation and 77% (455/590) at the 7th generation; down-regulated genes, 79% (439/557) at the 4th generation and 77% (439/572) at the 7th generation. Interestingly, after 11 generations, further up- and down-regulation was observed for 353 and 348 genes, respectively (red bars).
Large changes in the transcriptome from the 1st to the 4th generation, and small changes between the 4th and 7th generations, were observed as described above. The striking changes between the 1st and 4th generations seemed to reflect differences between non-budded (never experienced cell division) and budded cells, rather than a generation gap, since about half of the 1st generation comprised non-budded cells but all of the 4th generation cells had previously budded (Figure 3.2). To exclude transcriptional information derived from non-budded cells, transcriptomic profiles of cells of designated ages were compared with those of the 4th generation instead of the 1st generation. The scatter plot clearly showed few changes in the transcriptome of the 7th vs. 4th generation (Figure 3.3D), but large changes between the 11th and 4th generation (Figure 3.3E). These data reveal that cellular senescence can be detected as changes as early as 11 generations (i.e., at about half the median lifespan).
33
Figure 3.3 Outline of transcriptional changes occurring in an age-dependent fashion.
(A-E) Scatter plots of the transcriptomes of cells; the ages being compared are indicated on each axis. Red lines indicate that the Y-coordinate/X-coordinate ratio is 0.5 or 2. (F and G) Bar graph and Venn diagram for the number of up- and down-regulated genes during the early stages of cellular aging. The number shown in the lower right corner of each Venn diagram is the number of genes whose expression was unchanged during senescence.
3.3.3 Pathways that are transcriptionally changed during the early stage of cellular senescence
To explore the functions of genes whose transcript levels change with age, the up- and down-regulated genes were sorted into categories defined by the GenMAPP database (http://www.genmapp.com/). First, genes whose transcript levels in old generations changed relative to the 1st generation were focused (Table 3.1). Few differences in pathways between the 4th and 7th generations were found; cells in the 4th and 7th generation had accumulated the same transcripts coding for aromatic amino acid (tryptophan and phenylalanine) degradative enzymes and enzymes for the biosynthesis
0 200 400 600 800 4th 7th 11th 0 200 400 600 800 4th 7th 11th (F) Up-regulation N um ber of genes Generation (G) Down-regulation Generation N um ber of genes 4th 7th 11th 53 103 39 352 30 96 353 4747 4th 7th 11th 92 85 51 354 26 82 348 4568 4th 7th 11th 4th 7th 11th 4th, 7th and 11th common to 4th and 7th 4th and 11th 7th and 11th 4th specific to 7th 11th (A) (B) (C) (D) (E) log (7t h) log (1st) log (4t h) log (1st) log (11t h) log (1st) log (7t h) log (11t h) log (4th) log (4th)
34
of sulfur amino acids (cysteine and methionine). The levels of mRNAs coding for ribosomal proteins and enzymes involved in biosynthesis of purine and pyrimidine were decreased after both the 4th and 7th generations, suggesting that the levels of ribosomal proteins and nucleic acids are higher in young cells than in old cells.
Next, pathways in which transcription changed in the 7th and 11th generation relative to the 4th generation were searched (Table 3.2). This pathway analysis clearly showed that very few pathways were changed between the 4th and 7th generations, but several biological processes and metabolic pathways were strikingly enhanced or reduced after 11 generations. Cells in the 11th generation had accumulated transcripts coding for components of the sugar metabolism and TCA cycle, consistent with previous observation of a shift from glycolysis toward gluconeogenesis in old cells (25). Unlike previous reports, this pathway analysis clearly indicates that amino acid degradation pathways were enhanced and biosynthetic pathways of branched-chain amino acid (BCAA: leucine, isoleucine, and valine) were decreased.
Previous transcriptome analyses of older cells (~20 generations) reported that environmental stress response pathways were induced in aged cells (25) although oxidative stress gene expression did not change (49). Pathway analysis in this study, however, showed no significant change in the stress response pathways of old cells, including the oxidative stress response pathway. Similarly, there were no changes in the DNA damage repair pathways, which were reported to be induced in old cells (25,50). Thus, the stress response and DNA damage repair pathways are not induced during the early stages of senescence. It was previously reported that ribosome gene expression decreased in 18-20-generation-old cells (50). However, transcriptome analysis in this study showed that the pathway for ribosomal protein expression was reduced by the 4th generation compared to unbudded cells, but was not further reduced after another 4 generations; conversely, young cells have a higher level of protein synthesis which decreases even in the early stages of aging.
35
Table 3.1 Pathway analysis with transcriptomic data relative to the 1st generation.
Name a Number Changed b Number Measured c Number On MAPP d Percent Changed e Percent
Present f Z Score g Permute P h Adjusted P i
Increased 4th Tryptophan degradation 5 12 16 41.7 75.0 4.17 0.00 0.22 Phenylalanine degradation 5 11 14 45.5 78.6 4.45 0.00 0.19 Glycerolipid metabolism 11 54 106 20.4 50.9 3.23 0.00 0.65 m-Cresol degradation 3 6 10 50.0 60.0 3.68 0.01 0.39 p-Cymene degradation 3 6 13 50.0 46.2 3.68 0.01 0.39 Toluene degradation 3 6 12 50.0 50.0 3.68 0.01 0.39
Fatty acid metabolism 5 17 38 29.4 44.7 3.14 0.01 0.66
Phospholipid biosynthesis 3 8 13 37.5 61.5 2.98 0.02 0.91
Sulfur amino acid biosynthesis 4 14 29 28.6 48.3 2.74 0.02 0.93
Phosphatidic acid and phospholipid biosynthesis 4 15 32 26.7 46.9 2.56 0.04 0.95
Fatty acid oxidation 3 10 16 30.0 62.5 2.47 0.04 0.97
Butanoate metabolism 6 29 69 20.7 42.0 2.41 0.04 0.97 7th Glycerolipid metabolism 11 54 106 20.4 50.9 3.53 0.00 0.47 Phenylalanine degradation 4 11 14 36.4 78.6 3.56 0.01 0.46 Toluene degradation 3 6 12 50.0 50.0 3.88 0.01 0.32 p-Cymene degradation 3 6 13 50.0 46.2 3.88 0.01 0.32 m-Cresol degradation 3 6 10 50.0 60.0 3.88 0.01 0.32 Tryptophan degradation 4 12 16 33.3 75.0 3.33 0.02 0.58
Sulfur amino acid biosynthesis 4 14 29 28.6 48.3 2.93 0.02 0.91
Glutamate degradation I 2 3 6 66.7 50.0 3.82 0.02 0.42
Butanoate metabolism 6 29 69 20.7 42.0 2.63 0.02 0.98
Aminophosphonate metabolism 3 11 20 27.3 55.0 2.43 0.04 0.99
Fatty acid metabolism 4 17 38 23.5 44.7 2.45 0.04 0.99
11th
Principle pathways of carbon metabolism 21 79 98 26.6 80.6 4.36 0.00 0.06
Citrate cycle (TCA cycle) 10 30 40 33.3 75.0 3.82 0.00 0.38
Glutamate degradation I 3 3 6 100.0 50.0 4.83 0.00 0.04 Toluene degradation 4 6 12 66.7 50.0 4.27 0.00 0.07 p-Cymene degradation 4 6 13 66.7 46.2 4.27 0.00 0.07 m-Cresol degradation 4 6 10 66.7 60.0 4.27 0.00 0.07 Glycolysis / Gluconeogenesis 13 47 65 27.7 72.3 3.56 0.00 0.46 Butanoate metabolism 9 29 69 31.0 42.0 3.36 0.00 0.59 Galactose metabolism 9 30 55 30.0 54.5 3.24 0.00 0.60 Glycerolipid metabolism 13 54 106 24.1 50.9 2.98 0.00 0.74
Fatty acid metabolism 6 17 38 35.3 44.7 3.12 0.01 0.65
Fructose and mannose metabolism 9 32 79 28.1 40.5 3.01 0.01 0.74
Phospholipid biosynthesis 4 8 13 50.0 61.5 3.44 0.01 0.52
Nucleotide sugars metabolism 5 14 39 35.7 35.9 2.87 0.02 0.80
Phosphatidic acid and phospholipid biosynthesis 5 15 32 33.3 46.9 2.68 0.03 0.85
Glutamate biosynthesis 3 7 14 42.9 50.0 2.62 0.03 0.89
Glutamate metabolism 7 27 42 25.9 64.3 2.39 0.03 0.99
36
a Gene ontology term
b The number of genes meeting the criterion at this node c The number of genes measured at this node
d The number of genes associated with this node
e The percentage of genes meeting the criterion in this node f The percentage of genes measured in this node
g The z score under the hypergeometric distribution
h The p value calculated using a non-parametric bootstrapping approach
i The p value using the Westfall-Young adjustment for multiple hypothesis testing
Table 3.1 Continued Name a Number Changed b Number Measured c Number On MAPP d Percent Changed e Percent
Present f Z Score g Permute P h Adjusted P i
Reduced 4th
Cytoplasmic ribosomal proteins 44 110 110 40.0 100.0 8.50 0.00 0.00
One carbon pool by folate 9 14 25 64.3 56.0 5.62 0.00 0.00
Superpathway of histidine, purine, and pyrimidine 14 38 58 36.8 65.5 4.30 0.00 0.09
Glycine degradation 3 4 11 75.0 36.4 3.62 0.01 0.38
De novo biosynthesis of purine nucleotides 7 21 37 33.3 56.8 2.70 0.02 0.87
Histidine metabolism 6 21 45 28.6 46.7 2.06 0.04 1.00
De novo biosynthesis of pyrimidine ribonucleotides 4 10 18 40.0 55.6 2.48 0.04 0.94
7th
Cytoplasmic ribosomal proteins 55 110 110 50.0 100.0 10.37 0.00 0.00
Superpathway of histidine, purine, and pyrimidine 14 38 58 36.8 65.5 3.68 0.00 0.17
One carbon pool by folate 9 14 25 64.3 56.0 5.06 0.00 0.01
De novo biosynthesis of pyrimidine
ribonucleotides 5 10 18 50.0 55.6 3.02 0.01 0.71 Glycine degradation 3 4 11 75.0 36.4 3.29 0.01 0.63 Protein modifications 5 11 15 45.5 73.3 2.75 0.01 0.78 Arginine degradation 3 4 13 75.0 30.8 3.29 0.01 0.63 Glucose fermentation 9 27 41 33.3 65.9 2.58 0.02 0.90 Glycolysis 6 16 27 37.5 59.3 2.44 0.02 0.95
De novo biosynthesis of purine nucleotides 7 21 37 33.3 56.8 2.27 0.04 0.98
Riboflavin metabolism 5 13 19 38.5 68.4 2.30 0.04 0.98
Salvage pathways of pyrimidine ribonucleotides 3 6 18 50.0 33.3 2.34 0.04 0.97
11th
Cytoplasmic ribosomal proteins 62 110 110 56.4 100.0 8.09 0.00 0.00
One carbon pool by folate 10 14 25 71.4 56.0 4.11 0.00 0.02
Superpathway of histidine, purine, and pyrimidine 19 38 58 50.0 65.5 3.72 0.00 0.06
Glycine degradation 4 4 11 100.0 36.4 3.52 0.00 0.17
Cytoplasmic tRNA synthetases 11 19 19 57.9 100.0 3.42 0.00 0.19
Threonine biosynthesis 4 5 11 80.0 45.5 2.90 0.01 0.63
De novo biosynthesis of pyrimidine
ribonucleotides 6 10 18 60.0 55.6 2.63 0.02 0.74
De novo biosynthesis of purine nucleotides 10 21 37 47.6 56.8 2.49 0.03 0.83
Protein modifications 6 11 15 54.5 73.3 2.34 0.03 0.99
Asparagine biosynthesis 3 4 9 75.0 44.4 2.36 0.04 0.99
Nitrogen metabolism 8 17 69 47.1 24.6 2.19 0.05 0.99