わが国の国際収支における中長期的な分析
2004 年 3 月
はしがき
本報告書は、「わが国の国際収支における中長期的な分析に関する研究会」(平成 15 年度)に際して報告された内容に関し、同研究会における委員ならびに外部講師の方々 に論文をご執筆いただき、とりまとめたものである。 わが国の国際収支の特徴は、長期にわたる経常収支黒字である。近年、この黒字幅が 縮小傾向にあり、赤字化も懸念されるところであったが、その傾向は収まりをみせ、2002 年度には半導体などのアジア向け輸出の好調さにより貿易黒字に膨らみがもたされ 4 年ぶりに経常黒字が増加に転じた。2003 年(暦年)も引き続き輸出が好調なことによ り、2 年連続で年間の黒字幅が拡大となり、1998 年以来 5 年ぶりの過去最高額を更新す るに至っている。 しかし、その内訳には、従来との変化がみられる。経常収支のうち貿易収支が大きな 割合を占めていたところであったが、昨今は、対外投資資産の累積による収益の増加に より、所得収支が安定的な伸びをみせ、貿易収支と同等の割合を示すようになってきて いる。また、貿易サービス収支のうち、貿易以外の収支項目として、サービス収支の内 訳も注目される。旅行収支や輸送収支では、世界情勢の影響を受け赤字幅に増減がみら れるが、その他サービスのうち特許等使用料の受取支払については黒字に転じる傾向に ある。TRIPS 協定の適用などにより世界全体で知的財産権の保護の動きが強まり、技術 貿易が促進されていることからも、技術輸出によるロイヤリティーの受取の増加に期待 がもたれる。また、先進諸国におけるサービス分野の発展により、欧米では国際競争力 を持ったサービス産業の成長が著しく、国際間取引の多様化に伴い、国際収支への影響 が予測されるところである。 経常収支の黒字幅の縮小に際しては、わが国の国際競争力の低下と危惧する見方もあ る。しかし、経常収支の動向は、短期的な景気循環による影響と、長期的な構造的要因 による影響の 2 つの側面に基づくものであり、わが国を取り巻く世界経済の影響などの 短期的要因と、いわゆる IS バランス論による国内の貯蓄と投資の差額に表されるよう に、貯蓄率や投資率、財政収支の状況、少子高齢化による人口構成の変化等の動向に関 する中長期的な視点からの分析が必要となる。昨今の経常収支の推移においては、短期 的な循環的側面としては、アジア通貨危機以降、米国での同時多発テロ、イラク攻撃や SARS の発生など刻々と変化する世界環境による国内景気への影響が指摘される。国際 収支上では、こうした状況の影響が輸出入にみられ、また、サービス収支のうちの旅行 収支、輸送収支への影響をもたらしている。一方、長期的な構造的要因としては、グロ ーバリゼーションの進展とともに国際分業における貿易パターンの変化が生じ、相対的 に安価な生産コストを求め対外直接投資を通じてアジア地域への生産工程の海外移転が促進されたが、その結果として、輸出の減少や逆輸入の増加による輸入構造の変化が もたらされており、経常収支黒字の縮小要因となっているとの指摘がある。 こうしたアジアへの直接投資の拡大は、国内の産業空洞化に関する議論を呼び起こし、 国際競争力の低下を懸念する声もあるが、長期的にみた場合には、直接投資は効率的な 資本の移動を目指すものであり、企業にとっては収益の向上や競争力の向上に寄与し、 また消費者にとってもより低価格な財貨・サービスを提供するものであり、経済厚生を 向上させるものである。わが国の国際競争力に関する議論に際しては、国内外の財の相 対価格を規定し、貯蓄投資差額と経常収支を一致させる役割をはたす為替レートの現行 の水準の適正性についての議論が必要とされる。為替レートの変化が輸出入や直接投資 へ影響を与え、経常収支の動向に反映されることから、現行のわが国の為替レートの水 準のアジア地域の為替レートに対する比較評価が重要となる。特に、昨今の中国経済の 力強さに対する元レートの評価など、国際市場においては元の切り上げに関する議論が 取り上げられているところであり、今後のわが国の国際収支への影響が留意される。 経常収支が国内の総貯蓄と総投資で決定されることは、経常収支の黒字幅の縮小は国 内の投資活動に起因するといえ、国内の投資活動が活発化した場合には黒字幅は縮小し、 停滞化した場合には拡大するとされる。現在のわが国の経済状況は長期的な財政赤字の 状況にあり、国内投資の活性化に際しては、わが国経済に対する国際的な信認の維持が 必要不可欠である。わが国の財政赤字が、経常収支の動向へ影響を与えると考えられる ことから、将来的な持続可能性が注視されるところである。一方で、継続的な経常黒字 は対外債権の保持を伴うが、その最大の貸出相手国は米国である。米国経済は財政赤字 と経常赤字の双子の赤字をかかえており、将来的な持続可能性に対する懸念が生じてお り、債権国としてのわが国への影響が憂慮される。 このように、近年、わが国の国際収支を取り巻く課題は様々である。グローバリゼー ションの進展により企業の多国籍化が促進してきており、国際分業における貿易パター ンの変化がもたらす影響に関する分析も経常収支の動向を把握するにあたっては必要 である。また、国内の資本過剰の状態が投資活動に与える影響や、高齢化や人口の減少 などといった将来的な人口構成の変化など、貯蓄率と投資率へ影響を及ぼす長期的な構 造的要因を多く含んでいる。 本研究会は、このような国際収支を取り巻く課題に基づいて、その背景にある短期的 な景気循環による影響と、マクロ経済全体からのアプローチによる長期的な構造的要因 による影響の両側面から経常収支の動向を中心に、概観、分析を行うものである。特に マクロ経済計量モデルを用いた分析手法が有用であり、経常収支モデルの構築、維持・ 改良を継続的に行ってきている。研究会の開催にあたっては、マクロ経済学、国際経済 学、計量経済学の分野におよぶ学識経験者により研究組織が構成され、国際経済やわが 国経済に関する諸問題について経済学的な見地からの報告がなされ、わが国の国際収支 の現状に関する理論的背景の把握に努め、また、それらの報告をもとに、従来の経常収 支モデルの改良を行い、推計することにより、わが国の国際収支の中期的な動向に関す
る予測を行うものである。 本年度は、特に、現在、国際経済において懸念される以下の点に着目して研究を進め、 本報告書にその結果をまとめた。まずは、グローバリゼーションの進展に伴う国際間取 引における貿易パターンの変化における産業内貿易の深化と生産要素との関わり、次い で、国際サービス取引の動向と知的財産権の保護と国際間取引への影響、国際収支にお ける為替レートの適正性、さらに、わが国の経常収支黒字の持続可能性と米国の経常収 支赤字の持続可能性について論じられ、理論的にかつ実証的な分析が試みられている。 そして、それら諸問題に関する分析結果ならびに現在のマクロ経済状況を勘案し、マク ロ経済計量モデルを用いた経常収支の中期的な予測と考慮されるいくつかの外生的シ ョックによるシミュレーションが行われている。 グローバル化が進展し、ボーダレスな様相を呈してきている今日の国際経済において、 国際間取引はますます様々な形で活発に行われていくことになるであろう。わが国が、 今後、成熟した債権国へと移行するのか、あるいは、現状の経常収支黒字を維持し、現 段階にとどまるのか、国際収支の動向が注目されるところである。本報告書が、わが国 の国際収支の動向に関する基礎的な研究として貢献し、わが国の国際経済の発展に寄与 するべき資料となることを期待する。 最後に、本研究会開催にあたっては、伴金美大阪大学教授を主査とした研究組織の構 成により、また外部講師として各方面の講師陣のご参加により、精力的な分析を行うこ とができたことに際し、ここに深く感謝の意を申し上げる。また、財務省国際収支室の 多大なるご協力をはじめ、本研究会を開催・遂行するにあたりご尽力頂いた方々に心よ り御礼を申し上げる。
2004 年 3 月
財団法人 財政経済協
会研 究 組 織
(順不同・敬称略)主 査:
伴 金美
(
大阪大学大学院経済学研究科教授)
委 員:
若杉 隆平
(
横浜国立大学大学院国際社会科学研究科教授)
深尾 京司
(
一橋大学経済研究所教授)
宮尾 龍蔵
(
神戸大学経済経営研究所教授)
外部講師:
小川 英治
(
一橋大学大学院商学研究科教授)
宮川 努
(
学習院大学経済学部教授)
長岡 貞男
(
一橋大学イノベーション研究センター教授)
木村 福成
(
慶應義塾大学経済学部教授)
事務局:
早坂 勉
(
財団法人 財政経済協会 事務局長)
黒岩 美和子 (
財団法人 財政経済協会 研究員)
杉村 和恵
(
財団法人 財政経済協会 研究補助員)
目 次
1 Physical and Human Capital Deepening and
New Trade Patterns in Japan .1
1-1. Introduction ... 1
1-2. Physical and Human Capital Deepening in the Japanese Economy ... 3
1-3. Japan’s Inter-Industry Trade and Factor Contents ... 8
1-4. Japan’s Intra-Industry Trade and Determinants of Factor Intensity within Industry... 20 1-5. Conclusion ... 28
2 サービス貿易をめぐる 3 つの論点 ...43
2-1. サービス貿易の統計的把握をめぐる問題 ... 43 2-2. サービス貿易に関する国際的政策規律と国内政策... 46 2-3. サービスに関する貿易障壁の数量化の試み ... 473 知的財産権と国際取引についてのいくつかの論点 ...55
3-1. はじめに − 知的財産権の重要性の高まり − ... 55 3-2. 知的財産権強化の国際取引への影響... 59 3-3. 米国の国際収支に見る知的財産取引... 61 3-4. 日本の技術導入ライセンス契約に見る知的財産権... 62 3-5. 途上国の知的財産権強化と技術移転... 644 知的財産権の保護と貿易 ...67
4-1. はじめに... 67 4-2. TRIPS 協定と知的財産権の保護 − 国際比較 − ... 68 4-3. 分析のフレームワーク... 72 4-4. 実証分析のための仮説と推計式 ... 80 4-5. データと推計結果 ... 82 4-6. 結論 ... 84ii
5 アジア諸国の均衡為替レート ...87
5-1. はじめに... 87 5-2. 均衡為替レートの考え方 ... 89 5-3. アジア 5 カ国の均衡為替レート ... 91 5-4. 均衡為替レートの要因分析 ... 101 5-5. 実効均衡為替レートの計測 ... 106 5-6. 結論と今後の課題 ... 1076 経常収支、財政収支動向と日本経済の持続可能性 ...117
6-1. はじめに... 117 6-2. 分析フレームワーク ... 118 6-3. 実証分析... 123 6-4. 結論 ... 1327 アメリカの経常収支赤字の持続可能性 ...135
7-1. はじめに... 135 7-2. 経常収支赤字の持続可能性に関する 3 つの視座 ... 135 7-3. 経常収支赤字の持続可能性に関する実証分析 ... 139 7-4. 経常収支赤字のファイナンス要因の分析 ... 148 7-5. 結論 ... 1508 経常収支モデルの推定と予測シミュレーション ...153
8-1. 経常収支の動向 ... 153 8-2. 経常収支モデルの概要... 159 8-3. ベースラインとしての中期的予測 ... 173 8-4. シミュレーション分析... 178 8-5. まとめ ... 1861 Physical and Human Capital Deepening and
New Trade Patterns in Japan
∗1-1. Introduction
Until the beginning of the 1990s, Japan accomplished comparatively high economic growth through an exceptionally rapid accumulation of physical and human capital. Table 1.1.1 compares growth accounting results for the US economy (by Jorgenson, Ho, and Stiroh, 2002) with those for the Japanese economy (Fukao, Inui, Kawai, and Miyagawa, 2003). We can see that, compared with the US, Japan’s economic growth until 1990 was relatively more dependent on labor quality growth and increases in physical capital per capita. However, as is well-known, high economic growth based on rapid capital accumulation is not sustainable in the long-run because of the diminishing rate of return to physical and human capital.
Table. 1.1.1 Sources of Economic Growth: US-Japan Comparison <Panel A> The Result of Growth Accounting for the US Economy by Jorgenson et al (2002): 1973-2000
(annual rate, %) Real GDP growth Man-hour growth Labor productivity
(GDP/man-hour) growth TFP growth
Contribution of labor quality growth Sub-total Contribution of IT capital Contribution of non-IT capital a b c=a-b d=c-e-f e f=g+h g h 1973-1995 2.78% 1.44% 1.33% 0.26% 0.27% 0.80% 0.37% 0.43% 1995-2000 4.07% 1.99% 2.07% 0.62% 0.21% 1.24% 0.87% 0.37% Contribution of capital sevices/man-hour growth
Jorgenson et al. (2002)
<Panel B> The Result of Growth Accounting for the Japanese Economy: 1973-1998
(annual rate, %) Real GDP growth Man-hour growth Labor productivity
(GDP/man-hour) growth TFP growth
Contribution of labor quality growth Sub-total Contribution of IT capital Contribution of non-IT capital a b c=a-b d=c-e-f e f=g+h g h 1973-83 3.56% 1.53% 2.03% -0.30% 0.65% 1.68% 0.16% 1.52% 1983-91 3.94% 1.79% 2.15% 0.40% 0.46% 1.29% 0.37% 0.92% 1991-98 1.25% -0.08% 1.34% 0.03% 0.21% 1.10% 0.33% 0.76% 1995-98 0.52% 0.63% Contribution of capital services/man-hour growth
Source: Fukao et al. (2003), Table 1.2.2. Original figures are calculated from JIP database.
∗ The authors would like to thank the discussants, Chin Hee Hahn and Ji Chou, and participants of the Fourteenth
NBER Annual East Asian Seminar on Economics for their helpful comments. The authors are also grateful to Yoshimasa Yoshiike and Tangjun Yuan for undertaking meticulous data calculations.
2
Evidence suggests that Japan is caught in this trap of diminishing rates of return. Figure 1.1.1 shows that as the physical capital-output ratio increased over the past three decades in Japan, the rate of return to physical capital declined continuously. Comparing South Korea and Japan with other OECD economies, Pyo and Nam (1999) , showed that the two countries both enjoyed a more rapid rise in their capital output ratios but also suffered a faster decline in the rate of return to capital. Turning from physical to human capital, Katz and Revenga (1989) found that while educational earnings differentials expanded drastically in the US in the 1980s, the college wage premium in Japan increased only slightly. As Genda (1997) showed, the underlying reason is that the employment of skilled workers such as older college graduate males expanded rapidly in Japan, resulting in an excess supply of skilled workers relative to the limited availability of management positions that contributed to the stagnation of earnings for older college graduates. Probably partly as a result of these declines in the rate of return, the accumulation of physical and human capital has slowed down over the past decade (Table 1.1.1).
Figure 1.1.1 Japan's Capital-Output Ratio and Rate of Return to Capital: 1973-1998
0 0.5 1 1.5 2 2.5 3 1973 1974 1975 1976 1977 1978 1979 1980 1981 1982 1983 1984 1985 1986 1987 1988 1989 1990 1991 1992 1993 1994 1995 1996 1997 1998 0.0% 5.0% 10.0% 15.0% 20.0% 25.0% Capital-Output Ratio(Left Axis)
Real Rate of Return to Capital (Right Axis, %)
The numerator of the rate of return to capital is the current surplus of the national accounts deflated by the GDP deflator.
We should note that according to standard international trade theory, rapid growth based on capital accumulation will be sustainable if the economy gradually specializes in physical and human capital intensive products. Under such a specialization process, the factor price equalization mechanism will work to offset the diminish rate of return to physical and human capital. For Japan, the 1990s were an age of “globalization”: the country has expanded its international division of labor with other East Asian countries through international trade and direct investment. The purpose of this paper is to examine this deepening of the international division of labor and evaluate how much of the diminishing rate of return mechanism was cancelled out by the international division of labor.
Several recent studies, such as Feenstra and Hanson (1996b, 1999, 2001), Kimura (2001), and Fukao, Ishido, and Ito (2003), have shown that the fragmentation of the production process and vertical intra-industry trade between developed and developing economies may have enhanced the vertical division of labor within each industry. This type of international division of labor would cause a deepening of the physical and human capital within each industry in developed economies. However, since the resulting capital deepening will occur within each industry, we cannot correctly analyze this type of division of labor by using inter-industry trade data. Consequently, we study the international division of labor by looking at both inter-industry trade and intra-industry trade.
The remainder of the paper is organized as follows. In section 2, we examine physic al and human capital deepening in Japan. In section 3, we take a broad look at Japan’s inter-industry trade and factor contents in order to measure to what extent Japan’s capital deepening is offset by international trade. In section 4, after providing an overview of the changes in Japan’s intra-industry trade and vertical division of labor, we conduct econometric analyses to investigate the determinants of the changes in factor intensities using industry-level data. Section 5, finally, presents our conclus ions.
1-2. Physical and Human Capital Deepening in the Japanese Economy
In this section, we look at the trends of physical and human capital deepening in Japan and examine the macro-economic change in the capital-labor ratio and the change in the skille d-labor ratio (the percentage of skilled labor in total labor) by decomposing these changes into the contribution of the increase in the capital-labor ratio or the share of non-production workers within each industry (the “within effect”) and the contribution of the reallocation between industries (the “between effect”).
First, we consider the increase in the capital-labor ratio and the share of non-production (or skilled) workers in the manufacturing sector as well as the Japanese economy as a whole. As
4
Figure 1.2.1 shows, the capital-labor ratio measured as real capital stock (in 1990 price) divided by the number of workers has increased considerably over the last three decades: the capital-labor ratio for both the economy as a whole and manufacturing industry grew five-fold from three million yen per person in 1970 to 15 million yen per person in 1998.
Figure 1.2.1 Trend of Capital-Labor in Japan
0 2 4 6 8 10 12 14 16 18 1970 1972 1974 1976 1978 1980 1982 1984 1986 1988 1990 1992 1994 1996 1998 2000 Real capital stock / Number of total
workers in Japan
Real capital stock / Number of total manufacturing workers (mil.yen / person)
Source: Authors' calculation based on JIP Database.
In order to examine the human-capital deepening in Japan, we compiled data on the number of non-production or skilled workers using the data of the Population Census. “Skilled workers” are persons whose profession is classified either as “professional and technical” or as “managerial and administrative.” We define “non-production workers” here as persons whose profession falls into one of the following categories: professional and technical occupations, managers and administrators, clerical and secretarial occupations, sales occupations, services occupations, protective occupations, occupations in agriculture, forestry and fishing, occupations in transportation and telecommunications, and other occupations. The definition of “non-production workers” is much broader than the definition of “skilled workers” and includes
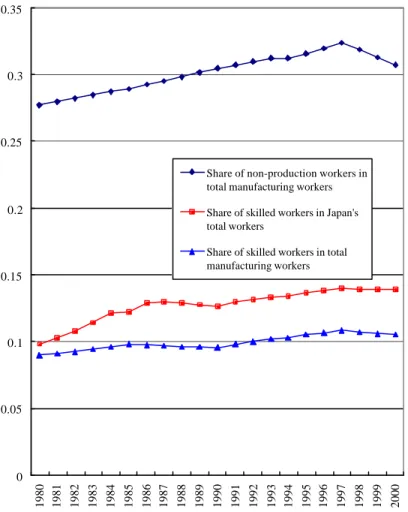
not-highly educated workers. The share of non-production (or skilled) workers in the total number of workers has been increasing, as shown in Figure 1.2.2, though the growth rate is much more moderate than that of the capital-labor ratio. In the period from 1980–2000, the share of non-production workers in manufacturing increased from 27.7% in 1980 to 30.7% in 20001. The share of skilled workers also grew during 1980-2000: in the manufacturing sector, it rose from 9.0% to 10.5%, while in the economy as a whole it expanded from 9.8% to 13.9%2.
Figure 1.2.2 Share of Skilled and Non-production Workers in Total Workers
0 0.05 0.1 0.15 0.2 0.25 0.3 0.35 1980 1981 1982 1983 1984 1985 1986 1987 1988 1989 1990 1991 1992 1993 1994 1995 1996 1997 1998 1999 2000
Share of non-production workers in total manufacturing workers Share of skilled workers in Japan's total workers
Share of skilled workers in total manufacturing workers
Source: Authors' calculation based on Population Census data.
The increase in the capital-labor ratio and in the share of non-production (or skilled) workers can be decomposed into the contribution of the increase within each industry (“within effect”) and the contribution of the reallocation between industries (“between effect”) using the following decomposition formula:
1
This latter value, though, is substantially below the peak of 32.3% reached in 1997. The decline in the share of non-production workers since 1998 is most likely the result of firms’ restructuring efforts – the dismissal of managers, sales personnel, etc. – following the further deterioration of the Japanese economy.
2
6
∑
∑
= = ∆ + ∆ = ∆ n i i i n i i i P P S S P 1 1 i: industry (i=1, 2, ..., n)∑
∑
= = = n i i n i i L K P 1 1 / , or∑
∑
= = n i i n i i s L L 1 1 , /Pi=Ki/Li: Capital-labor ratio in industry i, or
=Lsi/Li: Share of non-production (or skilled) workers in total number of workers in in dustry i
Si= Li/L: Share of workers in industry i in total number of workers in the
economy as a whole or in the manufacturing sector
Variables with an upper bar denote the average value of the period. ? denotes the change in the variable overtime. The first term of the right hand side represents the increase in the factor intensity within each industry (“within effect”) while the second term represents the reallocation between industries (“between effect”).
Ideally, we should use the most disaggregated cross-industry data available for our decomposition analysis. However, because of the data limitation, we had to use the relatively aggregated data of the JIP database for our decomposition analysis3. We should note that our estimates of the within effect might suffer from upward biases as a consequence of this aggregation problem.
The results of our decomposition analysis are reported in Tables 1.2.1 and 1.2.2. Table 1.2.1, which summarizes the decomposition of capital-labor ratio growth, shows that there was a negative between effect for most periods of 1970-1998, indicating the decline of the capital-intensive sectors of the economy. Moreover, the magnitude of the between effect is very small throughout the entire 1970-1998 period and most part of the growth of capital-labor ratio is attributable to the within effect. On the other hand, Table 1.2.2, which summarizes the decomposition of the growth of the share of skilled or non-production workers, shows that here the between effect was positive in all cases, showing that the share of human capital intensive industries has continuously increased both in the manufacturing sector and in the economy as a whole. The within effect was also positive with the exception of two cases in the period of 1990-2000, and it was always greater than the between effect except for these two cases. The major implication of our results is that the within effect is very large. Some part of the within effect may have been caused by the international division of labor within each industry. We analyze this issue in section 4.
3
Table 1.2.1 Decomposition of Capital-Labor Ratio Growth
<Panel A> Decomposition of capital-labor ratio growth: manufacturing sector
(annual rate, %) 1970-80 1980-90 1990-2000 1980-2000
Growth rate of K-L ratio 11.24 6.43 4.18 6.65
Between effect -0.45 -1.01 -0.05 -0.90
Within effect 11.69 7.44 4.24 7.55
<Panel B> Decomposition of capital-labor ratio growth: the whole economy
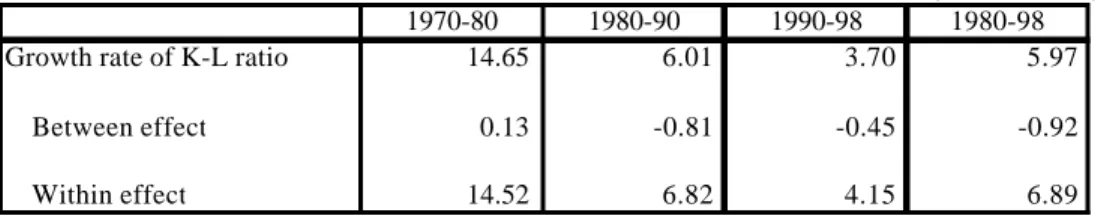
(annual rate, %) 1970-80 1980-90 1990-98 1980-98
Growth rate of K-L ratio 14.65 6.01 3.70 5.97
Between effect 0.13 -0.81 -0.45 -0.92
Within effect 14.52 6.82 4.15 6.89
Note: The capital-labor ratio is defined as the real capital stock (in 1990 price) divided by the number of workers. Source: Authors' calculation based on JIP database.
Table 1.2.2 Decomposition of the Growth of the Share of Skilled or Non-Production Workers
<Panel A> Decomposition of the growth of the share of non-production workers: manufacturing sector (annual rate, %) 1980-90 1990-2000 1980-2000
Growth rate of the share 1.00 0.08 0.55
Between effect 0.12 0.16 0.14
Within effect 0.88 -0.07 0.41
<Panel B> Decomposition of the growth of the share of skilled workers: manufacturing sector (annual rate, %)
1980-90 1990-2000 1980-2000 Growth rate of the share 0.65 0.97 0.84
Between effect 0.29 0.25 0.27
Within effect 0.36 0.71 0.57
<Panel C> Decomposition of the growth of the share of skilled workers: the whole economy (annual rate, %) 1980-90 1990-2000 1980-2000
Growth rate of the share 2.88 1.03 2.10
Between effect 1.02 1.06 1.02
Within effect 1.86 -0.02 1.08
8
Our decomposition analysis thus suggests that physical and human capital deepening in the Japanese economy is mostly attributable to the within-industry shift, not to the between-industry shift, though we could see a negative between effect during the period 1990-2000 for the share of non-production workers in the manufacturing sector and the share of skilled workers in the whole economy. In the last two decades, and particularly in the 1990s, the age of “globalization,” both the within-industry capital deepening and the between-industry allocation may have been caused by expanding international trade. The between-industry shift may be partly explained by the change in patterns of inter-industry trade which affects the size of each industry in Japan, while the within-industry shift may be explained by the change in patterns of intra-industry trade which affects the mixes of factor inputs in each industry. In the following sections, we will examine the change in Japan’s trade patterns and analyze the determinants of the changes in factor intensities in Japan.
1-3. Japan’s Inter-Industry Trade and Factor Contents
In this section, we take a general look at the pattern of Japan’s inter-industry trade in the last two decades. Next, we estimate how factor contents in Japan’s international trade changed during this period.
1-3-1 Overview of Japan’s International Trade
Although Japan’s overall import-GDP ratio has gradually declined over the last two decades, imports of manufactured products have actually grown faster than the economy as a whole (Table 1.3.1). As Figure 1.3.1.B shows, the increase in imports mainly concentrated on electrical machinery and labor intensive goods, such as apparel and wooden products, which in this figure are classified as “other manufacturing products.” Since the share of the manufacturing sector in GDP declined during this period, the ratio of imports of manufactured products to gross value added in the manufacturing sector increased rapidly : by 11.5 percentage-points from 15.2% in 1985 to 26.7% in 2000 (Table 1.3.1). The United States experienced a similar trend during the 1980s, when this ratio jumped by 12.4 percentage -points from 18.3% in 1978 to 30.7% in 1990 (Sachs and Shatz 1994). We would expect an impact of a similar scale on Japan’s manufacturing sector as a result of the recent surge in imports4.
4
Comparing export shares and import penetration in the US, Canada, UK and Japan during the period from 1974-93, Campa and Goldberg (1997) found import penetration to be extremely stable and significantly lower in Japan than in the other countries. However, if we were to conduct a similar analysis using more recent data, it seems probable that this conclusion no longer holds.
Table 1.3.1 Japan's Share of Imports and Manufacturing Sector in GDP, Employment, and Gross Value Added
Imports of goods and services/GDP Imports of manufactured products (CIF)/GDP Imports of services/GDP Share of manufacturing sector in total GDP Share of manufacturing sector in total employed persons Imports of manufactured products (CIF)/gross value added by manufacturing sectoir 1980 15.1% 5.1% 1.7% 29.2% 26.2% 17.4% 1985 11.3% 4.5% 1.6% 29.5% 26.5% 15.2% 1990 9.4% 5.3% 1.6% 28.2% 26.2% 18.7% 1995 7.8% 5.0% 1.3% 24.7% 24.7% 20.3% 2000 9.5% 6.3% 1.3% 23.4% 22.3% 26.7%
Notes: Official SNA statistics for the year 2000 are based on 1993 SNA. For years before 1989, only statistics based on 1968 SNA are available. In order to make long-term comparisons we derived values for 2000 by an extrapolation based on values of 1995 and the 1995-2000 growth rate of each variable reported in SNA statistics based on 1993 SNA.
Sources: Economic and Social Research Institute, Cabinet Office, Government of Japan, Annual Report on National Accounts 2002, Economic Planning Agency, Government of Japan, Annual Report on National Accounts 2000.
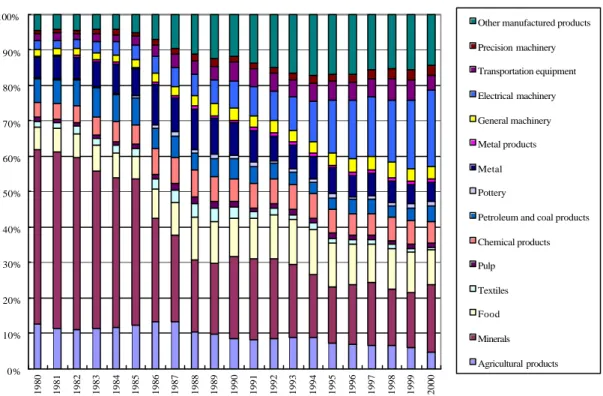
Figure 1.3.1.A Commodity Composition of Japan's Exports: 1980-2000
0% 10% 20% 30% 40% 50% 60% 70% 80% 90% 100% 1980 1982 1984 1986 1988 1990 1992 1994 1996 1998 2000
Other manufactured products Precision machinery Transportation equipment Electrical machinery General machinery Metal products Metal Pottery
Petroleum and coal products Chemical products Pulp Textiles Food Minerals Agricultural products
Sources: Economic and Social Research Institute, Cabinet Office, Government of Japan, Annual Report on National Accounts 2002, Economic Planning Agency, Government of Japan, Annual Report on National Accounts 2000.
10
Figure 1.3.1.B Commodity Composition of Japan's Imports: 1980-2000
0% 10% 20% 30% 40% 50% 60% 70% 80% 90% 100% 1980 1981 1982 1983 1984 1985 1986 1987 1988 1989 1990 1991 1992 1993 1994 1995 1996 1997 1998 1999 2000
Other manufactured products Precision machinery Transportation equipment Electrical machinery General machinery Metal products Metal Pottery
Petroleum and coal products Chemical products Pulp Textiles Food Minerals Agricultural products
Sources: Economic and Social Research Institute, Cabinet Office, Government of Japan, Annual Report on National Accounts 2002, Economic Planning Agency, Government of Japan, Annual Report on National Accounts 2000.
On the other hand, the commodity composition of Japan’s exports at the two-digit level has remained relatively stable over the last fifteen years (Figure 1.3.1.A). Nevertheless, looking at trade patterns at a more detailed commodity classification level, it becomes clear that Japan’s specialization has changed: the country is increasingly specializing in the export of capital goods and key parts and components in the automobile and electrical machinery sector, while it has become a net importer of many household electrical goods5 .
Japan’s new imports of electrical machinery and labor intensive products are mainly provided by East Asian economies. Figure 1.3.2 shows that nine East Asian economies (China, Hong Kong, Taiwan, Korea, Singapore, Indonesia, Thailand, the Philippines, and Malaysia) provided 64.2% of Japan’s electrical machinery imports and 49.2% of Japan’s imports of “other manufacturing products” in 2000. The East Asian economies’ share in Japan’s total imports of machinery and intermediate products such as metal products and chemical products has also increased rapidly.
5
The share of machine parts in Japan’s total exports to East Asia increased from 31.7 % in 1990 to 40.2% in 1998, while the share of capital goods, which include some machine parts, increased from 53.2% to 56.8% during the same period (MITI 1999).
Figure 1.3.2 Share of Nine East Asian Economies in Japan's Trade in Manufacturing Products: 1980-2000, by Commodity
Figure 1.3.2.A Share of Nine East Asian Economies in Japan's Exports
0 10 20 30 40 50 60 70 80 Food Textiles Pulp Chemical products Petroleum and coal products
Pottery
Iron
and
Steel
Non-ferrous metalMetal ProductsGeneral machineryElectrical machinery
Transportation equipment Precision machinery
Other manufactured products
1980 1990 2000
Figure 1.3.2.B Share of Nine East Asian Economies in Japan's Imports
0 10 20 30 40 50 60 70 80 90 Food Textiles Pulp Chemical products Petroleum and coal products
Pottery Iron and Steel
Non-ferrous metalMetal ProductsGeneral machineryElectrical machinery
Transportation equipment Precision machinery
Other manufactured products
1980 1990 2000
12
As a result of these trends, East Asia during the 1990s became the most important destination for and origin of Japan’s international trade. As Figure 1.3.3 shows, trade with the nine East Asian economies accounted for 48.5% of Japan’s total manufactured imports and 41.0% of total manufactured exports in 2000.
Figure 1.3.3 Japan's Major Trade Partners: Manufacturing Products, 1980-2000
(A) Share of Major Trade Partners in Japan's Exports of Manufactured Products
0% 10% 20% 30% 40% 50% 60% 70% 80% 90% 100% 1980 1985 1990 1995 2000 Other Economies EU NAFTA ASEAN 4 NIEs 3
China and Hong Kong
(B) Share of Major Trade Partners in Japan's Imports of Manufactured Products
0% 10% 20% 30% 40% 50% 60% 70% 80% 90% 100% 1980 1985 1990 1995 2000 Other Economies EU NAFTA ASEAN 4 NIEs 3
China and Hong Kong
This rise in Japan’s imports of labor intensive products and exports of capital and technology intensive products (such as machinery and advanced intermediate products) can be easily recognized as a deepening of the international division of labor with the relatively unskilled-labor abundant East Asian economies. But how can we interpret the rapid increase in the two-way trade in electrical machinery? Table 1.3.2, presenting Japan’s bilateral trade in electrical machinery with China and Hong Kong in 1999 at the 3-digit level, provides a clue.
Table 1.3.2 Japan's Trade in Electrical Machinery and Office Machines with China and Hong Kong in 1999
(billion yen)
Commodity classification, SITC R3
Japan's exports to China and
Hong Kong (f.o.b. base)
Japan's imports from China and
Hong Kong (f.o.b. base)
Japan's net-exports to China and Hong Kong
75-Office machines & automatic data processing machines 275.3 231.0 44.2
751-Office machines 173.5 117.2 56.3
752-Automatic data processing machines & units 59.0 83.7 -24.8
759-Parts of and accessories suitable for 751-752 42.8 30.1 12.7
76-Telecommunications & sound recording apparatus 316.7 302.5 14.1
761-Television receivers 37.5 39.5 -2.1
762-Radio-broadcast receivers 6.8 41.2 -34.4
763-Gramophones, dictating, sound recorders etc n.a. n.a. n.a.
764-Telecommunications equipment and parts 272.4 221.8 50.6
77-Electrical machinery, apparatus & appliance 1377.9 454.2 923.7
771-Electric power machinery and parts thereof 65.7 122.7 -57.0
772-Elect.app.such as switches, relays, fuses, pl 235.2 65.9 169.4
773-Equipment for distributing electricity 48.7 63.9 -15.2
774-Electric apparatus for medical purposes 12.9 1.2 11.7
775-Household type, elect.& non-electrical equipment 14.1 52.3 -38.3
776-Thermionic, cold & photo-cathode valves, tubes 724.0 85.7 638.3
778-Electrical machinery and apparatus, n.e.s. 277.3 62.6 214.8
Total 1969.8 987.7 982.1
Source: Statistics Canada, World Trade Analyzer 2001.
This table shows two important facts. First, at the detailed commodity level, there seems to be a division of labor within the electrical machinery industry. With China and Hong Kong, Japan is a net importer of relatively labor-intensive products (such as television and radio-broadcast receivers and electrical household goods) and a net exporter of technology-intensive other products. This means that in order to correctly understand the division of labor and factor contents in trade between Japan and East Asia, we need to analyze trade patterns at the detailed commodity level; otherwise, the analysis will suffer from aggregation bias problems (Feenstra and Hanson 2000).
The second important fact this table shows is the existence of huge intra-industry trade between Japan and China plus Hong Kong. For example , in the case of television receivers, the total trade value is 37 times greater than the trade balance. It seems that we need to analyze intra-industry trade in order to correctly evaluate the impact of trade on Japanese economy.
14
1-3-2 Factor Contents in Japan’s Trade of Manufacturing Products
In this subsection, we analyze the changes in factor contents in Japan’s trade. In order to avoid aggregation bias, we should calculate factor contents at the most disaggregated level possible.6 The most disaggregated data on direct factor requirements are those available in the Report on Industrial Statistics of the Ministry of International Trade and Industry, which is based on the Census of Manufactures. The data is classified by the 4-digit Standard Industrial Classification for Japan, which listed 540 manufacturing industries in 1990.
There is no direct converter between this industry classification and the 9-digit HS classification used by the Ministry of Finance for the compilation of Japan’s international trade statistics. In order to link the two sets of data – factor requirements and international trade – we used the basic industry classification of the Japan Input-Output Tables 1990 by the Management and Coordination Agency, which lists 341 manufacturing industries, as our benchmark classification. Using supplementary converter tables of the I-O statistics, we converted both the factor requirement data and the international trade data into the basic I-O classification. As a result, we obtain factor requirement and international trade data for 246 manufacturing industries.7 In order to estimate indirect factor requirements, we used the corresponding I-O table.
Ideally, we would use up-to-date factor requirement data and I-O tables in order to take account of technology change in Japan. Unfortunately, the factor requirement data is available only until 1990, because the Census of Manufactures after that year does not cover headquarter activities. Because of this constraint, we used constant factor requirement and I-O data of 1990 for our analysis of the entire 1980-2000 period.8
Factor content in Japan’s trade in year t (t = 1980, 1990, 2000) is calculated by
t
t D I A T
X = ( − )−1
where (K × 1) vector Xt =[xk,t] denotes the total contents of factor k in Japan’s trade of year t. (K
× J) matrix D =[dk,j] denotes the quantity of primary factor k directly used per unit of output in
6
Using Management and Coordination Agency, Japanese Government “1980-85-90 Linked Input-Output Tables,” Sakurai (2001) estimated factor contents in Japan’s trade for the years 1980, 85, and 90.
7
The factor requirement data of the Census of Manufactures is on an establishment basis and each establishment is classified by its most important product. Since many establishments produce various commodities simultaneously, this classification method is problematic. The I-O converter from the Census of Manufactures to the basic I-O classification takes account of this problem and converts establishment-based data into activity-based data. We used the I-O converter in order to construct the factor requirement data for each I-O classification-based industry. Therefore, our factor requirement data were also transformed into the activity-based data.
8 Because of this methodology, there is a risk of overestimating factor contents in recent trade in the case of
industry j in year 1990. (J × J) matrix A is the input-output matrix of year 1990.9 (J × 1) vector Tt is the net-export vector of year t in 1990 prices. In order to derive trade data in 1990 prices, we used the deflators of the Management and Coordination Agency’s Japan Linked Input-Output Table (various years) and the Wholesale Price Index of the Bank of Japan at the 3-digit level.10
We analyzed factor content in terms of the following four primary factors: physical capital (in 1990 prices, book value), production labor (number of workers), non-production labor (number of workers), and land (in 1990 prices, book value). In order to analyze how the increase in Japan’s trade with the East Asian economies affected Japan’s factor markets, we subdivided Japan’s total net exports in each industry into gross exports and gross imports by six regions, namely, (1) China and Hong Kong, (2) the NIEs-3 (Taiwan, South Korea, and Singapore), (3) the ASEAN-4 (Indonesia, Thailand, Malaysia, and The Philippines), (4) the US, (5) the EU, and (6) all other economies.
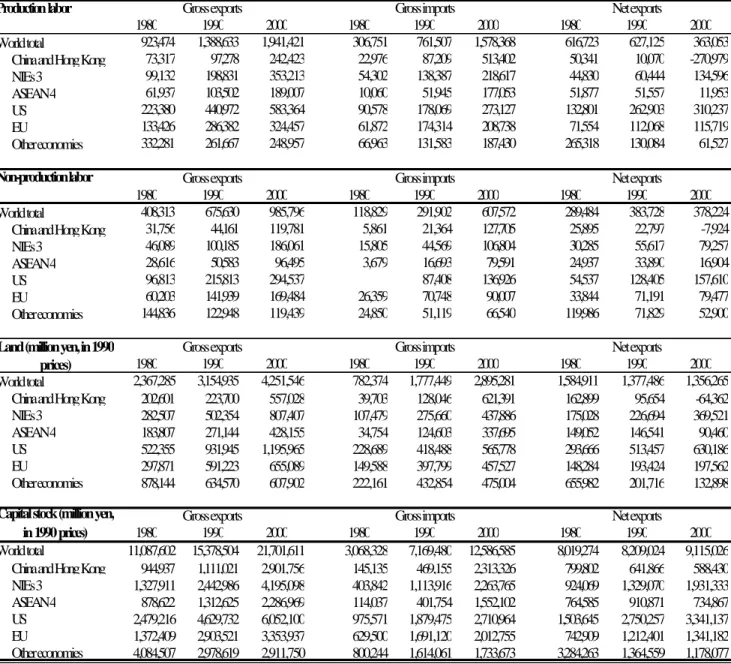
The results of the factor content analysis for the years 1980, 1990, and 2000 are reported in Table 1.3.3. Reflecting Japan’s huge trade surplus, Japan is a net exporter of all the four primary factors. For example, according to our calculations, in the year 2000, Japan recorded factor-content net exports of 363,000 production workers, which represents 4.7 % of the total of production workers (7,717,000) in manufacturing in 1990. Compared with the trade pattern observed in 1990, the 2000 figure for factor content net-exports of production labor represents a decline of 42%. This decline was almost entirely caused by Japan’s trade with China and Hong Kong (Table 1.3.4). In the year 2000, about one-third of factor content gross-imports of production workers came from China and Hong Kong (Table 1.3.3).
9 The input -output matrix here covers only manufacturing industries. Therefore, our analysis does not include
indirect factor requirements through changes in production in non-manufacturing industries.
10
The conversion of trade statistics at the HS 9-digit level into trade data at classified at the basic industry level of the I-O tables in 1990 price was conducted by H. Nosaka, T. Inui, K. Ito and K. Fukao as part of the Japan Industrial Productivity (JIP) database project. The result is included in the JIP database. For more detail on this database see Fukao, Inui, Kawai, and Miyagawa (2003).
16
Table 1.3.3 Factor Contents (Direct plus Indirect) of Trade for Japan's Manufacturing Sector: 1980-2000, by Region
Production labor
1980 1990 2000 1980 1990 2000 1980 1990 2000 World total 923,474 1,388,633 1,941,421 306,751 761,507 1,578,368 616,723 627,125 363,053
China and Hong Kong 73,317 97,278 242,423 22,976 87,209 513,402 50,341 10,070 -270,979 NIEs 3 99,132 198,831 353,213 54,302 138,387 218,617 44,830 60,444 134,596 ASEAN 4 61,937 103,502 189,007 10,060 51,945 177,053 51,877 51,557 11,953 US 223,380 440,972 583,364 90,578 178,069 273,127 132,801 262,903 310,237 EU 133,426 286,382 324,457 61,872 174,314 208,738 71,554 112,068 115,719 Other economies 332,281 261,667 248,957 66,963 131,583 187,430 265,318 130,084 61,527 Non-production labor 1980 1990 2000 1980 1990 2000 1980 1990 2000 World total 408,313 675,630 985,796 118,829 291,902 607,572 289,484 383,728 378,224
China and Hong Kong 31,756 44,161 119,781 5,861 21,364 127,705 25,895 22,797 -7,924 NIEs 3 46,089 100,185 186,061 15,805 44,569 106,804 30,285 55,617 79,257 ASEAN 4 28,616 50,583 96,495 3,679 16,693 79,591 24,937 33,890 16,904 US 96,813 215,813 294,537 87,408 136,926 54,537 128,405 157,610 EU 60,203 141,939 169,484 26,359 70,748 90,007 33,844 71,191 79,477 Other economies 144,836 122,948 119,439 24,850 51,119 66,540 119,986 71,829 52,900 1980 1990 2000 1980 1990 2000 1980 1990 2000 World total 2,367,285 3,154,935 4,251,546 782,374 1,777,449 2,895,281 1,584,911 1,377,486 1,356,265
China and Hong Kong 202,601 223,700 557,028 39,703 128,046 621,391 162,899 95,654 -64,362 NIEs 3 282,507 502,354 807,407 107,479 275,660 437,886 175,028 226,694 369,521 ASEAN 4 183,807 271,144 428,155 34,754 124,603 337,695 149,052 146,541 90,460 US 522,355 931,945 1,195,965 228,689 418,488 565,778 293,666 513,457 630,186 EU 297,871 591,223 655,089 149,588 397,799 457,527 148,284 193,424 197,562 Other economies 878,144 634,570 607,902 222,161 432,854 475,004 655,982 201,716 132,898 1980 1990 2000 1980 1990 2000 1980 1990 2000 World total 11,087,602 15,378,504 21,701,611 3,068,328 7,169,480 12,586,585 8,019,274 8,209,024 9,115,026
China and Hong Kong 944,937 1,111,021 2,901,756 145,135 469,155 2,313,326 799,802 641,866 588,430 NIEs 3 1,327,911 2,442,986 4,195,098 403,842 1,113,916 2,263,765 924,069 1,329,070 1,931,333 ASEAN 4 878,622 1,312,625 2,286,969 114,037 401,754 1,552,102 764,585 910,871 734,867 US 2,479,216 4,629,732 6,052,100 975,571 1,879,475 2,710,964 1,503,645 2,750,257 3,341,137 EU 1,372,409 2,903,521 3,353,937 629,500 1,691,120 2,012,755 742,909 1,212,401 1,341,182 Other economies 4,084,507 2,978,619 2,911,750 800,244 1,614,061 1,733,673 3,284,263 1,364,559 1,178,077
Gross exports Gross imports Net exports
Capital stock (million yen, in 1990 prices)
Gross exports Gross imports Net exports Land (million yen, in 1990
prices)
Gross exports Gross imports Net exports
Table 1.3.4 Changes in Factor Contents (Direct plus Indirect) of Net Exports for Japan's Manufacturing Sector: 1980-2000, by Region
Production labor
World total 10,403 (0.1%) -264,073 (-3.4%) -253,670 (-3.3%) China and Hong Kong -40,272 (-0.5%) -281,049 (-3.6%) -321,321 (-4.2%) NIEs 3 15,614 (0.2%) 74,152 (1.0%) 89,766 (1.2%) ASEAN 4 -320 (-0.0%) -39,603 (-0.5%) -39,924 (-0.5%) US 130,101 (1.7%) 47,335 (0.6%) 177,436 (2.3%) EU 40,513 (0.5%) 3,651 (0.0%) 44,164 (0.6%) Other economies -135,234 (-1.8%) -68,557 (-0.9%) -203,792 (-2.6%) Non-production labor World total 94,244 (2.7%) -5,505 (-0.2%) 88,739 (2.6%) China and Hong Kong -3,098 (-0.1%) -30,721 (-0.9%) -33,819 (-1.0%) NIEs 3 25,332 (0.7%) 23,641 (0.7%) 48,973 (1.4%) ASEAN 4 8,953 (0.3%) -16,986 (-0.5%) -8,033 (-0.2%) US 73,868 (2.1%) 29,205 (0.8%) 103,073 (3.0%) EU 37,347 (1.1%) 8,286 (0.2%) 45,632 (1.3%) Other economies -48,157 (-1.4%) -18,929 (-0.5%) -67,087 (-1.9%) Land (million yen, in 1990 prices)
World total -207,425 (-1.6%) -21,221 (-0.2%) -228,646 (-1.8%) China and Hong Kong -67,244 (-0.5%) -160,017 (-1.2%) -227,261 (-1.8%) NIEs 3 51,666 (0.4%) 142,826 (1.1%) 194,492 (1.5%) ASEAN 4 -2,512 (-0.0%) -56,080 (-0.4%) -58,592 (-0.5%) US 219,791 (1.7%) 116,729 (0.9%) 336,521 (2.6%) EU 45,140 (0.3%) 4,138 (0.0%) 49,278 (0.4%) Other economies -454,267 (-3.5%) -68,818 (-0.5%) -523,085 (-4.1%) Capital stock (million yen, in 1990 prices)
World total 189,751 (0.3%) 906,001 (1.6%) 1,095,752 (2.0%) China and Hong Kong -157,936 (-0.3%) -53,436 (-0.1%) -211,372 (-0.4%) NIEs 3 405,001 (0.7%) 602,262 (1.1%) 1,007,263 (1.8%) ASEAN 4 146,286 (0.3%) -176,004 (-0.3%) -29,718 (-0.1%) US 1,246,611 (2.2%) 590,880 (1.1%) 1,837,492 (3.3%) EU 469,492 (0.8%) 128,781 (0.2%) 598,273 (1.1%) Other economies -1,919,705 (-3.5%) -186,482 (-0.3%) -2,106,186 (-3.8%) Net exports Net exports 1980-90 1990-2000 1980-2000 Net exports 1980-2000 1980-2000 Net exports 1980-90 1980-90 1990-2000 1980-90 1990-2000 1990-2000 1980-2000
Notes: Data in parentheses denote the ratio of factor contents to total input in Japan's manufacturing sector in 1990. The data on total input are taken from the Ministry of International Trade and Industry, Census of Manufactures 1990.
18
In the case of non-production workers, there were factor content net-exports of 378,000 production workers in the year 2000, which represents 10.9% of the total of non-production workers (3,456,000) in manufacturing in 1990. Compared with trade patterns in 1980, net-exports of non-production workers have increased by 89,000, which is equivalent to 2.6% of the total of non-production workers in 1990. The major increase in this factor content occurred in Japan’s trade with the US (Table 1.3.4).
In the case of land, factor content net-exports in 2000 amounted to 1.36 trillion yen (in 1990 prices), which is equivalent to 10.5 % of the total land value (12.9 trillion yen) used in manufacturing in 1990. Net exports of land have gradually declined over the last twenty years (Table 1.3.4).
Capital stock factor content net-exports in 2000, meanwhile, stood at 9.12 trillion yen (in 1990 prices), which represents 16.5% of the total capital stock (55.4 trillion yen) in manufacturing in 1990. Compared with 1980, this represent an increase in net-exports of capital stock by 1.1 trillion yen or 2.0% of the total capital stock in 1990 (Table 1.3.4).
Relative to the total amount of each of the four primary input factors used in manufacturing, Japan exported a large amount of capital and non-production labor but only a small amount of production labor in 2000. Since non-production workers on average are more educated than production workers and Japan is a country abundant in physical and human capital, the above results are consistent with the Heckscher-Ohlin theory.
As Table 3.3 shows, in the period from 1980-2000, Japan’s factor content net-exports of production workers fell by 3.3%, while net-exports of non-production workers rose by 2.6%. This change in trade patterns has the effect of increasing the implied supply-ratio of production/non-production workers available to the manufacturing sector for other use by about 5.9%. More than one-half of this change (3.2%) was caused by Japan’s trade with China and Hong Kong.
During 1980-2000, Japan’s factor content net-exports of capital stock grew by 2.0%, while net-exports of workers overall (production and non-production) decreased by 1.5%. This change in the trade pattern has the effect of reducing the implied supply of capital stock per worker available to the manufacturing sector for other use by 3.5%. Thus, compared with the impact on the implied supply ratio of production/non-production workers, the effect of recent changes in trade patterns on the implied supply of capital stock per worker has been small.
By a similar calculation using the results of the factor content analysis at the 4-digit level carried out by Feenstra and Hanson (2000), we can evaluate the impact of US trade on its factor markets. This shows that in the period of 1982-94, changes in US trade patterns had the effect of increasing the implied supply ratio of production/non-production workers available to the manufacturing sector for other use by 1.0%, while the implied supply of capital stock per
worker available to the manufacturing sector for other use fell by 2.3%.11 Thus, compared with the US, Japan experienced a much more drastic change in factor content net-exports over the last two decades in terms of its implied supply ratio of production/non-production workers available to the manufacturing sector for other use.
The trends shown here mean that, Japan’s factor content net-exports have changed in a direction that offsets the effect of the accumulation of physical and human capital per capita. Japan has come to export more physical and human capital intensive products over the past two decades. However, compared with the rapid deepening of physical and human capital in the macro-economy described in Section 2, the offsetting effect of international trade seems to be small. Table 1.3.5 compares physical and human capital deepening in the Japanese manufacturing sector as a whole with that purely attributable to changes in factor contents of trade. Although the average annual growth rate of capital-labor ratio for the manufacturing sector total is 7.60% for the 1980-1998 period, the growth rate becomes very small at 0.18 % when we only take account of change in factor contents of trade. As for the growth rate of the share of non-production workers, the offsetting effect of international trade is also small for the 1980-1990 period and throughout the 1980-2000 period. However, in the 1990s, the contribution of international trade to the growth of the share of non-production workers in the Japanese manufacturing sector is much larger, which implies a significant effect of international trade on Japan’s human capital deepening.
Table 1.3.5 Physical and Human Capital Deepening in the Japanese Manufacturing Sector
(annual rate, %)
1970-80 1980-90 1990-2000 1980-2000
Growth rate of capital-labor ratio
Manufacturing sector total 11.24 6.43 5.51* 7.60**
Changes in factor contents of trade n.a. -0.06 0.41 0.18
Growth rate of the share of non-production workers
Manufacturing sector total n.a. 1.00 0.08 0.55
Changes in factor contents of trade n.a. 0.18 0.23 0.21
*The growth rate of the capital-labor ratio denotes the average annual growth rate from 1990 to 1998. **The growth rate of the capital-labor ratio denotes the average annual growth rate from 1980 to 1998. Source: Authors' calculation based on the results of Tables 1.2.1, 1.2.2, and 1.3.4.
11
In the period of 1982-94, the United States saw an increase in its factor content net-imports of production (non-production) workers in manufacturing of 8.2% (7.2%). It also experienced a rise in factor content net-imports of capital stock in manufacturing of 5.5% and a decline in net-exports of (production plus non-production) workers of 7.8% of total workers in manufacturing.
20
1-4. Japan’s Intra-Industry Trade and Determinants of Factor
Intensity within Industry
So far, we have found that the macro-level capital-labor ratio has been increasing over the last two decades, and that most of the increase is attributable to the within-industry shift and not the between-industry shift. Moreover, most of the macro-level increase in the skilled or non-production labor share in the total number of workers has also been induced by the within-industry shift. As has been argued in previous studies, the international division of labor through the fragmentation of production processes and the import of unskilled labor-intensive intermediate inputs may have contributed to an increase in the relative demand for skilled labor in each industry. That is, if firms fragment their production into discrete activities and move non-skill-intensive activities abroad, then trade will shift employment toward skilled workers within those industries. This type of international division of labor has been referred to as “outsourcing” in the recent literature. Feenstra and Hanson (1996a, 1996b, 1999) and Hijzen, Görg and Hine (2003), for example, provide econometric evidence of a positive relationship between outsourcing and the demand for skilled labor. Although the international fragmentation of production has been increasing rapidly in Japan in recent years, too, contributing to changes in trade patterns, studies analyzing the impact of fragmentation on labor and capital are very limited.12
Moreover, vertical intra-industry trade (VIIT), i.e. intra-industry trade where goods are differentiated by quality, may have a large impact on factor demands within each manufacturing industry in Japan. As Falvey (1981) pointed out in his seminal theoretical paper, commodities of the same statistical group but of different quality may be produced using different mixes of factor inputs. Therefore, developed economies like Japan may export physical and human capital-intensive products of high-quality and import unskilled labor-intensive products of low quality from developing economies. As a result, an increase in VIIT may also raise the physical and human capital intensity in Japan.
In the following subsections, we briefly outline the changes in outsourcing and VIIT patterns by industry in Japan for the period from 1988–2000.13 We also discuss the relationship between changes in factor demand and trade patterns by industry. Using industry-level as well as firm-level data, we conduct econometric analyses to investigate the determinants of the observed growth in the skilled-labor share in total workers and in the capital-labor ratio. We should note that following analyses are limited to the manufacturing sector due to data constraints.
12 An exception is Sakurai (2000), who conducts a similar analysis for Japan. See section 1.4.2 for the details. 13
1-4-1 Industry -Level Overview of Fragmentation and Factor Intensity
Japan’s trade patterns have undergone various changes over time: in particular, the share of trade with Asian countries in overall trade has increased markedly. In this subsection, utilizing Japan’s customs data and the JIP database, we investigate VIIT and outsourcing from foreign countries by industry, and analyze the impacts of these trends on shift in factor demand in Japan.
Figure 1.4.1 shows the share of VIIT, a broad outsourcing measure, and a narrow outsourcing measure by industry for the year 2000, while Figure 1.4.2 presents the average annual growth rates of these values from 1988–2000 by industry.14 Following major preceding studies such as Greenaway, Hine, and Milner (1995) and Fontagné, Freudenberg, and Péridy (1997) , our VIIT measure is calculated based on the assumption that the gap between the unit value of imports and the unit value of exports for each commodity reveals the qualitative differences of the products exported and imported between the two countries. Our measures of broad and narrow outsourcing are constructed following Feenstra and Hanson (1999). The broad outsourcing measure expresses imported intermediate inputs relative to total expenditure on non-energy intermediate inputs in each industry. The narrow outsourcing measure is expressed by the imported intermediate inputs purchased from the same JIP industry as the good being produced divided by the total expenditure on non-energy intermediate inputs in each industry. Figure 1.4.1 shows that the level of the VIIT share in the year 2000 was relatively high (more than 30 percent) in publishing and printing, other chemicals, metal products, electrical machinery, other electrical machinery, and precision machinery and equipment. On the other hand, the broad outsourcing measure was high (more than 15 percent) in food products (livestock products and processed marine products), apparel and accessories, lumber and wood products, leather and leather products, basic chemicals, chemical fibers, non-ferrous metals, other electrical machinery, and precision machinery and equipment. The narrow outsourcing measure was high (more than 5 percent) in food products (livestock products and processed marine products), lumber and wood products, pulp, paper, and paper products, leather and leather products, basic chemicals, petroleum products, steel manufacturing, non-ferrous metals, other electrical machinery, other transportation equipment, and precision machinery and equipment. Figure 1.4.2 shows that the VIIT share and outsourcing measures increased in most manufacturing sectors during the period from 1988–2000. In particular, we find that the outsourcing measures increased relatively more in food products, textile products, and machineries, while the VIIT share increased relatively more in food products, textile products, petroleum and coal products, non-ferrous metals and motor vehicles.
14 For the definition of VIIT and broad and narrow outsourcing measures, see Appendix. For more detailed analyses
22
Figure 1.4.1 Vertical Intra-Industry Trade Share and Outsourcing Share by Industry: 2000
0 5 10 15 20 25 30 35 40 45 50 Livestock products Proc essed mari ne pr oduc ts
Rice polishing, flour milling
Othe r foo ds Beve rages Toba cco Silk Spinn ing
Fabrics and other textile products
App arel a nd ac cesso ries Lum ber a nd w ood p roduc ts Furniture
Pulp, paper, paper products Publishing and printing
Leath er an d lea ther p rodu cts
Rubber productsBasic
chem
icals
Chemical fibersOther chemicals
Petroleum products Coal p roduc ts Stone , clay & gl ass pr oduc ts Steel man ufactu ring Other steel Non-f errou s meta ls Meta l prod ucts Gene ral m achin ery eq uipm ent Electrical machinery Equip men t and supp lies for hous ehold use
Other electrical machinery Motor vehicles
Ships
Other transportation equipment
Prec ision m achin ery & equip men t Other manufacturingMan ufac turing total VIIT Share Broad Outsourcing Narrow Outsourcing (%)
Figure 1.4.2 Annual Growth Rate of Vertical Intra-Industry Trade Share and Outsourcing Share by Industry: 1988-2000
-20 -15 -10 -5 0 5 10 15 20
Livestock products Processed marine products Rice polishing, flour milling Other foods Beverages Tobacco Silk Spinning Fabrics and other textile products Apparel and accessories Lumber and wood products Furniture Pulp, paper, paper products Publishing and printing Leather and leather products Rubber products Basic chemicals Chemical fibers Other chemicals Petroleum products Coal products Stone, clay & glass products Steel manufacturing Other steel Non-ferrous metals Metal products General machinery equipment Electrical machinery Equipment and supplies for household use Other electrical machinery Motor vehicles Ships Other transportation equipment Precision machinery & equipment Other manufacturing Manufacturing total VIIT Share Broad Outsourcing Narrow Outsourcing (%) (41.0)
Growth rate of VIIT share: ?ln (VIIT/Total trade)
Growth rate of broad outsourcing share: ?ln (Broad outsourcing/Total intermediate inputs) Growth rate of narrow outsourcing share: ?ln (Narrow outsourcing/Total intermediate inputs)
24
Next, let us look at the correlations between changes in factor intensities, the VIIT share, and the outsourcing measures. Table 1.4.1 summarizes the correlation coefficients between the annual growth rates of the shares of skilled workers, non-production workers, the VIIT share, and the broad and narrow outsourcing measures for the period from 1988–2000. Although we can see a positive correlation between skilled workers’ share and the VIIT share, the correlation coefficient is not statistically significant. Moreover, the correlation coeffic ients between the capital-labor ratio and the VIIT share and between non-production workers’ share and the VIIT share are negative, though not significant. As for changes in the outsourcing measures and factor intensities, a significantly positive correlation can be seen only in the case of skilled workers’ share. Therefore, the simple correlation coefficient analysis does not provide strong support for the conjecture that outsourcing or VIIT may have contributed to physical and human capital deepening in each industry.
Table 1.4.1 Correlation Coefficient Matrix
(a) 1 (b) 0.435 *** 1 (c) 0.471 *** 0.592 *** 1 (d) -0.059 0.262 -0.050 1 (e) -0.017 0.292 * 0.210 -0.147 1 (f) 0.146 0.299 * 0.203 0.009 0.554 *** 1 (c) (d) Non-production
Worker Share VIIT Share
Capital-Labor Ratio Skilled Worker Share (a) (b) Broad Outsourcing Narrow Outsourcing (e) (f)
Note: Each variable denotes the average annual growth rate for the period from 1988 to 2000. * significant at 10% level, *** significant at 1% level.
Source: Authors' calculation.
1-4-2 Econometric Analysis
In this section, we conduct a statistical analysis of the determinants of factor intensities using the industry-level data from 1988–2000. Several previous studies have analyzed the impact of fragmentation on skill upgrading (human capital deepening). Using detailed industry-level data for the US, Feenstra and Hanson (1996a, 1996b, 1999) estimate the effect of international outsourcing on wage inequality. Hijzen, Görg and Hine (2003) conduct a similar analysis using UK data for 53 manufacturing industries for the period from 1982–1997. As for Japan, Sakurai (2000) analyzes this issue using data for 39 manufacturing industries for the period from 1987–1990. While the studies on the US and the UK found a strong positive relationship between outsourcing and wage inequality, Sakurai’s (2000) study on Japan did not
produce such clear-cut evidence. Sakurai explains that his ambiguous result might be due to the short estimation period. The present paper aims at applying and extending the Feenstra and Hanson approach by using JIP industry-level data (35 manufacturing industries) for the period from 1988–2000. In addition, we take account of the role of skill-biased technological change (SBTC) in the increase in skilled (non-production) worker intensity, utilizing the JIP IT (Information Technology) database.15 As Hijzen, Görg and Hine (2003) mention, the inclusion of the 1990s in the analysis is thought to be crucial as international fragmentation and information technology progressed rapidly in the past decade. However, one drawback of our analysis is that we cannot calculate wage bills for skilled (non-production) and unskilled (production) workers due to data constraints. Therefore, we assume that the relative wage rates of skilled (non-production) and unskilled (production) workers have not changed over time, and we use the ratio of the number of skilled (non-production) workers to the total number of workers as a proxy for the share of skilled (non-production) workers’ wage bill in the total wage bill.
A translog cost function approach, based on the work of Berman, Bound and Griliches (1994) and Feenstra and Hanson (1996b), is usually employed in the literature to estimate skill upgrading and we follow this approach here. Similarly, following previous studies, we consider capital as a fixed input in the short-run, while skilled and unskilled (non-production and production) workers are variable factors of production. Therefore, the short-run translog cost function can be presented as:
ik ij J j K k jk il ik K k K l kl is ij J j J s js ik K k k J j ij j i
x
w
x
x
w
w
x
w
C
ln
ln
ln
ln
2
1
ln
ln
2
1
ln
ln
ln
1 1 1 1 1 1 1 1 0∑∑
∑∑
∑∑
∑
∑
= = = = = = = =+
+
+
+
+
=
ϕ
δ
γ
β
α
α
(1)where Ci is the variable cost for industry i, wij denotes the wages of workers in skill group j, and xik denotes the fixed inputs or outputs k. Differentiating the translog cost function with respect to wages yields the factor payments to skill group j over the total wage bill.
15 According to the argument put forward by Feenstra and Hanson (1999), both skill-biased technological change and
outsourcing can be considered to be associated with within-industry changes in skill intensity as a result of their effect on the relative productivity of different skill groups. That is, as fragmentation or outsourcing take the form of moving unskilled labor-intensive processes from a developed country to a developing country, they have a similar effect as technological change.