Thesis for the degree of Doctor of Philosophy
Nonlinear Propagation Property and Its
Mitigation of Digital Coherent Optical Signal
through Single-Mode Optical Fiber for Advanced
Fiber-Optic Communication Systems
光ファイバ通信の高性能化に向けたディジタル
コヒーレント光信号の単一モード光ファイバ
非線形伝送特性とその抑制に関する研究
XIN ZHANG
iii
いて述べた。さらに、第7 章では、光ファイバラマン増幅の適用により、最大送
信パワー限界値を緩和できることを示し、定量的に議論した。最後に、第8 章で
iv
Abstract
With the increase of bandwidth consuming applications, worldwide communication capacity demand has increased rapidly over the past a few decades. While fiber optic communication systems have already being served as infrastructures for such global and core networks, much efforts are continuously being paid to develop higher capacity and longer systems by adopting the state-of-the-art technologies. Because optical signal is transmitted through optical fiber, transmission performance impairments caused by optical fibers nonlinearity are one of the most important factors that limit the capacity of the next generation Wavelength Division Multiplexing (WDM) systems. In this paper, the nonlinear transmission property of optical signal in optical fiber for next generation optical communication systems is studied.
The thesis consists of 8 chapters. The second chapter is devoted to the modulation formats and detection schemes. The coherent detection technology based on Digital Signal Processing (DSP) technology combined with advanced modulation formats, can significantly improve the transmission capacity of the system, and simplify the complexity of the system if the polarization multiplexing technology is recombined. Polarization multiplexing (PM) can double the spectral efficiency of the system. In this chapter, we summarize the modulation format and Forward Error Correction (FEC) of optical coherent link, and describe some important aspects of DSP and coherence detection.
Chapter 3 focuses on fiber dispersion and nonlinearity, which are extremely important to consider for the high-capacity systems. Starting with introducing the fundamental nonlinear Schrodinger equation, such as attenuation, chromatic dispersion, polarization model dispersion (PMD), nonlinear interference noise. Then, we have comprehensively investigated transmission property of single-channel 10 Gbps signal in dispersion shifted fiber (DSF). Quite different feature of signal degradation in positive and negative dispersion regimes is clarified in terms of signal operation wavelength as well as transmission distance. Intrinsic nonlinear degradation near zero dispersion is found to be symmetric in terms of wavelength despite that modulation instability gain should vanish in normal dispersion with deviation from zero dispersion.
v
dBm, +14.8 dBm and +10.6 dBm, respectively, for single-channel 120Gbps DP-QPSK, DP-16QAM and DP-64QAM formats in large-core and low-loss single-mode silica fibers. We also show that the maximum transmitter powers gradually decrease in logarithmic feature with the increase of the number of DWDM channels. The channel number dependence is newly shown to be almost independent on the modulation format.
Chapter 5 investigated that the modified GN-model with adjustment parameters, can be an accurate way to describe the nonlinearity impairments in non-repeatered transmission system. In this chapter we have introduced theoretically the GN model and bibliographical background, and introduced the model formulas, also the main derivation steps are given. Then we directly discuss the subject of GN model accuracy with adjustment parameters. The calculation results using extended Gaussian-Noise (GN) model with adjustment parameters have been compared with the numerical simulation results, not only to confirm the validity of the results but to explore possible new analytical modeling for non-repeatered systems.
Chapter 6 is devoted to nonlinear mitigation techniques, digital back propagation to compensate nonlinearity impairments in non-repeatered systems. With nonlinear compensation by using digital back propagation (DBP) at receiver side, we have found that 2 dB improvement is achievable compared with the performance without DBP. However, the performance is affected by nonlinear channel interference in DWDM non-repeatered systems, the improvement has been reduced to 0.6dB due to disturbance from neighboring DWDM channels. Furthermore we newly confirmed that the negative dispersion which change the optical pulse waveform at transmitter side increase the maximum input power by 0.2dB in single channel.
In chapter 7, Raman amplifier is studied to improve the maximum transmitter power in non-repeatered systems. We investigated the implementation of up to third-order Raman amplification as well as conventional (first order) Raman amplification. Then, a comparison of the resulting performances are made for first-order through third-order pumpings. For third-order Raman amplification, the equivalent Tx power is enhanced +24.0dBm, about 8dB increase compared with that without Raman Amplifier.
vi
Acknowledgements
I would like to express the deepest appreciation to my mentor Professor Aoki, who has the attitude and the substance of a genius: he continually and convincingly conveyed a spirit of adventure in regard to research and scholarship, and an excitement in regard to teaching. Without his guidance and persistent help this dissertation would not have been possible.
Also, I would like to thank all the members of my Dissertation Committee, Professor D. Y. JU, Professor J. T. Cao, Professor S. Sato, Professor S. Furuya, who has provided me extensive personal and professional guidance and taught me a great deal about both scientific research and life in general. Especially, I would like to thank Professor D. Y. JU, as my teacher and mentor, he has taught me more than I could ever give him credit here.
I am grateful to all of those with whom I have had the pleasure to work during this research work. Team work is so important during the research.
Also, I would like to express my sincere thanks to all my friend, who take good care of my life during these years.
viii
Table of contents
要旨 ... ii
Abstract ... iv
Acknowledgements ... vi
List of figures and tables ... xii
List of acronyms and abbreviations ... xiv
Chapter 1 Introduction ... 1
1.1 Background ... 1
1.2 Objective of this project ... 2
1.3 Outline of the dissertation ... 3
References ... 4
Chapter 2 Modulation and detection schemes ... 7
2.1 Introduction ... 7
2.2 IM-DD (Intensity modulation / direct detection) ... 8
2.2.1 NRZ modulated signal ... 8
2.2.2 RZ modulated signal ... 8
2.3 Modulation scheme for coherent detection ... 8
2.3.1 QPSK ... 9
2.3.2 QAM ... 9
2.3.3 Constellation diagram ... 10
2.4 Digital coherent detection technology... 11
2.4.1 Coherent detection ... 11
2.4.2 DSP ... 12
2.5 BER, SNR and Q Value ... 14
2.6 Simulations for different modulation format ... 15
2.7 Concluding remarks ... 16
ix
Chapter 3 Fundamentals of optical fiber propagation ... 19
3.1 Introduction ... 19
3.2 Non-linear Schrödinger equation ... 19
3.2.1 Attenuation ... 20
3.2.2 Chromatic dispersion and Polarization model dispersion ... 21
3.2.3 Nonlinear interference noise ... 21
3.3 Nonlinear Propagation Characteristics of 10 Gbps Signal in DSF ... 22
3.3.1 10Gbps optical signal at and near zero dispersion of DSF ... 22
3.3.2 Results and discussions ... 23
3.4 Concluding remarks ... 27
References ... 27
Chapter 4 Non-repeatered system and simulation results ... 29
4.1 Introduction ... 29
4.2 BER characteristic on modulation formats ... 29
4.2.1 System configuration and simulation method ... 29
4.2.2 BER and constellation maps evolution for single-channel input ... 31
4.2.3 Maximum transmitter power dependence on the number of WDM channels ... 34
4.3 BER characteristic on symbol rate... 36
4.3.1 System model and simulation method ... 36
4.3.2 Results and discussions ... 37
4.4 Concluding remarks ... 39
References ... 40
Chapter 5 Extension of GN model and application to high power transmission ... 43
5.1 Introduction ... 43
5.2 Getting to the GN model ... 43
5.2.1 From model to system performance ... 44
x
5.2.3 GN model analytical derivation ... 45
5.3 Extension to non-repeatered system GN nonlinear interference noise... 46
5.4 Concluding remarks ... 50
References ... 50
Chapter 6 Mitigation of nonlinear limits in non-repeatered system ... 53
6.1 Introduction ... 53
6.2 Digital backward propagation (DBP) ... 54
6.2.1 How DBP works ... 54
6.2.2 Computational complexity of DBP ... 56
6.3 Simulation demonstration of DBP ... 56
6.3.1 System configuration and simulation method ... 56
6.3.2 Results and discussion ... 57
6.4Constellation Shaping ... 60
6.5 Concluding remarks ... 61
References ... 61
Chapter 7 Raman Amplified Non-repeatered System ... 65
7.1 Raman Amplification ... 65
7.1.1Theory of Raman amplifier ... 65
7.1.2Raman gain spectrum ... 66
7.1.3Single-pump Raman amplification ... 67
7.1.4High order Raman amplification ... 68
7.2 Simulation demonstration of Raman amplification ... 68
7.2.1System configurations ... 68
7.2.2 Results and discussion ... 69
7.3 Concluding remarks ... 71
References ... 71
xi
8.1 Summary... 73
8.2 Future work ... 75
List of publications ... 77
Appendix ... 79
A.MATLAB program on the BER characteristic dependent on received power. ... 79
xii
List of figures and tables
Figure 2.1 Modulation of Digital Data: QAM.
Figure 2.2 a. Constellation Diagram for b. ASK (OOK), c. BPSK and d. QPSK.
Figure 2.3 Functional block diagrams for coherent transmitter (left) and receiver (right). Figure 2.4 Universal DSP algorithm design.
Figure 2.5 Relationship between BER and SNR (baseband SNR and OSNR). Figure 2.6 the constellation map and spectrum for different modulation format. Figure 2.7 the back to back receiver sensitivity for modulation formats.
Figure 3.1 Attenuation Spectrum of optical fiber. (After reference Chesnoy, José-Undersea Fiber Communication Systems, Second Edition-Academic Press (2015) chapter 1)Figure 3.2 Simulated system model.
Figure 3.3 Q value evolution with transmission distance. Figure 3.4 Examples of received waveforms.
Figure 3.5 Q value dependence on repeater output power.
Figure 3.6 Q performance with and without dispersion compensation at 2000km transmission.
Figure 4.1 Non-repeatered system configuration for 120Gbps DP-QPSK, DP-16QAM and DP-64QAM formats.
Figure 4.2 Evolution of constellation map (a.u.) with Tx power. (a) DP-QPSK, L=300 km transmission. (b) DP-16QAM, L=200 km transmission. (c) DP-64QAM, L=100 km transmission.
Figure 4.3 the BER characteristics for single channel QPSK, 16QAM and DP-64QAM. (a) DP-QPSK-300km. (b) DP-16QAM-200km. (c) DP-64QAM-100km. Figure 4.4 DP-16QAM 8WDM transmission characteristics. Fiber length is 100km. (a) Constellation map at +18dBm/total Tx power. (b) BER characteristics (received power is -25 dBm/ch).
Figure 4.5 DP-16QAM 80WDM signal spectra at +9dBm/ch power. (a) Before 200km transmission. (b) After 200km transmission (with SRS effect). Resolution in optical spectrum is 0.001nm.
Figure 4.6 DP-16QAM signal spectrum for each bit rate.
Figure 4.7 BER Characteristics for 120Gbps, 240Gbps and 360Gbps DP-16QAM for several Tx powers.
xiii
Figure 5.1 BER characteristics for QPSK, 16QAM and 64QAM. (a) DP-QPSK-300km. (b) DP-16QAM-200km. (c) DP-64QAM-100km.
Figure 5.2 Maximum Tx power dependence on the number of channels (BER=1×10⁻²). Figure 6.1 Schematic of the SSM for simulating forward propagation in real fiber (a) and DBP in virtual fiber (b).
Figure 6.2 Evolution of constellation map for DP-16QAM with Tx power. L=100k (a) without nonlinear compensation. (b) With nonlinear compensation.
Figure 6.3 BER characteristic for DP-16QAM. Left: without compensation. Right: with compensation.
Figure 6.4 DP-16QAM 8WDM and 20WDM transmission characteristic. Fiber length is 100km. Left: 8WDM. Right: 20WDM.
Figure 6.5 120Gbps DP-16QAM BER characteristic dependence on receiver power w/o 5km SMF (D= -20.5 ps/nm/km) in Tx side of 100km non-repeatered systems using digital back propagation.
Figure 7.1 Schematic of Raman amplification optical communication system.
Figure 7.2 Perchannle power profile as a function of the transmission distance in an unrepeatered system: (a) With discrete amplifiers only (b) with backward distributed Raman gain (c) with forward and backward distributed Raman gain.
Figure 7.3 System configuration.
Figure 7.4 Raman pump and signal power along the span.
Figure 7.5 Raman Gain for DP-16QAM with first order Raman amplifier, second order Raman amplifier and third order Raman amplifier.
Figure 7.6 BER characteristics for DP-16QAM without Raman amplifier (a) and with first order Raman amplifier (b). With second order Raman amplifier (c). With third order Raman amplifier (d).
Table 5.1 C1 and C2 for different modulation formats.
Table 5.2 the list of resultant a1 and a2 values used in Figs.5.1. Table 6.1 System Parameters.
xiv
List of acronyms and abbreviations
ADC Analog to digital converter
AGN Additive Gaussian noise
ASE Amplified Spontaneous Emission
AWGN Additive White Gaussian Noise
BER Bit Error Rate
BPSK Binary Phase-Shift Keying
CD Chromatic Dispersion
CW Continuous Wave
DAC Digital to Analog Converter
DBP Digital Back Propagation
DCF Dispersion Compensating Fiber
DM Dispersion Managed
DSP Digital Signal Processing
DWDM Dense Wavelength Division Multiplexing
EDFA Erbium-Doped Fiber Amplifier
FEC Forward Error-Correcting Code
FWM Four-Wave-Mixing
GN Gaussian Noise
GNRF GN model reference formula
ITU International Telecommunication Union
LO Local Oscillator
MIMO Multiple-Input Multiple-Output
MZ Mach-Zehnder Modulator
NLIN Non-Linear Interference Noise
NLSE Non-Linear Schrödinger Equation
NRZ Non-Return to zero
OFDM Orthogonal Frequency Division Multiplexing
OPT MUX Optical Multiplexer
OPT DEMUX Optical Demultiplexer
OSNR Optical Signal to Noise Ratio
PBS Polarization Beam Splitter
xv
PM Polarization Multiplexed
PD Photodiode
PSCF Pure Silica Core Fiber
PSK Phase-Shift Keying
PTP Point To Point Links
QAM Quadrature Amplitude Modulation
QPSK Quadrature Phase-Shift Keying
SE Spectral Efficiency
SNR Signal To Noise Ratio
SMF Single-to-Noise Ratio
SPM Self-Phase-Modulation
SBS Stimulated Brillouin Scattering
SRS Stimulated Raman Scattering
WDM Wavelength Division Multiplexing
XPM Cross-Phase-Modulation
1
Chapter 1 Introduction
1.1 Background
With the increase of bandwidth consuming applications, worldwide communication capacity demand has increased rapidly over the past a few decades. While fiber optic communication systems have already being served as infrastructures for such global and core networks, much efforts are continuously being paid to develop higher capacity and longer systems by adopting the state-of-the-art technologies. Because optical signal is transmitted through optical fiber, transmission performance impairments caused by optical fibers nonlinearity are one of the most important factors that limit the capacity of the next generation Wavelength Division Multiplexing (WDM) systems. In this paper, the nonlinear transmission property of optical signal in optical fiber for next generation optical communication systems is studied.
With the development of high-speed digital signal processing technology (DSP) and analog-to-digital conversion technology, coherent optical transmission technology has been a hot issue in the optical communication field. Using the combination of coherent detection and digital signal processing (DSP), long-haul optical transmission [1-3] can be realized without optical dispersion compensation. This enables us to configure 100Gbps-based DWDM subsea and transcontinental trunk practical systems by utilizing ultra-low loss and large effective area (Aeff) single-mode silicon fiber (SMFs) for transmission lines [4-5].
For non-repeatered system application, several reports have been published on both high-capacity and long-reach transmission [6]. And single-span transmission exceeding 400 km and/or a capacity-reach product of over 5 Pbps-km have been demonstrated by adoption of optimized Raman/Remote Optically Pumped Amplifier (ROPA) as well as high power booster amplifiers[7-11]. In those systems, the maximum transmission powers are considered to be limited by optical fiber nonlinearity, but, to the best of our knowledge, neither quantitative simulation studies nor experimental investigations have so far been reported on this topic.
2
resulted in relatively mild nonlinearity over the entire system length. The establishment of high power transmission technology is particularly beneficial for non-repeatered application because it surely offers a greater power budget.
It is expected that the next generation WDM communication system operate at 400Gbps or 1Tbps rate. Meanwhile, in optical fibers transmission nonlinear impairments are regarded as the most remarkable factor which limits the capacity of the next generation WDM systems set by the nonlinear Shannon capacity. Digital back propagation (DBP) could be a general technique to compensate both linear and nonlinear impairments.
Further, fiber loss is one of important factor of limiting the optical fiber transmission length. With the coming forth and commercial using of erbium-doped fiber amplifiers (EDFA) and the Raman amplification, it made the development of expanding span distance and capacity.
1.2 Objective of this project
In this paper, the nonlinear transmission property of optical signal in optical fiber for next generation optical communication systems is studied. We have comprehensively evaluated by numerical simulation very high power transmission property and bit error rate (BER) performance of 120Gbps Dual-Polarization Quadrature Phase Shift Keying (DP-QPSK), DP-16QAM (Quadrature Amplitude Modulation) and DP-64QAM modulation formats in large effective area and low-loss SMFs without and with nonlinear compensation. We limit our discussion in C-band transmission because channel interaction due to stimulated Raman scattering (SRS) effect is not considered.
We have clarified for the first time how and at what powers the BER deteriorates with transmitter power increase. Based on BER characteristics, we have quantitatively discussed the maximum transmitter powers set by fiber nonlinearity, and we have shown that the maximum transmitter (Tx) powers gradually decrease in logarithmic feature with the increase of the number of DWDM channels. The channel number dependence has newly been shown to be almost independent on the modulation format. Furthermore, the simulated results have been compared with extended GN model with introducing adjustment parameters to explore possible new analytical model for non-repeatered system.
3
systems. Also, we have explored mitigation techniques of nonlinear impairment by higher order Raman amplifier scheme and constellation shaping.
1.3 Outline of the dissertation
The thesis consists of 8 chapters. The second chapter is devoted to the modulation formats and detection schemes. The coherent detection technology based on Digital Signal Processing (DSP) technology combined with advanced modulation formats, can significantly improve the transmission capacity of the system, and simplify the complexity of the system if the polarization multiplexing technology is recombined. Polarization multiplexing (PM) can double the spectral efficiency of the system. In this chapter, we summarize the modulation format and Forward Error Correction (FEC) of optical coherent link, and describe some important aspects of DSP and coherence detection.
Chapter 3 focuses on fiber dispersion and nonlinearity, which are extremely important to consider for the high-capacity systems. Starting with introducing the fundamental nonlinear Schrodinger equation, such as attenuation, chromatic dispersion, polarization model dispersion (PMD), nonlinear interference noise. Then, we have comprehensively investigated transmission property of single-channel 10 Gbps signal in dispersion shifted fiber (DSF). Quite different feature of signal degradation in positive and negative dispersion regimes is clarified in terms of signal operation wavelength as well as transmission distance. Intrinsic nonlinear degradation near zero dispersion is found to be symmetric in terms of wavelength despite that modulation instability gain should vanish in normal dispersion with deviation from zero dispersion.
Chapter 4 investigates the non-repeatered systems performance using numerical method for 100Gbps and beyond 100Gbps systems. We have numerically evaluated very high power transmission property and BER performance of 120Gbps digital coherent signals. If the maximum transmitter powers are defined as the powers at which BER floor levels are 1.0×10⁻² without error correction, those are found to be approximately +20.4 dBm, +14.8 dBm and +10.6 dBm, respectively, for single-channel 120Gbps DP-QPSK, DP-16QAM and DP-64QAM formats in large-core and low-loss single-mode silica fibers. We also show that the maximum transmitter powers gradually decrease in logarithmic feature with the increase of the number of DWDM channels. The channel number dependence is newly shown to be almost independent on the modulation format.
4
bibliographical background, and introduced the model formulas, also the main derivation steps are given. Then we directly discuss the subject of GN model accuracy with adjustment parameters. The calculation results using extended Gaussian-Noise (GN) model with adjustment parameters have been compared with the numerical simulation results, not only to confirm the validity of the results but to explore possible new analytical modeling for non-repeatered systems.
Chapter 6 is devoted to nonlinear mitigation techniques, digital back propagation to compensate nonlinearity impairments in non-repeatered systems. With nonlinear compensation by using digital back propagation (DBP) at receiver side, we have found that 2 dB improvement is achievable compared with the performance without DBP. However, the performance is affected by nonlinear channel interference in DWDM non-repeatered systems, the improvement has been reduced to 0.6dB due to disturbance from neighboring DWDM channels. Furthermore we newly confirmed that the negative dispersion which change the optical pulse waveform at transmitter side increase the maximum input power by 0.2dB in single channel.
In chapter 7, Raman amplifier is studied to improve the maximum transmitter power in non-repeatered systems. We investigated the implementation of up to third-order Raman amplification as well as conventional (first order) Raman amplification. Then, a comparison of the resulting performances are made for first-order through third-order pumpings. For third-order Raman amplification, the equivalent Tx power is enhanced +24.0dBm, about 8dB increase compared with that without Raman Amplifier.
Finally, chapter 8 gives a conclusion of this paper.
References
[1] Z. Xiang, and, C. J. Xie, “Chapter 1 Introduction and references therein” in Enabling Technology for High-Efficiency Optical Communication Networks, ed. Z. Xiang and C. J. Xie, pp. 1-11, John Wiley & Sons, Inc., 2016.
[2] K. Kikuchi, “Fundamentals of Coherent Optical Fiber Communications,” Journal of Lightwave Technology, vol. 34, no. 1, pp. 157-179, 2016.
[3] M. Nakazawa, K. Kikuchi, and T. Miyazaki, ed., High Spectral Density Optical Communication Technologies, Springer, 2010.
[4] Y. Aoki, Y. Inada, T. Ogata, L. Xu, S. L. Zhang, F. Yaman, and E. Mateo, “Next-generation 100 Gb/s undersea optical communications,” IEEE Communications Magazine, vol. 50 , no. 2, pp. 50-57, 2012.
5
http://www.capacitymedia.com/Article/3565973/FASTER-cable-system-ready-for-service. Jun. 2016.
[6] H. Fevrier, B. Clesca, P. Perrier, D. Chang and W. S. Pelouch, “Chapter7 Unrepeatered Transmission and references therein” in Undersea Fiber Communication Systems, 2nd ed., ed. J. Chesnoy, pp. 261-300, Academic Press, 2016.
[7] V. Gainov, N. Gurkin, S. Lukinih, S. Makovejs, S. Akopov, S. Ten, O. Nanii, V. Treshchikov, and M. Sleptsov, “Record 500 km unrepeatered 1 Tbits/s (10×100G) transmission over an ultra-low loss fiber,” Optics Express, vol. 22, no. 19, pp. 22308-22313, 2014.
[8] H. Bissessur, C. Bastide, S. Dubost, and S. Etienne, “80 × 200 Gb/s 16-QAM unrepeatered transmission over 321 km with third order Raman amplification,” Optical Fiber Communication Conference 2015 (OFC2015), paper W4E.2, 2015.
[9] D. Chang, W. Pelouch, P. Perrier, H. Fevrier, S. Ten, C. Towery, and S. Makovejs, “150 × 120 Gb/s unrepeatered transmission over 409.6 km of large effective area fiber with commercial Raman DWDM system,” Optics Express, vol. 22, no. 25, pp. 31057-31062, 2014.
[10] D. Chang, P. Perrier, H. Fevrier, S. Makovejs, C. Towery, X. T. Jia, L. Deng, and B. Z. Li, “Ultra-long unrepeatered transmission over 607 km at 100G and 632 km at 10G,” Optics Express, vol. 23, no. 19, pp. 25028-25033, 2015.
[11] T. J. Xia, D. L. Peterson, G. A. Wellbrock, D. Chang, P. Perrier, H. Fevrier, S. Ten, C. Tower, and G. Mills, “557-km Unrepeatered 100G Transmission with Commercial Raman DWDM System, Enhanced ROPA, and Cabled Large Aeff Ultra-Low Loss Fiber in OSP Environment,” Optical Fiber Communication Conference 2014 (OFC2014), no. Th5A.7, 2014.
[12] P. Poggiolini, “The GN Model of Non-Linear Propagation in Uncompensated Coherent Optical Systems,” Journal of Lightwave Technology, vol. 30, no. 24, pp. 3857-3879, 2012.
7
Chapter 2 Modulation and detection schemes
2.1 Introduction
Optical fiber communication systems traditionally uses basic modulation, such as on-off-keying (OOK) and differential phase shift keying (DPSK) [1]. Coherent receiver technology promotes the emergence of advanced modulation formats, and the simplest form is the binary phase shift keying (BPSK) in all four quadrature parallels and polarization multiplexed quadrature shift keying (PM-QPSK) [2-3]. The choice of modulation formats in optical fiber communication system is very important for it determines the upper limit of spectrum efficiency. Furthermore, it measures the degree of channel space utilization (bandwidth and signal dimension). In addition, increasing FEC can improve the noise tolerance, as a result of reducing the spectral efficiency.
The combination of coherent detection and DSP technology makes it possible to recover carrier phase in electric field, and the matching of polarization state of signal with local oscillator light becomes possible, which eliminates two main technical obstacles of traditional coherent optical communication system. The coherent receiver based on DSP technology has simple structure and transparent hardware. It can compensate linear and non-linear transmission impairment in the electric field, simplify transmission link, reduce transmission cost, support multi-level modulation format and polarization state multiplexing, and easily realize high spectral efficiency optical fiber transmission. Many advantages make coherent optical transmission system based on DSP technology an important choice for the next generation optical communication system, and the research on its transmission characteristics and receiving algorithms has been developed rapidly.
8
2.2 IM-DD (Intensity modulation / direct detection)
2.2.1 NRZ modulated signal
Non-return-to-zero (NRZ) modulation format is used to denote "0" when there is no voltage (or current). When the positive voltage is constant, it means "1". This simple waveform can be represented by the following rectangular profile:
a(t) = {1 𝑓𝑜𝑟 0 < 𝑡 < 𝑇 0 𝑒𝑙𝑠𝑒𝑤ℎ𝑒𝑟𝑒
Each bit encoding takes up the width of all the symbols. In this way, there is no gap between a bit and its next bit, and it is not easy to distinguish.
The low spectrum spread of NRZ coding makes it less sensitive to dispersion. However, due to continuous waveform overlap and inter symbol interference, it is vulnerable to system damage. A long sequence of identical symbols will lead to the loss information of digital period and phase, which makes the synchronization in the receiver very difficult.
2.2.2 RZ modulated signal
In return-to-zero (RZ) coding, positive level represents logic 1, and negative level represents logic 0, and the signal returns to zero level after every bit transmitted. The duration of the light pulseεT is much shorter than the bit period. The rectangular waveform function of RZ is shown below:
a(t) = {1 𝑓𝑜𝑟 0 < 𝑡 < 𝜀𝑇 0 𝑒𝑙𝑠𝑒𝑤ℎ𝑒𝑟𝑒
The parameter 𝜀 < 1 is called the duty of the modulation. For the pulse duration is very short, RZ coding can be used in optical time division multiplexing (OTDM). RZ coding also has some resistance to optical fiber nonlinearity. Therefore, it can effectively reduce its bandwidth requirements in practical applications.
2.3 Modulation scheme for coherent detection
9
First, blind estimation or pilot-aided estimation algorithm [4-6] is used to recover carrier phase, symbol clock and polarization. Second, the waveform is filtered and sampled. The third and last procedure receives a sequence of bits by connecting the bits corresponding to each symbol. Then the digital overhead was removed, including FEC decoding and frame synchronization. When choosing the modulation format, the spectral efficiency, noise tolerance and modulation complexity should be considered.
In this section, modulation and coding are discussed. We represent digital modulation symbols as sequence of complex numbers and then use it to generate actual waveforms. We introduce the basic modulation principles of QPSK and QAM, and their constellation diagram. Finally, the basic principles of FEC.
2.3.1 QPSK
Phase shift keying (PSK) represents 1 and 0 by changing the phase of the carrier signal. In a bit period, the peak amplitude and frequency remain constant. The function expression is as follows:
s(t) = {𝐴𝑐𝑜𝑠(2𝜋𝑓𝐴𝑐𝑜𝑠(2𝜋𝑓𝑐𝑡), 𝑏𝑖𝑛𝑎𝑟𝑦 1 𝑐𝑡 + 𝜋), 𝑏𝑖𝑛𝑎𝑟𝑦 0 A: amplitude. 𝑓𝑐: frequency of carrier signal.
Phase shift keying is less error-prone than amplitude shift keying and requires the same bandwidth as amplitude shift keying. However, the process of signal detection and recovery is more complex than ASK and frequency shifter keying (FSK).
Quadrature shift keying (QPSK): equals to 4-PSK, and the phase shifts of π/2 rad, generated 4 different signals of each representing 2 bits. The function expression is as follows: s(t) = { 𝐴𝑐𝑜𝑠(2𝜋𝑓𝑐𝑡), 𝑏𝑖𝑛𝑎𝑟𝑦 00 𝐴𝑐𝑜𝑠 (2𝜋𝑓𝑐𝑡 +𝜋2) , 𝑏𝑖𝑛𝑎𝑟𝑦 01 𝐴𝑐𝑜𝑠(2𝜋𝑓𝑐𝑡 + 𝜋), 𝑏𝑖𝑛𝑎𝑟𝑦 10 𝐴𝑐𝑜𝑠 (2𝜋𝑓𝑐𝑡 +3𝜋2 ) , 𝑏𝑖𝑛𝑎𝑟𝑦 11 A: amplitude. 𝑓𝑐: frequency of carrier signal.
QPSK carriers more data rate than PSK at the same bandwidth. However, higher rate PSK schemes are limited by the ability of equipment to distinguish small differences in phase.
10
For quadrature amplitude modulation (QAM), two 90-degree phase-shifted carriers are modulated, which results in the amplitude and phase changes of the generated signal [7]. At the receiver, the phase and amplitude, or the two quadrature of the field, must be clearly measured. The arrangement of points in the constellation gives it the maximum possible distance so that they can be more easily distinguished after channel demage. However, in order to make modulation more convenient, these points are arranged on square grids with the same vertical and horizontal spacing. Although square QAM does not fully maximize the Euclidean distance between constellation points, it is widely used because it is easy to implement.
As we can see from the Fig. 2.1, QAM uses two-dimensional signals. The original information flow is divided into two sequences, which are composed of odd symbols and even symbols. For example, x (t) and y (t). x (t) sequence is modulated by𝑐𝑜𝑠(2𝜋𝑓𝑐𝑡). y (t) sequence is modulated by 𝑠𝑖𝑛(2𝜋𝑓𝑐𝑡) . Composite signal x(t)𝑐𝑜𝑠(2𝜋𝑓𝑐𝑡) + 𝑦(𝑡)𝑠𝑖𝑛(2𝜋𝑓𝑐𝑡) is sent through the channel.
QAM demodulation by multiplying x(t)𝑐𝑜𝑠(2𝜋𝑓𝑐𝑡) + 𝑦(𝑡)𝑠𝑖𝑛(2𝜋𝑓𝑐𝑡) by 𝑐𝑜𝑠(2𝜋𝑓𝑐𝑡) and then low-pass filtering the resultant signal, sequence x (t) is obtained. And by multiplying x(t)𝑐𝑜𝑠(2𝜋𝑓𝑐𝑡) + 𝑦(𝑡)𝑠𝑖𝑛(2𝜋𝑓𝑐𝑡) by 𝑠𝑖𝑛(2𝜋𝑓𝑐𝑡) and then low-pass filtering the resultant signal, sequence y (t) is obtained. In QAM, the combination of various amplitudes and phases can achieve a higher data rate. The variations of amplitude are susceptible to noise. In QAM system, the number of phase shifts is larger than the number of amplitude shifts.
Figure 2.1 Modulation of Digital Data: QAM.
11
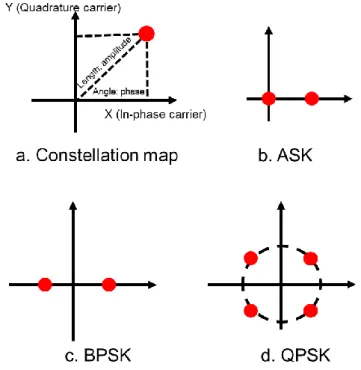
Constellation diagram is used to represent a possible symbol of the selected modulation scheme, as shown in Figure 2.2.
Figure 2.2 a. Constellation Diagram for b. ASK (OOK), c. BPSK and d. QPSK.
The X-axis represents the in-phase carrier, and the projection of the in-phase carrier on the X-axis defines the peak amplitude of the in-phase component. The Y-axis represents the quadrature component, and the projection of the quadrature carrier on the Y-axis defines the peak amplitude of the quadrature component. The linear length from the connection point to the origin is the peak amplitude of the signal. The angle between the line and the X-axis is the phase of the signal element.
2.4 Digital coherent detection technology
2.4.1 Coherent detection
12
IMDD system at 10Gb/s, as a result of providing significantly increased capacity; (iii) Coherent detection provides better sensitivity than IMDD systems; (iv)Digital coherence detection has dramatically changed the way to manage nonlinear impairments in optical communication systems. Many nonlinear mitigation techniques developed for direct detection systems such as dispersion management are not effective and become unsatisfactory in coherent detection systems [12-13]. PMD helps to reduce fiber nonlinearity [14-15], and fiber nonlinearity can be mitigated through DSP in transmitters and receivers [16].
2.4.2 DSP
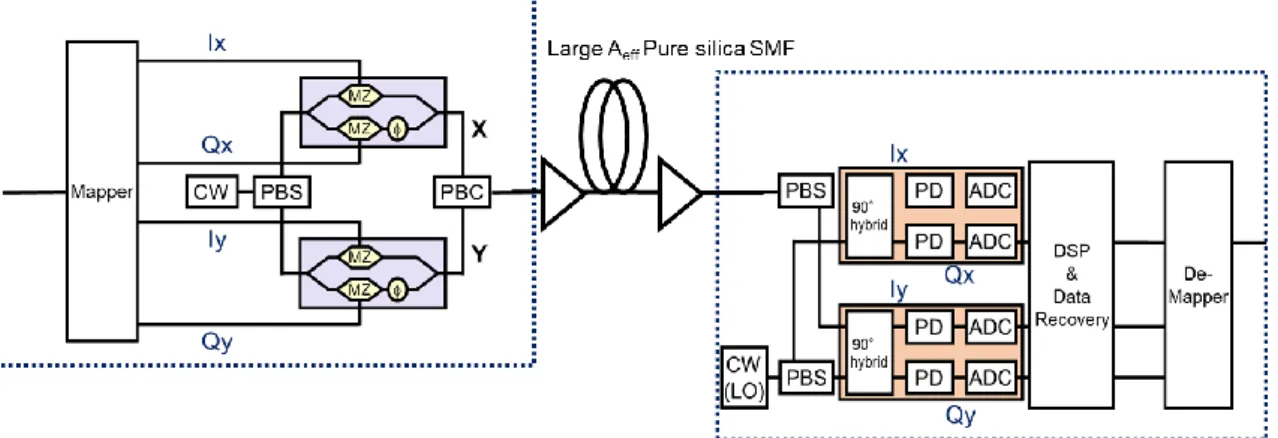
The development of advanced digital signal processing (DSP) has led to the paradigm shift of coherent optical receivers in optical communications. Figure 2.3 shows the functional block diagram of a typical DSP enabled coherent transmitter and receiver.
Figure 2.3 Functional block diagrams for coherent transmitter and receiver.
For the transmitter shown in the left figure, a continuous wave (CW) from a low linewidth laser is divided into two parts, one for each polarization, and each part is modulated by an in-phase/quadrature (I/Q) modulator by electrical signals from digital-to-analog converter (DACs).
13
converted into two analog signals, which are used to drive the I/Q modulator to up-convert the baseband electrical signal into optical signal for transmission. During the propagation of the optical fiber, the signal polarization is not maintained, but rotated randomly.
With the development of high-speed electronic technology, signals are first mixed with local oscillator (LO) in photoelectric detector of coherent receiver by analog-to-digital converters (ADCs), then converted into digital format. The signal is recovered by digital signal processing (DSP), for example carrier phase recovery and polarization alignment and separation are the main obstacles to early coherent receiver simulation, which can be realized by complex DSP in the electrical field.
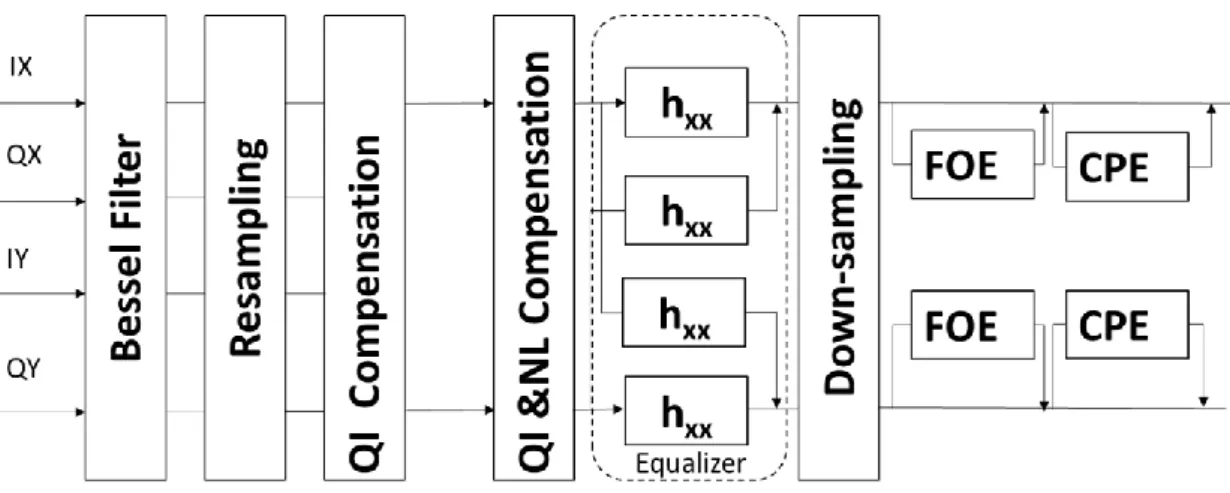
The post-transmission DSP includes the main functional blocks shown in Figure 2.4: (i) filter and resampling, (ii) dispersion compensation, (iii) nonlinearity compensation, (iv) adaptive equalizer, and (v) frequency offset estimation and carrier phase offset estimation. The Digital Square and filter algorithm [17] is used for timing recovery scheme. Then, the adaptive equalizer by two-stage constant modulus algorithm-radius directed (CMA-RD) algorithm [18, 19] is used to compensate for residual chromatic dispersion, polarization mode dispersion (PMD) and to reduce inter- symbol interference. In the equalizer, the butterfly structure is applied for polarization demultiplex. After that, frequency offset estimation (FOE) and carrier phase offset estimation (CPE), by the blind phase search (BPS) algorithm [20], are performed to regenerate the I/Q signal.
14
2.5 BER, SNR and Q Value
Optical Signal-to-Noise Ratio (OSNR): Used to quantify the degree of interference of optical noise with optical signals. It is the ratio of signal power to noise power within effective bandwidth [21].
Bit Error Rate (BER): The ultimate indicator of transmission quality. Due to noise, nonlinear effects, and chromatic dispersion, polarization mode dispersion, the waveform of the optical signals coupled into the fiber will be distorted when transmitted to the terminal. So when the receiver converts the optical signal into electrical signals, bit error will occur.
The optical signal-to-noise ratio can indirectly reflect the bit error rate and can provide an early warning of BER degradation.
Q value: The Q value and the bit error rate have a one to one mapping. A smaller BER value represents a larger Q value and better link performance. Gray coding is assumed for all formats. The BER for each modulation format is given by the following formula.
BER = 𝐶1erfc√𝐶2𝑆𝑁𝑅 OSNR = SNR(𝑅𝑠/𝐵𝑟𝑒𝑓) erfc(x) = 1 − erf(x) = 2 √𝜋∫ 𝑒 −𝑡2 ∞ 𝑥 𝑑𝑡 = 𝑒−𝑥2 𝑒𝑟𝑓𝑐𝑥(𝑥);
Where C1 and C2 can be found in the following Table 2.1. And in Figure 2.5, shows the relationship between BER and SNR.
Table 2.1 C1 and C2 for different modulation formats
Modulation Format Symbol Rate C1 C2
DP-BPSK 60 1/2 1
DP-QPSK 30 1/2 1/2
DP-16QAM 15 3/8 1/10
15
Figure 2.5 Relationship between BER and SNR (baseband SNR and OSNR).
2.6 Simulations for different modulation format
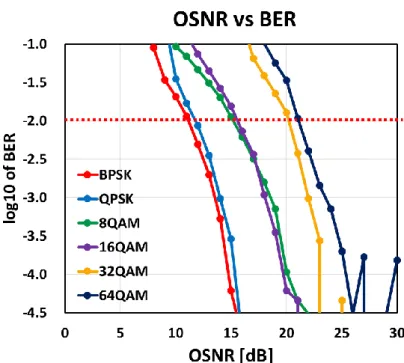
Figure 2.6 shows the simulation examples for different modulation format, the constellation map and spectrum. Figure 2.7 shows the back to back receiver sensitivity. The OSNR at BER=1.0×10⁻² are 11dB, 12dB, 15dB, 16dB, 20dB and 21dB for BPSK, QPSK, 8QAM, 16QAM, 32QAM and 64QAM, respectively, which is in accordance with the theoretical results in Figure 2.5.
16
Figure 2.7 the back to back receiver sensitivity for modulation formats.
2.7 Concluding remarks
The coherent detection technology based on DSP technology combined with advanced modulation formats, such as quadrature phase shift keying (QPSK) and quadrature amplitude modulation (QAM), can greatly improve the transmission capacity of the system, and simplify the complexity of the system if the polarization multiplexing technology is recombined. Polarization multiplexing (PM) can double the spectral efficiency of the system.
In this chapter, we summarize the basic definitions and performance advantages of traditional modulation formats, the main coherent modulation formats and their performance characteristics. We introduce digital coherent detection technology, including coherent detection technology and digital signal processing. Some basic parameters for evaluating the system performance are introduced. Finally we test the simulation results of different modulation formats, which are basically consistent with the predicted theoretical values.
References
17
[2] G. Charlet, M. Salsi, J. Renaudier, O. B. Pardo, H. Mardoyan, S. Bigo, “Performance comparison of singly-polarised and polarisation-multiplexed coherent transmission at 10 Gbauds under linear impairments”, Electron Letter, vol. 43, no. 20, pp. 1109-1111, 2007. [3] H. Sun, K. T. Wu, and K. Roberts, “Real-time measurements of a 40 Gb/s coherent system,” Optics Express, vol. 16, no. 2, pp. 873-879, 2008.
[4] S. J. Savory, “Digital coherent optical receivers: algorithms and subsystems,” IEEE Journal of Selected Topics in Quantum Electronics, vol. 16, no. 5, pp. 1164-1179, 2010. [5] X. Zhou, “Efficient clock and carrier recovery algorithms for single-carrier coherent optical systems,” IEEE Signal Process Magazine, vol. 31, no.2, pp. 35-45, 2014.
[6] A. P. T. Lau, et al., “Advanced DSP techniques enabling high spectral efficiency and flexible transmissions,” IEEE Signal Process Magazine, vol. 31, no. 2, pp. 82-92, 2014. [7] J. G. Proakis, Digital communications, 3rd ed., New York, McGraw-Hill Inc., 1995. [8] M. G. Taylor, “Coherent detection method using DSP for demodulation of signal and subsequent equalization of propagation impairments,” IEEE Photon Technology Letter, vol. 16, no.2, pp. 674-676, 2004.
[9] R. Noe, “PLL-free synchronous QPSK polarization multiplex/diversity receiver concept with digital I&Q baseband processing,” IEEE Photon Technology Letter, vol. 17, pp. 887-889, 2005.
[10] K. Kikuchi, “Phase-diversity homodyne detection of multilevel optical modulation with digital carrier phase estimation,” IEEE Journal of Selected Topics in Quantum Electronics, vol. 12, no. 4, pp. 563-570, 2006.
[11] Y. Han, and G. Li, “Coherent optical communication using polarization multiple-input multiple-output,” Optics Express, vol. 13, pp. 7527-7534, 2005.
[12] V. Curri, P. Poggiolini, A. Carena, and F. Forghieri, “Dispersion compensation and mitigation of nonlinear effects in 111-Gb/s WDM coherent PM-QPSK systems,” IEEE Photonics Technology Letters, vol. 20, pp. 1473-1475, 2008.
[13] A. Bononi, N. Rossi, and P. Serena, “Transmission limitations due to fiber nonlinearity,” Proceedings of OFC/NFOEC’2011, paper OWO7, 2011.
[14] G. Charlet, J. Renaudier, M. Salsi, H. Mardoyan, P. Tran, and S. Bigo, “Efficient mitigation of fiber impairments in an ultra-long haul transmission of 40Gbit/s polarization-multiplexed data by digital processing in a coherent receiver,” Proceedings of OFC/NFOEC’2007, paper PDP17, 2007.
18
[16] L. Li, Z. Tao, L. Dou, W. Yan, S. Oda, T. Tanimura, T. Hoshida, and J. C. Rasmussen, “Implementation efficient nonlinear equalizer based on correlated digital backpropagation,” Proceedings of OFC/NFOEC’2011, paper OWW3, 2011.
[17] M. Oerder, and H. Meyr, “Digital Filter and Square Timing Recovery”, IEEE transactions on communications, vol. 36, no. 5, pp. 605-612, 1988.
[18] D. N. Godard, “Self-Recovering Equalization and Carrier Tracking in Two-Dimensional Data Communication Systems”, IEEE Transactions on Communications, vol. COM-28, no. 11, pp. 1867-1875, 1980.
[19] W. A. Sethares, G. A. Rey, and C. R. Johnson, “Approaches to blind equalization of signals with multiple modulus,” Proc. Int. Conf. Acoustics, Speech, Signal Process, vol. 2, pp. 972-975, 1989.
[20] T. Pfau, S. Hoffmann, and R. Noe, “Hardware-Efficient Coherent Digital Receiver Concept With Feed-forward Carrier Recovery for M-QAM Constellations”, Journal of Lightwave Technology, vol. 27, no. 8, pp. 989-999, 2009.
19
Chapter 3 Fundamentals of optical fiber
propagation
3.1 Introduction
The combination of advanced modulation formats such as DP-QPSK, DP-16QAM and DP-64QAM with coherent detection technology has become the preferred scheme for realizing 40/100G optical network. The scheme can compensate for the linear impairments introduced by the optical signal in the transmission process at the receiver. Therefore, the important factors that limit the communication performance of this scheme are the nonlinear impairment caused by optical signals in the transmission process, including self-phase modulation (SPM), cross-phase modulation (XPM), four-wave mixing (FWM) and nonlinear phase noise and so on. For the common multichannel wavelength division multiplexing (WDM) systems, the XPM effect between channels is particularly serious for polarization multiplexing systems. It not only disturbs the phase of the signal, but also causes another serious nonlinear damage, called cross-polarization modulation between channels.
In this chapter, nonlinear Schrodinger equation in optical communication systems are mainly discussed in section 3.2, including attenuation, chromatic dispersion, polarization mode dispersion and nonlinear interference noise (SPM, XPM, FWM). Then in section 3.3 nonlinear propagation characteristics of 10Gbps signal in DSF was investigated by simulation methods. Finally, we make a conclusion in section 3.4.
3.2 Non-linear Schrödinger equation
Like any other physical propagation, an optical communication channel is called a waveform channel, which communicates a time-varying voltage from one point to another. A complication for optical links is that the fiber propagation of the signal waveform is conventionally modeled with a nonlinear partial differential equation, the nonlinear Schrödinger equation (NLSE), where fiber dispersion, nonlinearities, and amplifier noise distort the signal:
𝜕𝐸(𝑧, 𝑡) 𝜕𝑧 = 𝑗 𝛽2 2 𝜕2 𝜕𝑡2𝐸(𝑧, 𝑡) − 𝛼𝐸(𝑧, 𝑡) − 𝑗𝛾|𝐸(𝑧, 𝑡)|2𝐸(𝑧, 𝑡)
20
An even more effective one is the Manakov equation which accounts for both polarizations: 𝜕𝐸𝑥(𝑧, 𝑡) 𝜕𝑧 = 𝑗 𝛽2 2 𝜕2 𝜕𝑡2𝐸𝑥(𝑧, 𝑡) − 𝛼𝐸𝑥(𝑧, 𝑡) − 𝑗𝛾 8 9[|𝐸𝑥(𝑧, 𝑡)|2+ |𝐸𝑦(𝑧, 𝑡)| 2 ]𝐸𝑥(𝑧, 𝑡) 𝜕𝐸𝑦(𝑧, 𝑡) 𝜕𝑧 = 𝑗 𝛽2 2 𝜕2 𝜕𝑡2𝐸𝑦(𝑧, 𝑡) − 𝛼𝐸𝑦(𝑧, 𝑡) − 𝑗𝛾 8 9[|𝐸𝑥(𝑧, 𝑡)|2+ |𝐸𝑦(𝑧, 𝑡)| 2 ] 𝐸𝑦(𝑧, 𝑡)
3.2.1 Attenuation
The attenuation of an optical fiber measures the amount of light lost between input and output. Optical losses of a fiber are usually expressed in decibels per kilometer (dB/km). The expression in called the fiber attenuation coefficient a and the expression is
α = − 10 𝑧[𝑘𝑚]log (
𝑃(𝑧) 𝑃(0))
where 𝑃(𝑧) is the optical power at a position z from the origin, 𝑃(0) is the power at the origin.
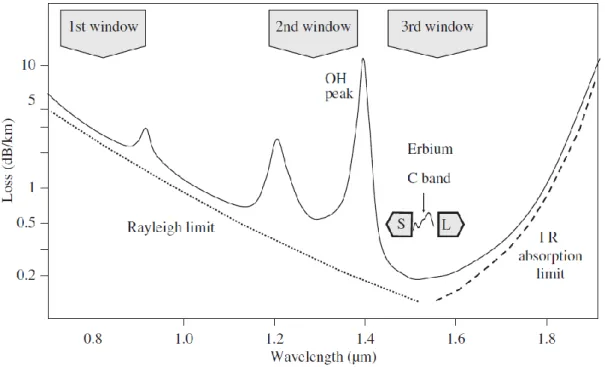
For a given fiber, these losses are wavelength-dependent which is shown in the figure below. The value of the attenuation factor depends greatly on the fiber material and the manufacturing tolerances. It can be divided in three window shown in Figure 3.1:
Figure 3.1 Attenuation Spectrum of optical fiber. (After reference Chesnoy, José-Undersea Fiber Communication Systems, Second Edition-Academic Press (2015) chapter 1)
21
Second window centered around 1300nm with typical value of attenuation of 0.4 to 0.5 dB/km.
Third window centered around 1550nm with value of attenuation of 0.2 to 0.25 dB/km.
3.2.2 Chromatic dispersion and Polarization model dispersion
Chromatic dispersion (CD) is an important factor in fiber optic communications. It is the result of the different wavelengths, in a light beam arriving at their destination at slightly different times. It can be seen that in the frequency domain the chromatic dispersion introduces a distortion on the phase of the signal spectrum without changing the spectral power distribution and at the end of the propagation the pulse result broadened.
The group velocity dispersion (GVD) parameter 𝛽2 gives the time delay between two different spectral component separated by a certain frequency interval. Usually the dispersion is measured with the dispersion coefficient D defined as:
D = −2𝜋𝑐 𝜆2 𝛽2
where λ = −2πc/ω is the carrier wavelength and c is the speed of light. D gives the time delay between two different spectral component separated by a certain wavelength interval.
Polarization is the property of waves, which can oscillate with more than one orientation. Until recently, with the emergence of digital coherent detection, polarization division multiplexing (PDM) of transmitted signals on two orthogonal states of polarization of the same wavelength has been widely used in optical communication systems [1-4]. Since all optical field information can be retained and accessed after coherent detection, optical phase and polarization can be used to encode data, which significantly improves the spectral efficiency and capacity of optical communication systems. In details, signals are first mixed with local oscillator (LO) in photoelectric detector of coherent receiver by analog-to-digital converter (ADC), then converted to digital format, and digital signal processing (DSP) is used to recover signals.
3.2.3 Nonlinear interference noise
22
signal and co-propagating optical amplifier noise; (iii) noise-noise contributions caused by the nonlinear interaction between amplifier noise and its own [5]. In practical related WDM systems, the transmitted signals are obviously stronger than the co-propagating noise, so the signal-signal contribution constitutes the main nonlinear impairments [6-7]. Nonlinear effects can also be caused by inelastic scattering, such as simulated Brillouin scattering (SBS) and stimulated Raman scattering (SRS). SBS and SRS are inelastic processes in which part of the optical wave power is absorbed by the optical medium. These effects can be neglected because channel interaction due to stimulated Raman scattering (SRS) effect is not considered in C-band [8].
In general, the nonlinearity of optical fibers can be divided into intra-channel and inter-channel nonlinearities. Intra-inter-channel nonlinearity can be further divided into SPM, intra-channel FWM (IFWM) and intra-intra-channel XPM (IXPM) [9,10]. Inter-intra-channel nonlinearity includes FWM, XPM and XPolM. According to the system parameters such as CD value, bit rate and modulation formats, one or more non-linear effects are more dominant than other effects. For example, in systems with low bit rate and CD value, FWM is the main nonlinear effect [11, 12], and XPolM may be the most disadvantageous nonlinear effect [13] in similar WDM PDM-QPSK systems with dispersion management. Regardless of direct detection or coherent detection, the nonlinearity of optical fibers propagating in optical fibers is the same, but the difference lies in the transmission mode of information. In coherent detection system, besides amplitude, information is also carried by phase, and PDM is usually used to double the spectral efficiency. As a result, the phase and polarization distortion caused by XPM and XPolM, which are neglected in direct detection system, may cause serious damage in coherent detection system.
In coherent systems without any optical dispersion compensator, the signals spread rapidly in time due to large cumulative CD. The main nonlinear effects are intra-channel nonlinearity, such as IFWM and IXPM. For dispersion compensated coherent optical communication systems with inline optical dispersion compensators, the main non-linearity effect is channel nonnon-linearity, including channel XPolM and inter-channel XPM. Whether XPolM or XPM is dominant depends on the actual system configurations.
3.3 Nonlinear Propagation Characteristics of 10 Gbps Signal
in DSF
23
The modulation instability (MI) can be interpreted in terms of four-wave-mixing (FWM) process that is phase-matched by self-phase modulation (SPM), and this requires anomalous (positive) dispersion to occur for single wavelength input [14]. If the signal wavelength is set at or near zero dispersion region of transmission fiber in long-haul optical amplifier repeatered system, severe SNR degradation is known to be induced due to parametric amplification (MI gain) of ASE noise on each side of the signal [15]. In order to mitigate the degradation, non-zero dispersion shifted fiber, dispersion management fiber, and etc. are applied in most of optical amplifier repeatered systems [16]. Probably due to the effectiveness of such a dispersion management, nonlinear propagation at and near zero dispersion has so far attracted little attention.
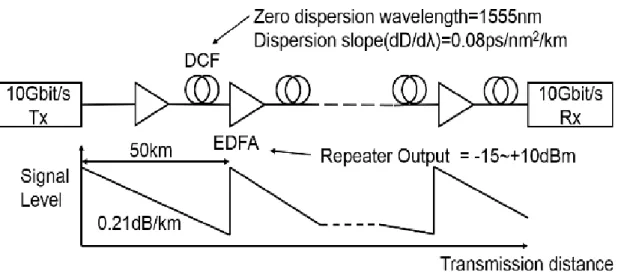
In this section, we have comprehensively investigated transmission property of single-channel 10 Gbps signal in DSF at and near zero dispersion in terms of signal power and wavelength as well as transmission distance. We consider typical optical amplifier repeatered system as shown in Figure 3.2.
Figure 3.2 Simulated system model.
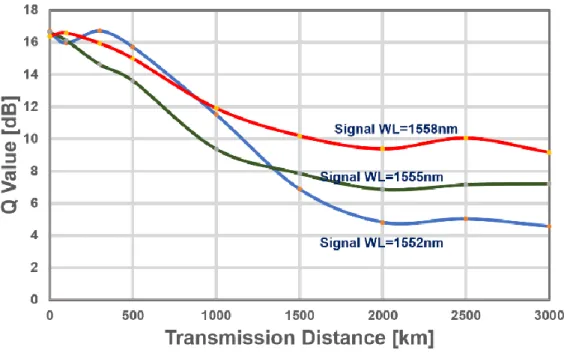
3.3.2 Results and discussions
Figures 3.3 and 3.4 show evolution of Q values and examples of received signal waveforms without dispersion compensation, respectively, as a function of transmission distance, at a wavelength of 1552 nm, 1555 nm and 1558 nm. Here, transmitter power and repeaters’ output power are set at +3dBm. It can be seen from Fig.3.3 that, in all cases, Q values decreases with distance that is due to combined effect of noise accumulation, dispersion and fiber nonlinearity.
24
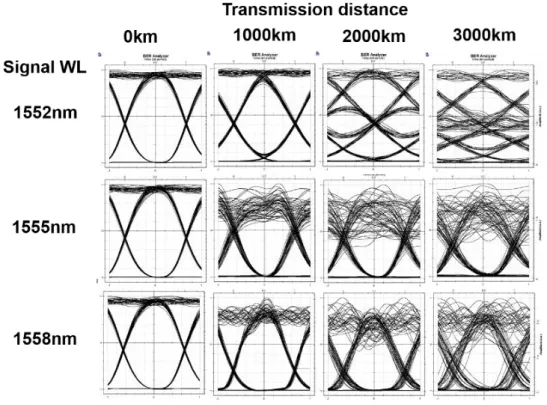
ps/nm/km) at 1552 nm wavelength, signal waveforms broadened with distance and severe inter-symbol-interference (ISI) occurs for distances exceeding approximately 1000 km transmission distance. This is a typical appearance of self-phase-modulation. By contrast, at 1555 nm and 1558nm of zero and positive dispersion (+0.24 ps/nm/km), large noise-like fluctuations are seen to impose on “mark” symbols. This enhancement of fluctuations is presumably due to nonlinear parametric interaction between signal and ASE noise, which excessively amplifies the noise on each side of the signal wavelength.
25
Figure 3.4 Examples of received waveforms.
Figure 3.5 Q value dependence on repeater output power.
26
As is seen in this figure that for lower signal powers, Q value increases with power in linear fashion, while with power increase, it saturated and then started to decrease. So there is the optimum power that maximize the transmission performance, which is dependent on signal wavelength or dispersion.
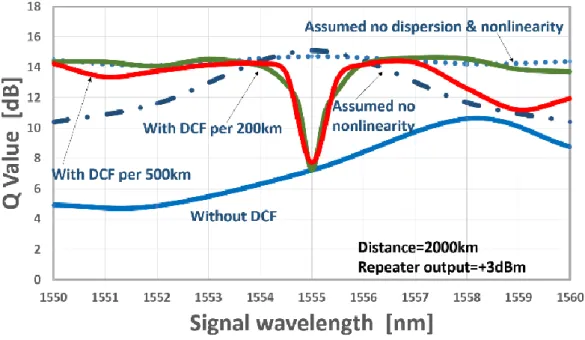
We have further investigated the Q value dependence on the operation wavelength with and without dispersion compensation. The results of Q values are shown in Fig.3.6. Here, in Fig.3.6, dotted and dashed-dotted lines are for hypothetical cases of being free from dispersion & nonlinearity and nonlinearity, respectively, to analyze the contribution of each effect on Q degradation. In this simulation, the dispersion compensation is applied at receiver side only and tuned to the optimum, at which the Q value is maximized. In addition, the compensation period is tested at both 200 km and 500 km and the results are also compared in the figure.
Figure 3.6 Q performance with and without dispersion compensation at 2000km transmission.
It can be seen from Fig.3.6 that, in case of without dispersion compensation, the Q value maximized at a wavelength of 1558 nm, which is due to soliton effect or balance between linear pulse broadening and nonlinear pulse compression. It is also clearly seen in this figure that, even with dispersion compensation, the Q value degradations were unable to be alleviated for λ0 ± 1 nm wavelength region, while, outside this wavelength band, the degradation was effectively cancelled out by dispersion compensation.
27
a wide signal wavelength range of 10 nm or more, excluding the wavelength range of λ0 ± 1 nm. It should be worthy to note that inherent nonlinear degradation near zero dispersion appears to be symmetric in terms of wavelength despite that MI gain should vanish in normal dispersion with deviation from zero dispersion.
3.4 Concluding remarks
Nonlinear effects have increasingly become an important factor limiting the transmission capacity of optical fiber communication system. In this chapter, nonlinear Schrodinger equation in optical communication systems are mainly discussed in section 3.2, including attenuation, chromatic dispersion, polarization mode dispersion and nonlinear interference noise (SPM, XPM, FWM). Then in section 3.3, we have comprehensively investigated transmission property of single-channel 10 Gbps signal in DSF. Quite different feature of signal degradation in positive and negative dispersion regimes is clarified in terms of signal operation wavelength as well as transmission distance. Further, intrinsic nonlinear degradation near zero dispersion is found to be symmetric in terms of wavelength despite that MI gain should vanish in normal dispersion with deviation from zero dispersion.
References
[1] S. J. Savory, et al., “Digital equalization of 40 Gbit/s per wavelength transmission over 2480 km of standard fiber without optical dispersion compensation,” Proceedings of ECOC’2006, paper Th2.5.5, 2006.
[2] H. Sun, K. T. Wu and K. Roberts, “Real-time measurements of a 40 Gb/s coherent systems,” Optics Express, vol.16, no. 2, pp. 873-879, 2008.
[3] W. Shieh, H. Bao, and Y. Tang, “Coherent optical OFDM: theory and design,” Optics Express, vol. 16, no. 2, pp. 841-859, 2008.
[4] A. H. Gnauck, et al., “Generation and transmission of 21.4-Gbaud PDM 64-QAM using a novel high-power DAC driving a single I/Q modulator,” Journal of Lightwave Technology, vol. 30, no. 4, pp. 532-536, 2012.
28
[7] P. Serena, “Nonlinear signal noise interaction in optical links with nonlinear equalization,” Journal of Lightwave Technology, vol. 34, no.6, pp. 1476-1483, 2016. [8] D. Semrau, R. I. Killey, and P. Bayvel, “The Gaussian Noise Model in the Presence of Inter-Channel Stimulated Raman Scattering,” Journal of Lightwave Technology, vol. 36, no. 14, pp.3046-3055, July 15, 2018.
[9] R. J. Essiambre, B. Mikkelsen, and G. Raybon, “Intra-channel cross-phase modulation and four-wave mixing in high-speed TDM systems” Electronics Letters, vol. 35, no.18, pp. 1576-1578, 1999.
[10] P. V. Mamyshev, and N. A. Mamysheva, “Pulse-overlapped dispersion-managed data transmission and intra-channel four-wave mixing,” Optics Letters, vol. 24, no. 21, pp. 1454-1456, 1999.
[11] R. W. Tkach, A. R. Chraplyvy, F. Forghieri, and A. H. Gnauck, “Four-photon mixing and high-speed WDM systems,” Journal of Lightwave Technology, vol. 13, no. 5, pp. 841-849, 1995.
[12] P. J. Winzer and R. J. Essiambre, “Advanced modulation formats for high-capacity optical transport networks,” Journal of Lightwave Technology, vol.24, no. 12, pp. 4711-4728, 2006.
[13] C. Xie, “Inter-channel nonlinearities in coherent polarization-division-multiplexed quadrature-phase-shift-keying systems,” IEEE Photonics Technology Letters, vol. 21, pp. 274-276, 2009.
[14] G. P. Agrawal, Nonlinear Fiber Optics, Academic Press, fifth ed., Chapter5, 2013. [15] N. Henmi, Y. Aoki, T. Ogata, T. Saito, and S. Nakaya, “A new design arrangement of transmission fiber dispersion for suppressing nonlinear degradation in long-distance optical transmission systems with optical repeater amplifiers,” Journal of Lightwave Technology, vol. 11, no. 10, pp. 1615-1621, 1993.
29
Chapter 4 Non-repeatered system and simulation
results
4.1 Introduction
In recent years, with the progress of high speed digital signal processing technology (DSP) and analog to digital conversion technology, coherent optical transmission technology has become a hot topic in the field of optical communication. With the combined technologies of coherent detection and digital signal processing (DSP), long-haul optical transmissions have become possible without optical dispersion compensation [1-3]. This enabled us to configure 100Gbps-based dense wavelength division multiplexed (DWDM) undersea and transcontinental trunk practical systems by utilizing ultra-low-loss and large effective area (Aeff) single-mode silica fibers (SMFs) for transmission line [4-5].
For non-repeatered system application, several reports have been published on both high-capacity and long-reach transmission [6]. And single-span transmission exceeding 400 km and/or a capacity-reach product of over 5 Pbps-km have been demonstrated by adoption of optimized Raman/Remote Optically Pumped Amplifier (ROPA) as well as high power booster amplifiers[7-11]. In those systems, the maximum transmission powers are considered to be limited by optical fiber nonlinearity, but, to the best of our knowledge, neither quantitative simulation studies nor experimental investigations have so far been reported on this topic.
4.2 BER characteristic on modulation formats
4.2.1 System configuration and simulation method
DP-30
16QAM and DP-64QAM. The transmission fiber assumed is a typical advanced silica SMF with a loss coefficient of 0.16 dB/km, effective core area of 130 μm2, chromatic dispersion of 20.5 ps/nm/km, and the nonlinear refractive index n2 of 2.2 × 10⁻²⁰ m2/W. The PMD is assumed 0.05 ps/km1/2. Each of the coherent receiver is set to receive -10 dBm/ch signal power through optical pre-amplifier with a noise figure of 4 dB, while the local oscillator power in the receiver is set at +10 dBm, so that shot noise limited receiver sensitivity can be achieved. The frequency response of electrical circuits are assumed to be ideally flat in both Tx and Rx. In the receiver, 4th order Bessel filter with bandwidth of 0.75×0.5×symbol rate is applied, in view of the pulse format of NRZ.
Figure 4.1 Non-repeatered system configuration for 120Gbps QPSK, 16QAM and DP-64QAM formats. Tx is transmitter, OPT MUX is optical multiplexer, OPT DEMUX is optical demultiplexer, Rx is receiver, SMF is single mode fiber, CW is continuous wave laser source, PBS is polarization beam splitter, PBC is polarization beam combiner, LO is local oscillator, PD is
photodiode, ADC is analog to digital converter, MZ is Mach-Zehnder Modulator and DSP is digital signal processor.
31
estimation (CPE), by the blind phase search (BPS) algorithm [15], are performed to regenerate the I/Q signal.
For numerical analyses, we have applied optical communication software simulation tool, OptiSystem ™ (Ver.14.1) from Optiwave Systems. This tool is adopted to adequately account for such system parameters as loss, dispersion, nonlinearity (Kerr effect) and polarization effects in optical fiber as well as coherent transmitter and receiver characteristics including optical ASE noise [16]. It should be worthy to note that, by adequate and careful parameters setting, general validity of system-level simulations by this kind of tools are checked in advance by comparing the simulation results with experimental results for long-distance transmission systems [4].
We have assumed the fiber loss constant and also have not taken into account the stimulated Raman scattering (SRS) effect, both of which will induce frequency-dependent WDM signal profile [17]. Separately-made test simulation considering the SRS has shown that the maximum Tx powers deviate approximately 0.4 dBp-p for C-band, 50 GHz-spaced 80 channels (32 nm bandwidth). Therefore for extremely wideband system extended to C+L band, we need to consider the frequency-dependent effects to discuss the maximum transmitter powers and its distribution among WDM channels of non-repeatered systems.
In all the simulation described here, we have used pseudo random binary sequence (PRBS) of 216 with a length of 65536. This data stream is bit-interleaved to configure two paths for X and Y polarizations. Then up to 1.5 × 10⁻⁵ BER can be calculated.
4.2.2 BER and constellation maps evolution for single-channel input
32
Figure 4.2 Evolution of constellation map (a.u.) with Tx power. (a) DP-QPSK, L=300 km transmission. (b) DP-16QAM, L=200 km transmission. (c) DP-64QAM, L=100 km transmission.
33
Figure 4.3 The BER characteristics for single channel DP-QPSK, DP-16QAM and DP-64QAM. (a) DP-QPSK-300km. (b) DP-16QAM-200km. (c) DP-64QAM-100km.
The above dependence on the modulation scheme will be attributable to the difference in symbol peak power. That is, QAM modulation applies both amplitude and phase modulation, while QPSK imposes only phase modulation. Then, in case of +16 dBm DP-QPSK, each symbol has +13 dBm power at the fiber input. On the other hand, in case of +16 dBm DP-16QAM, the symbols can be divided into three groups in terms of symbol powers. The most inner 4 symbols has a lowest power of +6.0 dBm and the most outer 4 symbols has a highest power of +15.6 dBm. Also, the rest of 8 symbols has a power of +13.0 dBm at the fiber input. Similarly, in case of +16 dBm DP-64QAM, the symbols can be divided in nine groups in terms of symbol powers, each of which are -0.2 dBm, +6.8 dBm, +9.3 dBm, +10.9 dBm, +12.1 dBm, +13.8 dBm, +14.4 dBm, +15.5 dBm and +16.7 dBm from the inner to outer symbols, respectively. Such a different amplitude and phase modulation would have resulted in the modulation dependence of the symbol distortion observed in Fig.4.2.
34
electron charge, and B is symbol rate/2 (Electrical receiver bandwidth is assumed to 0.75B). The DP-QPSK sensitivity difference between the two is 0.3dB and this could happen due to possible approximation errors contained in application of the simple formula. On the other hand, the difference is increased to 1.0 dB and 2.5 dB for DP-16QAM and DP-64QAM, respectively, which is considered due to increase of inter-symbol interference in the coherent receiver.
It is clearly seen from the figures in Fig.4.3 that all three cases the BER deteriorates, pursuant to Tx powers and approaches to specific floor levels. In other words, achievable BER is dominantly determined by Tx power regardless of received signal level. If we define the maximum Tx power as the power at which BER floor levels are 1.0×10⁻² at -25dBm received power or above, then those values are +20.4 dBm, +14.8 dBm and +10.6 dBm, for DP-QPSK, DP-16QAM and DP-64QAM, respectively. Here, linear extrapolation methodology is applied by using two curves close to 1.0×10⁻² in Fig.4.4 for each modulation: For example, in case of DP-QPSK, the BER saturation level is 1.4×10 -3 for 19dBm, while it is 5.7×10⁻³ for 20dBm, we get a value of +20.4 dBm by linear extrapolation of the above two points.