岩手医科大学 審 査 学 位 論 文
(博 士)
cerebral artery steno-occlusive disease
Hiroaki Saura, MD; Kuniaki Ogasawara, MD; Takaaki Beppu, MD; Koji Yoshida, MD;
Masakazu Kobayashi, MD; Kenji Yoshida, MD; Kazunori Terasaki, PhD; Yoshihiro Takai, MD; Akira Ogawa, MD
Department of Neurosurgery (H.S., K.O., T.B., K.Y., M.K., K.Y., A.O.) and Cyclotron Research Center (K.T.), School of Medicine, Iwate Medical University, Morioka, Japan; and Department of Radiology and Radiation Oncology (Y.T.), Hirosaki University Graduate School of Medicine, Hirosaki, Japan
All correspondence to:
Hiroaki Saura, M.D.
Department of Neurosurgery, School of Medicine, Iwate Medical University, 19-1 Uchimaru, Morioka, Iwate 020-8505, Japan
Telephone: +81-19-651-5111 (ext. 6605) Fax: +81-19-625-8799
Email: [email protected]
cerebral artery steno-occlusive disease
Cover title: Hypoxic viable tissue and ischemia
Word count (title page, abstract, main body of text, disclosures, reference, figure legends and tables): 5825 words
Number of figures: 4 (3 graphs) Number of tables: 2
Key Words: Hypoxic cell, misery perfusion, cerebral metabolism, positron emission tomography
Code: [47] Brain Circulation and Metabolism
Abstract
Background and Purpose: Positron emission tomography (PET) with radiolabeled 2- nitroimidazoles directly detects hypoxic but viable tissue present in an acute ischemic area in the human brain. The present study using PET with 1-(2-18F-fluoro-1- [hydroxymethyl]ethoxy) methyl-2-nitroimidazole (18F-FRP170) aimed to determine whether tissue with an abnormally elevated uptake of 18F-FRP170 exists in human chronic cerebral ischemia due to unilateral atherosclerotic major cerebral artery steno- occlusive disease.
Methods: 18F-FRP170 PET was performed, and cerebral blood flow (CBF) and metabolism were assessed using 15O-gas PET in 20 healthy subjects and 52 patients. A region of interest (ROI) was automatically placed in three segments of the middle cerebral artery territory in both cerebral hemispheres with a three-dimensional stereotaxic ROI template using SPM2, and each PET value was determined in each ROI.
The ratio of values in the affected versus contralateral hemispheres was calculated for the 18F-FRP170 PET image.
Results: A significant correlation was observed between oxygen extraction fraction (OEF) and 18F-FRP170 ratios (ρ=0.509; P<0.0001) in a total of 156 ROIs in 52 patients.
The specificity and positive-predictive value for a combination of an elevated OEF and a moderately reduced cerebral oxygen metabolism for detection of an abnormally elevated 18F-FRP170 ratio (19 ROIs: 12%) were significantly greater than those for the individual categories (elevated OEF, moderately reduced cerebral oxygen metabolism, or reduced CBF).
Conclusions: Tissues with abnormally elevated uptake of 18F-FRP170 exist in human chronic cerebral ischemia characterized by a combination of misery perfusion and
moderately reduced oxygen metabolism due to unilateral atherosclerotic major cerebral artery steno-occlusive disease.
Cerebrovascular autoregulatory mechanisms act via dilation of precapillary resistance vessels to maintain cerebral blood flow (CBF) in the context of reductions in cerebral perfusion pressure.1,2 However, autoregulatory capacity is not sufficient to compensate for severe reductions in cerebral perfusion pressure, thereby leading to a decline in CBF. In this context, referred to as "misery perfusion",3 cerebral oxygen metabolism is dependent on a progressive increase in oxygen extraction fraction (OEF).1,4 When CBF is further reduced beyond compensation of the increase in OEF, cerebral oxygen metabolism begins to decline, leading to the irreversible brain damage that characterizes cerebral infarction.
In acute ischemic stroke, the ischemic penumbra is defined as peri-infarct tissue that is functionally impaired but structurally intact and remains potentially salvageable.5,6 Positron emission tomography (PET) using 15O identifies areas of
“misery perfusion” in a patient with acute ischemic stroke.7,8 18F-fluoromisonidazole (FMISO) is a PET marker of hypoxic but viable tissue that exists in an acute ischemic area in the human brain,9-12 and areas with uptake of the tracer reportedly are metabolically compromised tissue at risk of infarction following acute ischemic stroke.9,10,12 The mechanism of selective retention of 2-nitroimidazoles, including FMISO, in hypoxic tissue is not clearly understood but may involve nitroreductases.
Nitroimidazole molecules enter cells by passive diffusion and undergo nitroreduction to products that are covalently bound to intracellular macromolecules. These products are reoxidized and diffuse out of the cells under normoxic conditions, while remaining trapped by macromolecules within cells under hypoxic conditions.13-15 Therefore, PET with radiolabeled 2-nitroimidazoles may allow detection of hypoxic tissue,16 although the products of the tracer also remain trapped when cells are no longer hypoxic after
recovery of perfusion.17
In chronic cerebral ischemia due to severe stenosis of the cervical internal carotid artery (ICA), preoperatively impaired cognitive function occasionally improves after carotid endarterecomy;18 the reversible cognitive impairment is related to a state of reduction in metabolism due to moderate, but potentially reversible, downregulation of cortical neurotransmitter receptors in response to more severe reduction in brain perfusion due to ICA stenosis19 and the cognitive improvement is associated with postoperative normalization of the cerebral metabolism followed by postoperative recovery of cerebral perfusion.19-21 These findings suggest that functionally impaired but structurally intact tissue may exist in areas of chronic cerebral ischemia with a combination of misery perfusion and reduced cerebral metabolism and that such tissue may be viable under hypoxic conditions. To our knowledge, there is only one previous study that has imaged hypoxic tissue in the context of human chronic cerebral ischemia.22
While a high OEF is an indirect marker of hypoxic tissue,23,24 a new radiolabeled 2-nitroimidazole, 1-(2-18F-fluoro-1-[hydroxymethyl]ethoxy) methyl-2-nitroimidazole (18F-FRP170), has been recently developed to directly image hypoxic tissue using clinical PET.13,25-27 PET using 18F-FRP170 clearly detects viable tissues under hypoxic conditions as an accumulation of the tracer in malignant brain tumors.28,29
Therefore, the purpose of the present study, using 15O-gas and 18F-FRP 170 PET, was to demonstrate the presence of tissue with abnormally elevated uptake of 18F- FRP170 in the context of human chronic cerebral ischemia due to unilateral atherosclerotic major cerebral artery steno-occlusive disease.
Subjects and Methods Healthy subjects
This study evaluated 20 healthy male subjects aged 30 to 67 years (mean, 55 years) who underwent screening based on past history, physical examination, and neurological and cognitive testing. The subjects had no past history of hypertension, diabetes mellitus, atrial fibrillation, or pulmonary disease, and magnetic resonance (MR) imaging did not reveal any organic lesions, leukoaraiosis or asymptomatic lacunar infarction.
Patients
This study also included 52 patients (18 women and 34 men) aged 42 to 82 years (mean, 62 years) with unilateral middle cerebral artery (MCA) or ICA steno-occlusive diseases. All patients had experienced prior cerebral ischemic events. Conventional MR imaging was performed in all patients, and no infarct in the basal ganglia, internal capsula or cerebral cortex was observed in any of the patients; 40 patients exhibited the rosary-like infarcts located at the corona radiate and/or the subcortical white matter in the centrum semiovale and/or the anterior and/or posterior watershed zone, which were defined as subcortical border zone infarction; and the remaining 12 did not have any infarction. Twenty-seven patients had transient ischemic attacks with (15 patients) or without (12 patients) definite subcortical border zone infarction on MR imaging. The remaining 25 patients had minor complete strokes with definite subcortical border zone infarction on MR imaging. Cerebral angiography with arterial catheterization or MR angiography demonstrated ICA stenosis (greater than 70%) in 8 patients, ICA occlusion
in 27 patients, MCA stenosis (greater than 50%) in 10 patients, and MCA occlusion in 7 patients. No patient had occlusion or stenosis of greater than 50% in the contralateral ICA or MCA.
The study protocol was approved by the local ethics committee, and all subjects gave written informed consent before the study.
Positron Emission Tomography
PET studies were performed using a SET-3000GCT/M scanner (PET/CT;
Shimadzu Corp.).30 This modality uses gadolinium silica oxide detectors and provides 59 slices with 2.6 mm slice thickness. The axial field of view was 156 mm, and the spatial resolution was 3.5 mm FWHM at 1 cm in-plane and 4.2 mm FWHM at center axially. The scanner was operated in static scan mode with dual-energy window acquisition for scatter correction. The coincidence time window was set to 10 ns. A shield module consisting of 7 mm thick lead plates attached to the gantry bed and covering the breast and shoulder of the subject was used to reduce the counting rate of random coincidence and scatter coincidence attributable to radioactivity outside the field of view.
Before the emission scans, a transmission scan (3 min) with a 137Cs point source was performed with a bismuth germanate transmission detector ring coaxially attached to the gadolinium silica oxide emission detector ring. CBF was determined while the subject continuously inhaled C15O2 through a mask. Measurements of CMRO2 and OEF were obtained during continuous inhalation of 15O2. Data were collected for 5 min. A single breath of C15O was used to measure cerebral blood volume. CBF, CMRO2 and OEF were calculated using the steady state method,31 and CMRO2 and OEF were
corrected by cerebral blood volume.32
The 18F-FRP170 was synthesized using on-column alkaline hydrolysis according to previously described methods.27 The final formulation for injection was prepared in normal saline containing 2.5 % v/v ethanol using solid-phase extraction techniques. At 60 min after intravenous injection of approximately 370 MBq of 18F-FRP170, data were collected for 10 min.29
Patients underwent PET studies more than two months after the last ischemic event, and the interval between 15O-gas PET and 18F-FRP170 PET ranged from one to four days.
Data Analysis
All PET images were transformed into the standard brain size and shape by linear and nonlinear transformation using SPM2 for anatomic standardization.33 Thus, brain images from all subjects had the same anatomic format. Three hundred and eighteen constant regions of interest (ROIs) were automatically positioned in both cerebral hemispheres using a three-dimensional stereotaxic ROI template (3DSRT) with SPM2 (FUJIFILM RI Pharma Co., Ltd., Tokyo, Japan).34 The ROIs were grouped into ten segments (callosomarginal, pericallosal, precentral, central, parietal, angular, temporal, posterior, hippocampus, and cerebellar) in each hemisphere according to the arterial supply. Of these ten segments, the precentral and central segments were combined and defined as an ROI of the frontal cortex perfused by the MCA (ROIf-MCA); the parietal and angular segments were combined and defined as an ROI of the parietal cortex perfused by the MCA (ROIp-MCA); the temporal segment was defined as an ROI of the temporal cortex perfused by the MCA (ROIt-MCA) (Figure I in the online-only Data
Supplement). CBF, CMRO2 and OEF on 15O-gas PET images were measured in the ROIsf-MCA, ROIsp-MCA and ROIst-MCA in the cerebral hemisphere ipsilateral to the lesion.
Radioactive counts on 18F-FRP170 PET images were measured in the bilateral ROIsf- MCA, ROIsp-MCA and ROIst-MCA; the ratio of the value in the affected cerebral hemisphere to that in the contralateral cerebral hemisphere was then calculated for each ROI in 18F- FRP170 PET images.
Healthy subjects were assigned to one of two groups, each consisting of 10 subjects who underwent 15O-gas PET or 18F-FRP170 PET assessments. In the former group, CBF, CMRO2, and OEF were measured in the bilateral hemispheric ROIs. In the latter group, the 18F-FRP170 ratio was calculated when the left cerebral hemisphere was defined as the affected side; mean and standard deviation (SD) of the 18F-FRP170 ratio was then calculated in each ROI (ROIsf-MCA, ROIsp-MCA or ROIst-MCA). Of these three MCA ROIs, the highest value of the mean+2 SDsof 18F-FRP170 ratio was determined.
Any patient with an MCA ROI with 18F-FRP170 ratio greater than the highest value was defined as having an abnormally elevated 18F-FRP170ratio.
In addition, mean data in the whole MCA territory (ROIswhole-MCA = mean value of [ROIsf-MCA + ROIsp-MCA + ROIst-MCA]) in healthy subjects and patients were calculated and analyzed in the same manner as that for each MCA ROI (ROIsf-MCA, ROIsp-MCA or ROIst-MCA).
Statistical Analysis
Data are expressed as the mean ± SD. Differences in various parameters between the controls and patients were evaluated using the Mann-Whitney U test. Correlations between various parameters were determined using the Spearman’s rank correlation
coefficient. Statistical significance was set at the P<0.05 level. To verify an assumption that the 18F-FRP170 ratio is abnormally elevated when the CBF or CMRO2 is reduced or the OEF is elevated and to investigate which of these three parameters or which combination is more strongly associated with an abnormally elevated 18F-FRP170 ratio, the accuracy of using CBF, CMRO2 or OEF to detect an abnormally elevated 18F- FRP170 ratio was determined using a receiver operating characteristic (ROC) curve.
When a CBF or CMRO2 in an MCA ROI in a patient was less than the cut-off point lying closest to the left upper corner of the ROC curve for detection of an abnormally elevated 18F-FRP170 ratio, the ROI was categorized as having a reduced CBF or CMRO2, respectively; when a OEF in an MCA ROI in a patient was greater than the cut-off point lying closest to the left upper corner of the ROC curve for detection of an abnormally elevated 18F-FRP170 ratio, the ROI was categorized as having an elevated OEF. Exact 95% confidence intervals (CIs) of sensitivity, specificity, positive- and negative-predictive values were computed using the binomial distributions. The differences in sensitivity, specificity, positive- or negative-predictive values between the categories of reduced or elevated PET value were analyzed using the 95% CIs.
Results
Mean, SD and range of 18F-FRP170 ratio, CBF, CMRO2, and OEF in ROIsf-MCA, ROIsp-MCA and ROIst-MCA in 10 healthy subjects and 52 patients are shown in Table 1.
18F-FRP170 ratios did not differ between healthy subjects and patients in all three MCA ROIs. CBF and CMRO2 were significantly lower in patients than in healthy subjects in all three MCA ROIs, while OEF was significantly greater in patients than in healthy
subjects in ROIsf-MCA and ROIst-MCA; in ROIsp-MCA, OEF did not differ between healthy subjects and patients. The mean+2 SDsof 18F-FRP170 ratio obtained in healthy subjects was 1.094 for ROIsf-MCA and ROIsp-MCA; 1.092 for ROIst-MCA. Thus, when 18F-FRP170 ratio in each MCA ROI in each patient was >1.094, the ROI was defined as having an abnormally elevated 18F-FRP170ratio. As a result, of the 156 ROIs in 52 patients, 19 (12%) were classified as having abnormally elevated 18F-FRP170 ratio.
Figure 1 compares the 18F-FRP170 ratio and CBF in each ROI from the patients, with no significant correlation identified between the two parameters. The sensitivity, specificity, positive- and negative-predictive values for CBF at the cut-off point lying closest to the left upper corner of the ROC curve for detection of an abnormally elevated 18F-FRP170 ratio are shown in Figure II in the online-only Data Supplement and Table 2. The cut-off point was 35.9 ml/100 g/min (Figure 1) and an ROI with CBF less than this value was categorized as having a reduced CBF. The value represents mean – 1.5 SD (for ROIsf-MCA and ROIsp-MCA) or mean – 1.8 SD (for ROIst-MCA) of the control value obtained from healthy subjects. The lowest CBF of ROIs with an abnormally elevated 18F-FRP170 ratio was 23.7 ml/100 g/min.
Figure 2 compares 18F-FRP170 ratio and CMRO2 in each ROI from the patients.
Again, no significant correlation was identified between the two parameters. The sensitivity, specificity, positive- and negative-predictive values for CMRO2 at the cut- off point lying closest to the left upper corner of the ROC curve for detecting an abnormally elevated 18F-FRP170 ratio are shown in Figure II in the online-only Data Supplement and Table 2. The cut-off point was 3.31 ml/100 g/min (Figure 2) and an ROI with CMRO2 less than this value was categorized as having a reduced CMRO2. The value represents mean – 0.4 SD (for ROIsf-MCA) or mean – 0.6 SD (for ROIsp-MCA
and ROIst-MCA) of control. Further, when the cut-off point was moved in decrements from 3.31 ml/100 g/min of CMRO2, the sensitivity and positive-predictive values became 0% at a cut-off point of 2.51 ml/100 g/min (Figure 2), which represents mean – 2.4 SD (for ROIsf-MCA and ROIst-MCA) or mean – 2.0 SD (for ROIsp-MCA) of control.
When CMRO2 less than 2.51 ml/100 g/min or between 3.31 ml/100 g/min and 2.51 ml/100 g/min was categorized as severely or moderately reduced, respectively, the specificity for a moderately reduced CMRO2 for detection of an abnormally elevated
18F-FRP170 ratio was significantly greater than that for a reduced CMRO2 (Table 2).
Figure 3 compares the 18F-FRP170 ratio and OEF in each ROI from the patients.
The correlation between the two was significant (P<0.0001), with a correlation coefficient of 0.509. The sensitivity, specificity, positive- and negative-predictive values for OEF in the cut-off point lying closest to the left upper corner of the ROC curve for detecting an abnormally elevated 18F-FRP170 ratio are shown in Figure II in the online-only Data Supplement and Table 2. The cut-off point was 46.3% (Figure 3) and an ROI with OEF greater than this value was categorized as having an elevated OEF. The value represents mean + 1.6 SD (for ROIsf-MCA) or mean + 1.3 SD (for ROIsp- MCA and ROIst-MCA) of control. Further, the specificity and positive-predictive value for a combination of an elevated OEF and a moderately reduced CMRO2 for detection of an abnormally elevated 18F-FRP170 ratio were significantly greater than those for the individual categories (elevated OEF, moderately reduced CMRO2, or reduced CBF);
significant differences in the sensitivity and negative-predictive value were not observed among the combined category and the individual categories (Figure 3, Table 2).
Mean data in the ROIswhole-MCA in healthy subjects and patients and analysis
in the same manner as that for each MCA ROI are presented in Tables I and II, Figures III, IV and V in the online-only Data Supplement.
Representative PET images in one patient with an abnormally elevated 18F- FRP170 ratio are shown in Figures 4.
Discussion
The present study used 15O-gas and 18F-FRP 170 PET to demonstrate that tissues with abnormally elevated uptake of 18F-FRP170, a direct marker of hypoxic but viable tissue, are present in human chronic cerebral ischemia with a combination of misery perfusion and moderately reduced oxygen metabolism due to unilateral atherosclerotic major cerebral artery steno-occlusive disease.
The rosary-like infarcts located at the subcortical white matter in the centrum semiovale or the anterior or posterior watershed zone are associated with hemodynamic impairment in ICA occlusive diseases.35 The same pattern infarcts located at the corona radiate appears to be related to hemodynamic impairment in MCA occlusive diseases.36 These infarcts were defined as subcortical border zone infarction and the present study tried to enroll patients with such infarcts to investigate relationship between misery perfusion and 18F-FRP 170 PET findings.
PET with 18F-FMISO has been commonly used to detect hypoxic tissue.37-39 However, 18F-FMISO has various limitations, such as slow accumulation in hypoxic tissues, low target-to-background contrast, and significant amounts of radioactive metabolic products.28,40 The 18F-FMISO agent is relatively lipophilic, whereas high hydrophilicity is associated with rapid blood clearance and high target-to-background
ratios.28 In contrast, the 18F-FRP 170 used in the present study has high image contrast, fast clearance28, and readily crosses the blood-brain barrier;25 therefore, it is more suitable for visualizing hypoxic brain tissue than 18F-FMISO.28 Interestingly, a study using intratumoral oxygen pressure measurements with microelectrodes during resection of malignant glioma has directly demonstrated that an accumulation on 18F- FRP 170 PET represents viable tissue under the hypoxic condition.29
While hypoxic tissue exhibiting increased uptake of 18F-FMISO may be doomed to die in acute stroke, a recent study using diffusion/perfusion MR or CT perfusion imaging and 18F-FMISO in acute ischemic stroke demonstrated that 18F-FMISO trapping overlapped the ischemic core presented as high intensity on diffusion MR as well as the ischemic penumbra.41 PET studies using 15O in acute stroke also often show a high OEF in the ischemic core as well as the ischemic penumbra, suggesting that the ischemic core under such conditions may remain viable at the time when PET is performed, although it is likely to die soon after that.23,24 Thus, cerebral tissue with increased uptake of 18F-FMISO in acute ischemia may represent a situation where increased OEF is combined with reduced CMRO2, which corresponded with our results using 15O-gas and 18F-FRP 170 PET in chronic ischemia.
In the present study, while a positive correlation was observed between the OEF and 18F-FRP170 ratios, the area with an elevated OEF did not exhibit an elevated 18F- FRP170 ratio when the area had a normal CMRO2. Several investigators showed that the degree of 18F-FMISO uptake is often greater in the ischemic core than in the ischemic penumbra in acute ischemia.41 Oxygen metabolism is theoretically reduced to a greater degree in the core versus penumbra. Thus, reduced CMRO2 in addition to increased OEF may be an essential characteristic of hypoxic tissue in cerebral ischemia.
In contrast, areas with severely reduced CMRO2 did not exhibit elevated 18F-FRP170 ratios, suggesting that the cerebral tissue in these areas might be non-viable.
Kuroda et al.42 suggested that reduced CBF in the normal-appearing cerebral cortex includes two pathophysiologically different conditions: misery perfusion due to hemodynamic compromise; and matched hypometabolism due to border zone infarction.
18F-FRP170 ratio may be elevated in the former condition. In contrast, for the latter condition, border zone infarction may cause selective neuronal damage in the normal- appearing cerebral cortex beyond the regions of infarcts, resulting in reduced metabolism in the cerebral cortex.43 In addition, metabolism in the cerebral cortex with border zone infarction may be reduced due to diaschisis from the infarction.43 Under such conditions, CBF was reduced with reduction in cerebral metabolism, resulting in non-elevated OEF and non-elevated 18F-FRP170 ratio. This may be a reason why the majority of areas with an abnormally elevated 18F-FRP170 ratio exhibited reduced CBF, although no correlation between CBF and 18F-FRP170 ratios was observed. In addition, the lowest CBF of ROIs with an abnormally elevated 18F-FRP170 ratio was 23.7 ml/100 g/min. CBF in the ischemic penumbra is reported to be < 20 ml/100 g/min.23 Our data suggested that non-infarcted tissue under hypoxic conditions may exist in the chronic ischemic regions with CBF values above the penumbra threshold.
Hypoxic tissue presenting as increased uptake of 18F-FMISO is metabolically compromised and at risk of infarction following acute ischemic stroke.9,10,12 Our data suggested that cerebral tissue may become hypoxic when oxygen metabolism begins to decline at the end stage of misery perfusion with deterioration of chronic cerebral ischemia due to atherosclerotic major cerebral artery steno-occlusive disease. If this hypothesis is correct, the following research questions are raised. Does hypoxic tissue
presenting as increased uptake of 18F-FRP170 in chronic cerebral ischemia subsequently succumb to irreversible brain damage over time? Does the hypoxic tissue disappear with recovery of CBF and oxygen metabolism after arterial reconstructive surgery? Is the disappearance of hypoxic tissue associated with improvement of cerebral function including cognition? Further studies aimed at answering these questions would be of benefit.
Conclusions
The present study using 15O-gas and 18F-FRP 170 PET demonstrated that tissue with an abnormally elevated uptake of 18F-FRP170, a direct marker of hypoxic but viable tissue, is present in human chronic cerebral ischemia with a combination of reduced perfusion, moderately reduced oxygen metabolism and misery perfusion due to unilateral atherosclerotic major cerebral artery steno-occlusive disease.
Sources of Funding
This work was partly supported by Grant-in-Aid for Strategic Medical Science Research (S1491001, 2014-2018) from the Ministry of Education, Culture, Sports, Science and Technology of Japan; Grant-in-Aid for Scientific Research (2612345) from Japan Society for the Promotion of Science.
Disclosures
Kuniaki Ogasawara: Consigned research fund (3,500,000 yen) from Nihon Medi- Physics Co., Ltd.
References
1. Gibbs JM, Wise RJ, Leenders KL, Jones T. Evaluation of cerebral perfusion reserve in patients with carotid-artery occlusion. Lancet. 1984;1:310-314.
2. Powers WJ, Raichle ME. Positron emission tomography and its application to the study of cerebrovascular disease in man. Stroke. 1985;16:361-376.
3. Baron JC, Bousser MG, Rey A, Guillard A, Comar D, Castaigne P. Reversal of focal
"misery-perfusion syndrome" by extra-intracranial arterial bypass in hemodynamic cerebral ischemia: a case study with 15O positron emission tomography. Stroke.
1981;12:454-459.
4. Powers WJ. Cerebral hemodynamics in ischemic cerebrovascular disease. Ann Neurol. 1991;29:231-240.
5. Astrup J, Siesjo BK, Symon L. Thresholds in cerebral ischaemia - the ischemic penumbra. Stroke. 1981;12:723–725.
6. Hossmann KA. Viability thresholds and the penumbra of focal ischaemia. Ann Neurol. 1994;36:557–565.
7. Baron JC. Pathophysiology of acute cerebral ischaemia: PET studies in humans.
Cerebrovasc Dis. 1991;1(Suppl 1):22–31.
8. Heiss WD, Herholz K. Assessment of pathophysiology of stroke by positron emission tomography. Eur J Nucl Med. 1994;21:455–465.
9. Read SJ, Hirano T, Abbott DF, Sachinidis JI, Tochon-Danguy HJ, Chan JG, et al.
Identifying hypoxic tissue after acute ischemic stroke using PET and 18F- fluoromisonidazole. Neurology. 1998;51:1617–1621.
10. Read SJ, Hirano T, Abbott DF, Markus R, Sachinidis JI, Tochon-Danguy HJ, et al.
The fate of hypoxic tissue on 18F-fluoromisonidazole positron emission tomography
after ischemic stroke. Neurology. Ann Neurol. 2000;48:228–235.
11. Markus R, Reutens DC, Kazui S, Read S, Wright P, Chambers BR, et al.
Topography and temporal evolution of hypoxic viable tissue identified by 18F- fluoromisonidazole positron emission tomography in humans after ischemic stroke.
Stroke. 2003;34:2646–2652.
12. Markus R, Reutens DC, Kazui S, Read S,Wright P, Pearce DC, et al. Hypoxic tissue in ischaemic stroke: persistence and clinical consequences of spontaneous survival.
Brain. 2004;127:1427–1436.
13. Kaneta T, Takai Y, Kagaya Y, Yamane Y, Wada H, Yuki M, et al. Imaging of ischemic but viable myocardium using a new 18F-labeled 2-nitroimidazole analog, 18F- FRP170. J Nucl Med. 2002;43:109–116.
14. Lee ST, Scott AM. Hypoxia positron emission tomography imaging with 18f- fluoromisonidazole. Semin Nucl Med. 2007;37:451–461.
15. Nunn A, Linder K, Strauss HW. Nitroimidazoles and imaging hypoxia. Eur J Nucl Med. 1995;22:265–280.
16. Chapman JD, Franko AJ, Sharplin J. A marker for hypoxic cells in tumours with potential clinical applicability. Br J Cancer. 1981;43:546–550.
17. Spratt NJ, Ackerman U, Tochon-Danguy HJ, Donnan GA, Howells DW.
Characterization of fluoromisonidazole binding in stroke. Stroke. 2006;37:1862-1867.
18. Yoshida K, Ogasawara K, Kobayashi M, Yoshida K, Kubo Y, Otawara Y, et al.
Improvement and impairment in cognitive function after carotid endarterectomy:
comparison of objective and subjective assessments. Neurol Med Chir (Tokyo).
2012;52:154–160.
Preoperative cerebral blood flow and 123I-iomazenil SPECT imaging predicts postoperative cognitive improvement in patients undergoing uncomplicated endarterectomy for unilateral carotid stenosis. Clin Nucl Med. 2012;37:128-133.
20. Chida K, Ogasawara K, Aso K, Suga Y, Kobayashi M, Yoshida K, et al. Postcarotid endarterectomy improvement in cognition is associated with resolution of crossed cerebellar hypoperfusion and increase in 123I-iomazenil uptake in the cerebral cortex: a SPECT study. Cerebrovasc Dis. 2010;29:343-351.
21. Saito H, Ogasawara K, Nishimoto H, Yoshioka Y, Murakami T, Fujiwara S, et al.
Postoperative changes in cerebral metabolites associated with cognitive improvement and impairment after carotid endarterectomy: a 3T proton MR spectroscopy study.
AJNR Am J Neuroradiol. 2013;34:976-982.
22. Isozaki M, Kiyono Y, Arai Y, Kudo T, Mori T, Maruyama R, et al. Feasibility of 62Cu-ATSM PET for evaluation of brain ischaemia and misery perfusion in patients with cerebrovascular disease. Eur J Nucl Med Mol Imaging. 2011;38:1075-1082.
23. Furlan M, Marchal G, Viader F, Derlon JM, Baron JC. Spontaneous neurological recovery after stroke and the fate of the ischemic penumbra. Ann Neurol. 1996;40:216–
226.
24. Heiss WD, Huber M, Fink GR, Herholz K, Pietrzyk U, Wagner R, et al. Progressive derangement of periinfarct viable tissue in ischemic stroke. J Cereb Blood Flow Metab.
1992;12:193–203.
25. Kaneta T, Takai Y, Iwata R, Hakamatsuka T, Yasuda H, Nakayama K, et al. Initial evaluation of dynamic human imaging using 18F-FRP170 as a new PET tracer for imaging hypoxia. Ann Nucl Med. 2007;21:101–107.
26. Wada H, Iwata R, Ido T, Takai Y. Synthesis of 1-[2-[18F]fluoro-1-(hydroxymethyl)-
ethoxy]methyl-2-nitromidazole ([18F] FENI), a potential agent for imaging hypoxic tissues by PET. J Label Comp Radiopharmaceuticals. 2000;43:785–793.
27. Ishikawa Y, Iwata R, Furumoto S, Takai Y. Automated preparation of hypoxic cell marker [18F]FRP-170 by on-column hydrolysis. Appl Radiat Isot. 2005;62:705–710.
28. Shibahara I, Kumabe T, Kanamori M, Saito R, Sonoda Y, Watanabe M, et al.
Imaging of hypoxic lesions in patients with gliomas by using positron emission tomography with 1-(2-[18F] fluoro-1-[hydroxymethyl]ethoxy)methyl-2-nitroimidazole, a new 18F-labeled 2-nitroimidazole analog. J Neurosurg. 2010;113:358–368.
29. Beppu T, Terasaki K, Sasaki T, Fujiwara S, Matsuura H, Ogasawara K, et al.
Standardized uptake value in high uptake area on positron emission tomography with
18F-FRP170 as a hypoxic cell tracer correlates with intratumoral oxygen pressure in glioblastoma. Mol Imaging Biol. 2014;16:127-135.
30. Ibaraki M, Miura S, Shimosegawa E, Sugawara S, Mizuta T, Ishikawa A, et al.
Quantification of cerebral blood flow and oxygen metabolism with 3-dimensional PET and 15O: validation by comparison with 2-dimensional PET. J Nucl Med. 2008;49:50-59.
31. Frackowiak RS, Lenzi GL, Jones T, Heather JD. Quantitative measurement of regional cerebral blood flow and oxygen metabolism in man using 15O and positron emission tomography: theory, procedure, and normal values. J Comput Assist Tomogr.
1980;4:727-736.
32. Lammertsma AA, Jones T. Correction for the presence of intravascular oxygen-15 in the steady-state technique for measuring regional oxygen extraction ratio in the brain:
1. Description of the method. J Cereb Blood Flow Metab. 1983;3:416-424.
33. Nishimiya M, Matsuda H, Imabayashi E, Kuji I, Sato N. Comparison of SPM and NEUROSTAT in voxelwise statistical analysis of brain SPECT and MRI at the early
stage of Alzheimer's disease. Ann Nucl Med. 2008;22: 921-927.
34. Takeuchi R, Matsuda H, Yoshioka K, Yonekura Y. Cerebral blood flow SPET in transient global amnesia with automated ROI analysis by 3DSRT. Eur J Nucl Med Mol Imaging. 2004;31:578-589.
35. Momjian-Mayor I, Baron JC. The pathophysiology of watershed infarction in internal carotid artery disease: review of cerebral perfusion studies. Stroke.
2005;36:567-577.
36. Derdeyn CP, Khosla A, Videen TO, Fritsch SM, Carpenter DL. Grubb RL Jr, et al.
Severe hemodynamic impairment and border zone region infarction. Radiology.
2001;220:195-201.
37. Cher LM, Murone C, Lawrentschuk N, Ramdave S, Papenfuss A, Hannah A, et al.
Correlation of hypoxic cell fraction and angiogenesis with glucose metabolic rate in gliomas using 18Ffluoromisonidazole, 18F-FDG PET, and immunohistochemical studies.
J Nucl Med. 2006;47:410–418.
38. Spence AM, Muzi M, Swanson KR, O'Sullivan F, Rockhill JK, Rajendran JG, et al.
Regional hypoxia in glioblastoma multiforme quantified with [18F]fluoromisonidazole positron emission tomography before radiotherapy: correlation with time to progression and survival. Clin Cancer Res. 2008;14:2623–2630.
39. Tochon-Danguy HJ, Sachinidis JI, Chan F, Chan JG, Hall C, Cher L, et al. Imaging and quantitation of the hypoxic cell fraction of viable tumor in an animal model of intracerebral high grade glioma using [18F]fluoromisonidazole (FMISO). Nucl Med Biol.
2002;29:191–197.
40. Martin GV, Caldwell JH, Graham MM, Grierson JR, Kroll K, Cowan MJ, et al.
Noninvasive detection of hypoxic myocardium using fluorine-18-fluoromisonidazole
and positron emission tomography. J Nucl Med. 1992;33:2202–2208.
41. Alawneh JA, Moustafa RR, Marrapu ST, Jensen-Kondering U, Morris RS, Jones PS, et al. Diffusion and perfusion correlates of the 18F-MISO PET lesion in acute stroke:
pilot study. Eur J Nucl Med Mol Imaging. 2014;41:736–744.
42. Kuroda S, Shiga T, Houkin K, Ishikawa T, Katoh C, Tamaki N, et al. Cerebral oxygen metabolism and neuronal integrity in patients with impaired vasoreactivity attributable to occlusive carotid artery disease. Stroke. 2006;37:393-398.
43. Yamauchi H, Nishi R, Higashi T, Kagawa S, Fukuyama H. Silent cortical neuronal damage in atherosclerotic disease of the major cerebral arteries. J Cereb Blood Flow Metab. 2011;31:953-961
Figure Legends
Fig. 1
Correlation between cerebral blood flow (CBF) and 1-(2-18F-fluoro-1- [hydroxymethyl]ethoxy) methyl-2-nitroimidazole (18F-FRP170) ratio in patients. The dashed horizontal line denotes mean + 2 standard deviations (SD) of 18F-FRP170 ratios obtained in healthy subjects. The dashed vertical line denotes 35.9 ml/100 g/min, which represents mean – 1.5 SD (for region-of-interest of the frontal cortex perfused by the middle cerebral artery [ROIf-MCA] and region-of-interest of the parietal cortex perfused by the middle cerebral artery [ROIsp-MCA]) or mean – 1.8 SD (for region-of-interest of the temporal cortex perfused by the middle cerebral artery [ROIst-MCA]) of CBF obtained in healthy subjects.
Fig. 2
Correlation between cerebral metabolic rate of oxygen (CMRO2) and 18F-FRP170 ratio in patients. The dashed horizontal line denotes mean + 2 SD of 18F-FRP170 ratios obtained in healthy subjects. The right and left dashed vertical lines denote 3.31 ml/100 g/min and 2.51 ml/100 g/min, respectively. The former represents mean – 0.4 SD (for ROIsf-MCA) or mean – 0.6 SD (for ROIsp-MCA and ROIst-MCA) of CMRO2 obtained in healthy subjects; the latter represents mean – 2.4 SD (for ROIsf- MCA and ROIst-MCA) or mean – 2.0 SD (for ROIsp-MCA) of CMRO2 obtained in healthy subjects.
Fig. 3
Correlation between oxygen extraction fraction (OEF) and 18F-FRP170 ratio in
patients. The dashed horizontal line denotes mean + 2 SD of 18F-FRP170 ratios obtained in healthy subjects. The dashed vertical line denotes 46.3%, which represents mean + 1.6 SD (for ROIsf-MCA) or mean + 1.3 SD (for ROIsp-MCA and ROIst-MCA) of OEF obtained in healthy subjects. Open, half-tone and closed circles denote CMRO2 > 3.31 ml/100 g/min, between 3.31 ml/100 g/min and 2.51 ml/100 g/min, < 2.51 ml/100 g/min, respectively.
Fig. 4
Positron emission tomography (PET) images from a 63-year-old woman with symptomatic right middle cerebral artery occlusion. CBF is severely reduced, CMRO2 is moderately reduced, and OEF is elevated in the right temporal cortex when compared with the left cerebral hemisphere. That region exhibits relatively high accumulation of 18F-FRP170.
Table 1. PET values obtained from healthy subjects and patients in ROIsf-MCA, ROIsp-MCA and ROIst-MCA
Healthy subjects (N = 10* or 20†) Patients (N = 52‡) P value
ROIsf-MCA
18F-FRP170 ratio Mean 1.000 1.013 SD 0.047 0.058 Range 0.925-1.055 0.893-1.180
N.S.
CBF (ml/100 g/min) Mean 46.8 38.6 SD 7.2 7.6 Range 34.7-57.4 23.7-50.2
0.0032 CMRO2 (ml/100 g/min) Mean 3.44 3.07
SD 0.38 0.57
Range 2.78-3.83 1.76-3.85
0.0477 OEF (%) Mean 37.9 42.0
SD 5.4 5.3 Range 31.8-46.2 35.7-60.6
0.0336 ROIsp-MCA
18F-FRP170 ratio Mean 1.000 1.017 SD 0.047 0.063 Range 0.935-1.057 0.845-1.182
N.S.
CBF (ml/100 g/min) Mean 47.7 38.2 SD 7.7 7.5 Range 35.0-56.8 23.7-50.0
0.0013
CMRO2 (ml/100 g/min) Mean 3.65 3.13 SD 0.56 0.48 Range 2.99-4.41 1.99-3.87
0.0176 OEF (%) Mean 40.8 42.6
SD 4.4 5.3 Range 35.1-48.3 36.9-60.2
N.S.
ROIst-MCA
18F-FRP170 ratio Mean 1.000 1.011 SD 0.046 0.057 Range 0.935-1.076 0.889-1.172
N.S.
CBF (ml/100 g/min) Mean 47.2 39.1 SD 6.3 7.3
Range 36.6-57.4 24.2-50.3
0.0019 CMRO2 (ml/100 g/min) Mean 3.60 3.13
SD 0.45 0.48 Range 3.07-4.34 1.99-3.87
0.0336 OEF (%) Mean 39.5 42.4
SD 5.2 5.4 Range 32.1-45.9 35.7-58.6
0.0493
*, 18F-FRP170 ratio of ROI; †, CBF, CMRO2 and OEF of bilateral hemispheric ROIs; ‡, 18F-FRP170 ratio of ROI and CBF, CMRO2 and OEF of ROI in the hemisphere ipsilateral to lesion.
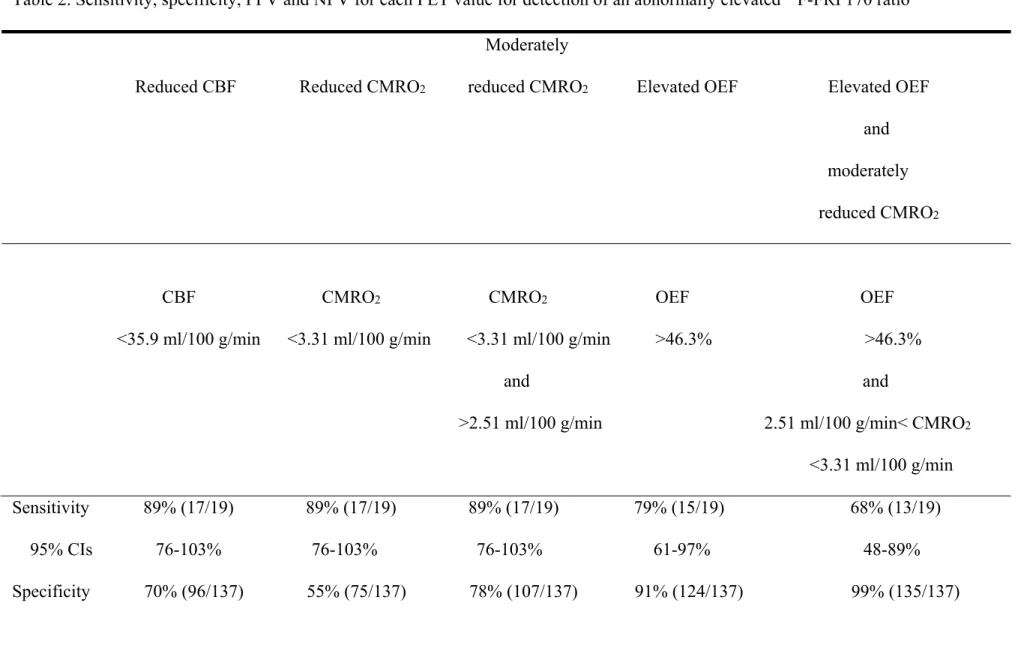
Table 2. Sensitivity, specificity, PPV and NPV for each PET value for detection of an abnormally elevated 18F-FRP170 ratio Moderately
Reduced CBF Reduced CMRO2 reduced CMRO2 Elevated OEF Elevated OEF and moderately reduced CMRO2
CBF CMRO2 CMRO2 OEF OEF <35.9 ml/100 g/min <3.31 ml/100 g/min <3.31 ml/100 g/min >46.3% >46.3%
and and
>2.51 ml/100 g/min 2.51 ml/100 g/min< CMRO2
<3.31 ml/100 g/min Sensitivity 89% (17/19) 89% (17/19) 89% (17/19) 79% (15/19) 68% (13/19)
95% CIs 76-103% 76-103% 76-103% 61-97% 48-89%
Specificity 70% (96/137) 55% (75/137) 78% (107/137) 91% (124/137) 99% (135/137)
95% CIs 62-78% 46-63% 71-85%* 86-95% 97-101%† PPV 29% (17/58) 22% (17/79) 36% (17/47) 54% (15/28) 87% (13/15)
95% CIs 18-41% 12-31% 22-50% 35-71% 72-104%† NPV 98% (96/98) 97% (75/77) 98% (107/109) 97% (124/128) 96% (135/141)
95% CIs 95-101% 94-101% 96-101% 94-100% 92-99%
PPV, positive-predictive value; NPV, negative-predictive value; *, significantly greater than reduced CMRO2; †, significantly greater than reduced CBF, moderately reduced CMRO2, or elevated OEF.