スキージャンプ踏み切り局面が初期飛行局面に及ぼす影響 : バイオメカニクス的観点から
218
0
0
全文
(2) 目次 1 序論 ...................................................................................................................................................................................................1 1.1 先行研究の検討..............................................................................................................................................................3 1.1.1 踏み切り動作に伴う力学量が飛距離に及ぼす影響........................................................................4 1.1.2 踏み切り動作の多様性について...........................................................................................................6 1.1.3 飛行姿勢の研究について........................................................................................................................7 1.2 研究の目的および課題...............................................................................................................................................13. 2 踏み切り局面における力学的諸変量が飛距離に及ぼす影響(実験1)....................................................................15 2.1 目的..................................................................................................................................................................................15 2.2 方法..................................................................................................................................................................................15 2.2.1 床反力計....................................................................................................................................................15 2.2.2 被検者........................................................................................................................................................16 2.2.3 測定手順....................................................................................................................................................18 2.2.4 床反力の解析...........................................................................................................................................21 2.2.5 統計処理....................................................................................................................................................21 2.3 結果..................................................................................................................................................................................22 2.3.1 力学的諸変量と飛距離との相関関係................................................................................................22 2.3.2 上位群と下位群の比較..........................................................................................................................26 2.3.3 上位選手間の比較...................................................................................................................................28 2.4 考察..................................................................................................................................................................................32 2.4.1 助走速度と総質量について.................................................................................................................32 2.4.2 発揮された力学的諸変量と飛距離との関係...................................................................................33 2.4.3 上位選手間の比較...................................................................................................................................34 2.5 小括..................................................................................................................................................................................36. 3 一流ジャンプ選手における床反力発揮の特徴(実験2)..............................................................................................37 3.1 目的..................................................................................................................................................................................37 3.2 方法..................................................................................................................................................................................37 3.2.1 被検者........................................................................................................................................................37 3.2.2 測定手順....................................................................................................................................................39 3.2.3 データ処理................................................................................................................................................40 3.2.4 統計処理....................................................................................................................................................43. i.
(3) 3.3 結果..................................................................................................................................................................................44 3.3.1 床反力波形の再現性..............................................................................................................................44 3.3.2 床反力発揮様式.......................................................................................................................................46 3.3.3 床反力発揮様式と最大上昇速度との関係........................................................................................46 3.3.4 床反力発揮様式と身体重心変位との関係........................................................................................49 3.3.5 床反力発揮様式が異なる選手の比較................................................................................................52 3.3.6 床反力発揮様式と踏み切り姿勢との関係........................................................................................54 3.4 考察..................................................................................................................................................................................57 3.4.1 床反力波形パターンの再現性.............................................................................................................57 3.4.2 床反力発揮様式.......................................................................................................................................58 3.4.3 床反力発揮様式と力学的諸変量との関係........................................................................................58 3.4.4 床反力発揮様式と踏み切り姿勢との関係........................................................................................61 3.5 小括..................................................................................................................................................................................62. 4 踏み切り時の股関節角度の大きさが初期飛行局面に及ぼす影響(実験3)............................................................64 4.1 目的..................................................................................................................................................................................64 4.2 方法..................................................................................................................................................................................64 4.2.1 被検者........................................................................................................................................................64 4.2.2 測定手順....................................................................................................................................................65 4.2.3 映像の解析................................................................................................................................................65 4.2.4 統計処理....................................................................................................................................................68 4.3 結果..................................................................................................................................................................................70 4.3.1 踏み切り時の股関節角度の大きさが初期飛行局面の姿勢制御に及ぼす影響.......................70 4.3.2 初期飛行局面における姿勢制御の違いが飛行速度および経路に及ぼす影響.......................80 4.4 考察..................................................................................................................................................................................84 4.4.1 初期飛行局面における姿勢制御と空気力との関係......................................................................84 4.4.2 初期飛行局面における姿勢制御の違いが飛行速度および経路に及ぼす影響.......................93 4.4.3 初期飛行局面における姿勢制御の違いが前傾姿勢に及ぼす影響............................................96 4.5 小括............................................................................................................................................................................... 104. 5 初期飛行姿勢を対象とした風洞実験および飛行シミュレーション(実験4).................................................... 106 5.1 目的............................................................................................................................................................................... 106 5.2 方法............................................................................................................................................................................... 107 5.2.1 実寸大の人形模型を用いた風洞実験による空気力の測定...................................................... 107 5.2.2 飛行姿勢を独立変数とした空気力係数の回帰モデル............................................................... 113. ii.
(4) 5.2.3 スキージャンプ飛行中の股関節角度制御に着目した飛行シミュレーション.................... 114 5.3 結果............................................................................................................................................................................... 123 5.3.1 初期飛行局面における空気力係数 ................................................................................................. 123 5.3.2 空気力係数の回帰モデル................................................................................................................... 129 5.3.3 初期飛行局面の飛行シミュレーション......................................................................................... 137 5.4 考察............................................................................................................................................................................... 150 5.4.1 初期飛行局面における空気力係数 ................................................................................................. 150 5.4.2 空気力係数の回帰モデルについて ................................................................................................. 153 5.4.3 股関節角度制御の違いが初期飛行局面に及ぼす影響............................................................... 154 5.5 小括............................................................................................................................................................................... 166. 6 総括 .............................................................................................................................................................................................. 170 6.1 結論............................................................................................................................................................................... 170 6.2 今後の研究課題......................................................................................................................................................... 173. 謝辞....................................................................................................................................................................................................... 174. 付録....................................................................................................................................................................................................... 175 A. 1 風洞実験データを用いた補間データの作成方法................................................................................................. 175 A. 2 飛行姿勢による空気力係数の回帰モデル(多次元多項式)の係数表.......................................................... 179 A. 2. 1 揚力面積(SL)回帰モデルの係数表................................................................................................... 179 A. 2. 2 抗力面積(SD)回帰モデルの係数表................................................................................................... 186 A. 2. 3 ピッチングモーメント容積(QM)回帰モデルの係数表............................................................... 193. 文献....................................................................................................................................................................................................... 200. iii.
(5) 図のタイトル一覧 Figure 1. Schematic diagram of the force measurement system installed in the take-off platform (Normal hill: K=90, Hakuba jumping stadium).. Figure 2. p.17. Schematic diagram of experimental setup for the experiment. In this diagram, the force measurement system and the camera setting are depicted. The high speed camera was used in experiment. In video analysis, two joint angles (Knee and Hip) during take-off were calculated.. Figure 3. p.19. The force curve and photocell signal. Fzpeak refers to maximal forces and F'6-0m refers to averaged force levels and I6-0m refers to impulse of the force. Photocell signal was recorded to identify the position of a ski jumper running on the take-off platform. These variables were given by using photocell signals for 6m distance before take-off edge.. p.20. Figure 4. Flight distance and averaged force level (F'6-0m) for the first round (a) and the second round (b).. p.24. Figure 5. Flight distance and peak force value (Fzpeak ) for the first round (a) and the second round (b).. p.25. Figure 6. Flight distance and impulse of the force (I6-0m) for the first round (a) and the second round (b).. p.26. Figure 7. The difference of the force production between M.H. (solid line) and M.S. (dotted line). Figure 7a : M.H. was the first place (98.0m) and M.S. was the second place (92.0m) for the first round. Figure 7b : M.H. was the first place (98.5m) and M.S. was the second place (94.0m) for the second round.. Figure 8. p.31. Force curve (a, b), the displacement of the center of gravity and photocell signals (c). Measured force (Fa) includes the body weight (Bw) during all the part of the take-off platform and also includes the centrifugal force (Fr) during the 10-6.2m before the take-off edge (a). Then a net force (F) generated by the jumper was calculated by subtracting these forces (b). Fmax1 and Fmax2 is the maximal value of the force. DCGmin and DCG0m refer to the displacement of the center of gravity at the minimal value and at the instant of take-off respectively. T1 refers to the time duration from the point of DCGmin to the edge of the take-off. A starting point of integration is shown as Ts.. Figure 9. p.42. Multiple plots of ground reaction forces (GRF) by three subjects (N.K., K.F., M.H.). GRF is expressed as a relative value for each subject's total body weight. For the take-off time, 0% indicates the instant that GRF increased to the total body weight level, while 100% indicates the instant that GRF decreased to the total body weight level.. p.45. Figure 10. Fmax1 and Fmax2 for twelve subjects.. p.48. Figure 11. Maximal vertical velocity of the center of gravity (Vmax) and quotient of Fmax2 to Fmax1 (F2/F1).. p.48. iv.
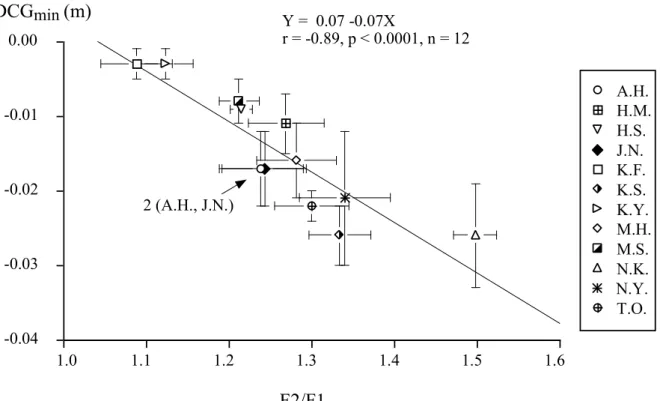
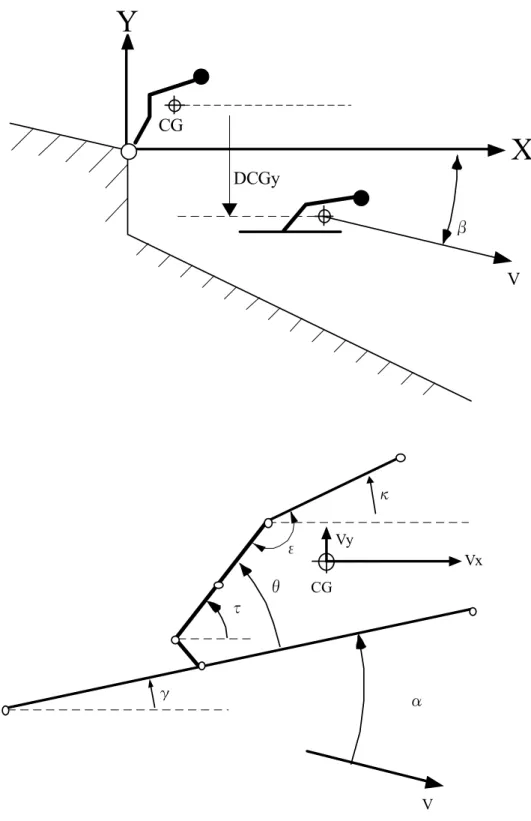
(6) Figure 12. Minimal value of displacement of the center of gravity (DCGmin) and quotient of Fmax2 to Fmax1 (F2/F1).. p.50. Figure 13. Timing of DCGmin (T1) and quotient of Fmax2 to Fmax1 (F2/F1).. p.50. Figure 14. Displacement of the center of gravity at the edge of take-off (DCG0m) and quotient of Fmax2 to Fmax1 (F2/F1). p.51. Figure 15. Ground reaction force (a), velocity (b), displacement (c) of the center of gravity and joint angular displacements of knee and hip (d) of three jumpers, K.F. (solid line), N.K.(broken line) and M.H.(dotted line). The time 0 sec means the point that the jumper passing the photocell arranged at the end of the take-off platform (0m).. Figure 16. Relationship between the joint angles at the take off and quotient of Fmax2 and Fmax1 (F2/F1). Figure (a) refers to the knee joint angle (Knee-0m) and figure (b) refers to the the hip joint angle (Hip-0m).. Figure 17. p.55. p.56. The coordinate system, definition of the angles and velocity during flight. The origin of the X - Y coordinate system is fixed on the edge of a jumping platform. Positions of the jumper and skis are defined as angles (α, β, γ, ε, θ, κ and τ). The velocity of the jumper (V) is divided into horizontal (Vx) and vertical (Vy) components. DCGy means displacement of the center of gravity (CG) of the jumper.. Figure 18. p.69. Changes in hip joint angle (ε), leg-ski angle (θ), attack angle (α) and ski angle (γ) with flight distance. The subjects group with the large hip joint angle at the instant of take-off (Hip_Large) was expressed by the black square marker, while the subjects group with the small hip joint angle (Hip_Small) was expressed by the white square marker.. Figure 19. p.72. Changes in the forward leaning angles (a, c) and their angular velocities (b, d) with flight distance. The leg angle (τ) means the angle between the leg segment and the horizontal line, while the trunk angle (κ) means the angle between the trunk segment and the horizontal line. The angular velocity of the leg angle is shown as τ' and the angular velocity of the trunk angle is shown as κ' respectively. The subjects group with the large hip joint angle at the instant of take-off (Hip_Large) was expressed by the black square marker while the subjects group with the small hip joint angle (Hip_Small) was expressed by the white square marker.. Figure 20. p.75. Relationship between the hip joint angle at the instant of take-off (ε_0m) and the quantitative changes (increase or decrease) in the forward leaning angles during the early flight phase (0m to 5m) in twelve subjects. The quantitative changes in the leg angle ang the trunk angle are shown as (Δτ) and (Δκ) respectively.. Figure 21. p.77. Changes in the posture and the hip joint angle (ε) with flight distance during early flight. Subject M. H. were selected from the same group (Hip_Large). Subject M. H. showed the largest value of the hip joint angle between twelve subjects.. Figure 22. p.79. Horizontal (Vx) and vertical (Vy) velocities of the center of gravity (a, c), and the amount of change (b, d) in these velocities with flight distance. The subjects group with the large hip joint angle at the instant of take-off (Hip_Large) was expressed by the black square marker while the subjects group with the small hip joint angle (Hip_Small) was expressed by the white square marker.. v. p.81.
(7) Figure 23. The direction of the flight path of the center of gravity with flight distance. The subjects group with the large hip joint angle at the instant of take-off (Hip_Large) was expressed by the black square marker while the subjects group with the small hip joint angle (Hip_Small) was expressed by the white square marker.. Figure 24. p.83. Displacement of center of gravity (DCGy) with flight distance. The subjects group with the large hip joint angle at the instant of take-off (Hip_Large) was expressed by the black square marker while the subjects group with the small hip joint angle (Hip_Small) was expressed by the white square marker.. Figure 25. The effect of the attack angle (α), ski to leg angle (θ) and hip joint angle (ε) on the Lift area: SL (a) and the drag area: SD (b). (Figure adapted from (Tani et al. 1951)).. Figure 26. p.83. p.89. The effect of the arm position (φ) on the lift area (SL) with increasing the ski to leg angle (θ) . The markers painted white and black mean the arms raised up forward position (φ=18°) and the arms fitted to the trunk position (φ=165°) respectively. Hip joint angle (ε) was fixed at 140°. Attack angle (α) was varied at (0, 5 and 10°). (Data adapted from (Tani et al. 1971)).. p.90. Figure 27. The plane view of the wind tunnel (The University of Tokyo).. Figure 28. The ski jumper model. Each photo shows the frontal view (a), the side view (b) and the back view (c) of the. p.108. model.. p.108. Figure 29. A set up for the wind tunnel experiment.. p.109. Figure 30. Measured aerodynamic parameters (lift (L), drag (D) and pitching moment (M)), and the body configuration of a ski jumper model and skis in the wind tunnel test.. Figure 31. Histograms of a frequency of each flight position (α,θ,σ,λ and φ) of a ski jumper model in the wind tunnel test and the interpolated data.. Figure 32. p.110. p.112. The coordinate system and definition of the angles and aerodynamics forces. The origin of the X - Y coordinate system is fixed on the edge of a jumping platform. The X axis is parallel to the horizontal line. β means the angle of the velocity vector of center of gravity (C. G.) to the horizontal line. The aerodynamic forces lift, drag and pitching moment are depicted as L, D and M respectively. The gravitational force is depicted as mg. Velocity is depicted as V and divided into two velocity components Vx and Vy.. Figure 33. p.115. Position control of four flight models (Hip_Large, Hip_Small, Subject M. H. and M. H. case study) for computer simulation. These flight models have the same movement pattern in the ski to leg angle (θ), the ski to ski angle (λ) and the attack angle (α) as depicted in figure 33(a). The arm angle (φ) which is not shown here is set as a constant (170°) in each model. Figure 33(b) shows the difference in the hip bending angle (σ) between the models. These markers indicate experimental data, while the lines indicate interpolated data by using cubic spline function. p.121. vi.
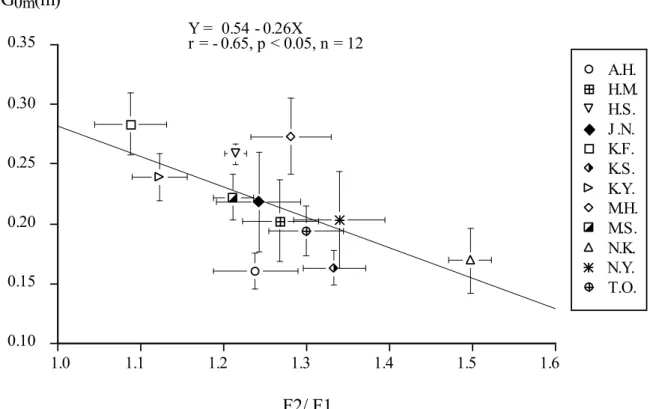
(8) Figure 34. The relationship between the ski to leg angle θ and the lift area SL when the arms fitted to the trunk (arm angle φ = 170°). Each plot show different condition of angle of attack (α:-5~20°). The other positions of the jumper-ski model were set as follows, hip bending angle σ = 40°and ski to ski angle λ = 0°.. Figure 35. p.124. The relationship between the ski to leg angle θ and the aerodynamic forces (drag area SD, lift area SL and pitching moment volume QM). Each plot show different condition of angle of attack (α:-5~20°). The other positions of the jumper-ski model were set as follows, hip bending angle σ = 70°, ski to ski angle λ = 0°and arm angle φ = 170°.. Figure 36. p.126. The relationship between the hip bending angle σ and the aerodynamic forces (drag area SD, lift area SL and pitching moment volume QM). Each plot show different condition of angle of attack (α:-5~20°) . The other positions of the jumper-ski model were set as follows, ski to leg angle θ = 80°, ski to ski angle λ = 0°and arm angle φ= 170°. p.128. Figure 37. An example of the measured and the calculated the aerodynamic coefficients (SL, SD and QM).. p.130. Figure 38. The relationship between the aerodynamic coefficients (SL, SD and QM) which were measured by the wind tunnel experiment (ordinate) and those which were calculated by the regression model (abscissa).. Figure 39. The distribution of the residual of the aerodynamic coefficients (SL, SD and QM) between those which were calculated by the regression model and those which were measured by the wind tunnel experiment.. Figure 40. p.132. p.133. The frequency of the residual of each aerodynamic coefficient (SL, SD and QM). The residual means the difference in the aerodynamic coefficients between the calculated value by the regression models and the measured value by the wind tunnel experiments. A curve line in each diagram shows the normal distribution.. Figure 41. p.134. Flight positions and the aerodynamic coefficients (SD and SL). A comparison between this study (noted “Calculated”) and the precedent study (noted “Schmölzer”) about lift area (b) and drag area (c) respectively. Flight positions (a), lift area (b) and drag area (c) were adapted from Schmölzer et al. (2002).. Figure 42. Calculated aerodynamic coefficients of four flight models (Hip_Large, Hip_Small, Subject M. H. and M. H. Case Study) by using the regression models which were established in this study.. Figure 43. p.143. The vertical velocity of the center of gravity which was calculated by simulation for the four flight models (Hip_Large, Hip_Small, Subject M.H. and M.H. Case Study).. Figure 45. p.140. The horizontal velocity of the center of gravity which was calculated by simulation for the four flight models (Hip_Large, Hip_Small, Subject M.H. and M.H. Case Study).. Figure 44. p.136. p.143. Velocity of the center of gravity during the early flight phase for the flight models (Hip_Large, Hip_Small, Subject M.H. and M.H. Case Study). These diagrams depict horizontal (Vx) and vertical (Vy) component of the velocity at 0.2 (a), 0.6 (b) and 1.0 (c) second after take-off respectively.. vii. p.144.
(9) Figure 46. The velocity of the center of gravity which was calculated by simulation for the four flight models (Hip_Large, Hip_Small, Subject M.H. and M.H. Case Study).. Figure 47. p.145. Stick pictures of the early flight phase of the four flight models (Hip_Large, Hip_Small, Subject M.H. and M.H. Case Study) which were calculated by simulation. The dotted lines mean the flight path of the center of gravity of the four models respectively. The duration of the simulation was 1.0 second. The interval of each picture is 0.1 second.. Figure 48. p.148. Displacement of the center of gravity during the early flight phase for the flight models (Hip_Large, Hip_Small, Subject M.H. and M.H. Case Study). These diagrams depict horizontal (DCGx) and vertical (DCGy) displacement of the center of gravity at 0.2 (a), 0.6 (b) and 1.0 (c) second after take-off respectively.. Figure 49. p.149. The effect of the hip bending angle (σ) on the lift area (SL) between two conditions of the ski to leg angle (θ) (a: θ= 70° and b: θ = 50°) with different conditions of the attack angles (α) (a: -5 ~ 10° and b: -5 ~ 20°). These data were measured by the wind tunnel test. The ski to ski angle (λ) and the arm angle (φ) were fixed at 0° and 170° respectively.. Figure A1. p.158. An example of the interpolation result between the attack angles α in an experimental case. The other positions of the jumper-ski model were fixed as follows, ski to leg angle θ= 70°, hip bending angle σ = 70°ski to ski angle λ = 0°and arm angleφ = 170°. Open circle markers mean the data of the wind tunnel experiment. Painted circle markers mean the calculated values by Piecewise Cubic Hermite interpolation method.. Figure A2. p.176. An example of the interpolation result between two experimental cases which have a difference in ski to ski angle λ. The other positions of the jumper-ski model were fixed as follows, ski to leg angle θ= 80°, hip bending angle σ = 60°and arm angle φ = 170°. Open circle and triangle markers mean the data of the wind tunnel experiment. Lines mean the calculated values by linear interpolation method.. Figure A3. p.177. An example of the interpolation result between four experimental cases which have a difference in hip bending angle σ. The other positions of the jumper-ski model were fixed as follows, ski to leg angle θ= 70°, ski to ski angle λ = 0° and arm angle φ = 170°. Four types of markers mean the data of the wind tunnel experiment. Lines mean the calculated values by Piecewise Cubic Hermite interpolation method.. viii. p.178.
(10) 表のタイトル一覧 Table 1. The selected variables of 50 subjects in the first and the second round.. p.23. Table 2. The selected variables of the two groups in the first round (a) and the second round (b).. p.28. Table 3. The selected variables between two groups in the first round (a) and the second round (b).. p.29. Table 4. Age, body height and body mass of twelve subjects.. p.38. Table 5. Statistics of Fmax1, Fmax2 and a quotient of Fmax2 / Fmax1 (F2/F1).. p.47. Table 6. Anthropometric characteristics of the jumper - ski model which was used in the flight simulation.. Table 7. The initial conditions of simulation for each flight model (Hip_Large, Hip_Small, subject M.H. and Subject M.H. case study).. p.118. p.122. Table A1. Coefficients aijklm of equation ⑦ for SL. pp. 180-185. Table A2. Coefficients bijklm of equation ⑧ for SD. pp. 187-192. Table A3. Coefficients cijklm of equation ⑨ for QM. pp. 194-199. ix.
(11) 1. 序論. スキージャンプは,飛距離から得られた飛距離点と,飛型審判員の採点による飛 型点との合計点を争う競技である。スキージャンプの飛距離は競技が行われるジャ ンプ台の規格によってかなり異なる。ジャンプ台は,国際スキー連盟(International Ski Federation :FIS)の規定で,以下の 5 つの規格に分類されている(International Ski Federation 2008)。 スモールヒル:. W ≦ 44 m. ミディアムヒル:. 45 m ≦ W ≦ 74 m. ノーマルヒル:. 75 m ≦ W ≦ 99 m. ラージヒル:. 100 m ≦ W. フライングヒル: 170 m ≦ W ここで,W はジャンプ台の建築基準点(K 点)までの飛距離を意味する。スキー ジャンプの飛距離は,概ねこの K 点の大きさにしたがって大きくなる。オリンピッ ク冬季競技大会の正式種目となっているノーマルヒルおよびラージヒルにおける飛 距離(優勝記録)は,用具(スキー板,衣服など)や,近年の「V 字姿勢」に代表 される飛行技術の改良によって近年増大傾向にあるが,それぞれ約 100 m および 130 m である(山辺 2006)。一方で,スキージャンプの飛距離と飛型点との間には, 正の相関関係が見られることが知られており(浅見 1993; 渡部ら 1997; Greimel ら 2009),この関係が崩れるのは着地に失敗した場合にほぼ限定される。したがって, スキージャンプの成績は飛距離の大きさによって決まると言ってよい。以下では, スキージャンプの飛距離を最大化するためにどのような要因があるのかを取り上げ る。 スキージャンプの動作をスタートから着地まで概観すると,まず助走路を滑走し. 1.
(12) (助走局面),助走路の終端付近で踏み切り動作を行い(踏み切り局面),その後 空中に飛び出し(飛行局面),着地する(着地局面)という経過を辿る。これらの 局面において,スキージャンプの飛距離に影響を及ぼすと考えられている技術的要 因を以下に挙げてみる。 まず,助走局面においては,低くしゃがみ込んだ姿勢(クラウチング姿勢)を取 ることで空気抵抗をできるだけ小さくし,大きな助走速度を獲得することが重要と なる。選手がジャンプ台の助走路を飛び出す際の速度は非常に大きく,ラージヒル においては 90~95 km/h(25~26.4 m/s)に達する。 次に,踏み切り局面においては,股関節および膝関節の伸展によって,身体重心 に大きな上昇速度を与えることが課題となる。その理由は,踏み切り局面終了時の 上昇速度が大きいほど,身体重心の速度ベクトル(上昇速度ベクトルおよび助走速 度ベクトルの合成速度ベクトル)の角度を上向きにし,その後の飛行局面の飛行軌 跡を高くするためである。この上昇速度は,踏み切り動作による床反力(助走路に 対して垂直方向の力)の積分値,すなわち力積で決定されることを考慮すると,踏 み切り局面において大きな上昇速度を獲得するためには,大きな力積を得ることが 必要であることが分かる。さらに,踏み切り局面では,身体を前傾させた飛行姿勢 に素早く移行するため,身体重心周りに前回り方向の角運動量を与えておく必要が ある。それらに加え,股関節および膝関節の過剰な伸展によって,助走局面で得ら れた速度を減少させないような工夫も必要とされる。 最後に,飛行局面においては,その飛行軌跡が一つの鉛直面上であると仮定する と(飛行軌跡が選手の左右方向にずれないと仮定すると),飛行中の選手に作用す る力は重力と,空気から受ける揚力,抗力およびピッチングモーメントのみである。 これらの空気力の大きさは飛行姿勢によって決定されることを考慮すると,飛距離 を最大化するためには,これらの空気力を最適化すべく姿勢制御を行うことが必要. 2.
(13) であることが分かる。 このように,スキージャンプの飛距離は様々な技術的要因によって決定されてい る。これらの技術的要因の他に,環境的要因も,飛距離に影響を与えることが知ら れている。例を挙げると,高所環境における空気密度の減少は,揚力および抗力な どの空気力を小さくし,助走速度を大きくするものの,最終的な飛距離を小さくす ることがシミュレーションの結果から明らかにされている(Virmavirta ら 2001e; Schmölzer ら 2005; Virmavirta ら 2005)。また,飛行局面における向かい風も飛距 離を増大させることが,シミュレーションの結果から明らかにされている(Müller ら 1996; Schmölzer ら 2002; 瀬尾ら 2002; Seo ら 2004b)。例えば,Schmölzer ら (2002)は,規格の異なるジャンプ台(K = 90 m,120 m および 185 m)を想定した 飛行シミュレーションを行い,3 m/s の向かい風条件は,無風時に比してそれぞれ約 10,16 および 20 m の飛距離の増大をもたらすことを示している。 本研究は,スキージャンプの踏み切り局面に着目し,バイオメカニクス的側面か ら検討を行う。すなわち,踏み切り局面において発揮された床反力の大きさが,飛 距離に及ぼす影響を明らかにし,さらに,優れた選手の床反力発揮様式とその力学 的特徴を明らかにする。最後に,床反力発揮様式の違いに伴う姿勢の差違が,その 後の初期飛行局面に及ぼす影響を空気力学観点から明らかにする。 本研究の結果から,一流選手が行っている踏み切り技術を類型化し,それらの踏 み切り技術に伴う利益と不利益,または注意が必要な事柄が明らかになれば,選手 に対する踏み切り技術指導の指針となる知見を得ることが出来るものと考えられる。. 1.1. 先行研究の検討. ここでは,本研究と関連するスキージャンプ踏み切りおよび飛行局面に関するバ イオメカニクス的研究を概観し,本研究で取り扱う課題を明確にする。. 3.
(14) 1.1.1. 踏み切り動作に伴う力学量が飛距離に及ぼす影響. まず,踏み切り動作の特徴について見てみる。踏み切り動作は,助走姿勢で屈曲 していた膝関節および股関節を伸展することによって遂行される。一般的な跳躍動 作である垂直跳びにおいては,膝関節および股関節の伸展以外に,足関節の底屈も 身体重心の上昇速度を得るために重要であることが知られている(Hubley ら 1983; Soest ら 1985; Nagano ら 2000)。しかしながら,スキージャンプにおいては,下腿 上部にまで達するジャンプブーツが,足関節の可動域を制限するため,足関節の底 屈はほとんど行われていない(Schwameder ら 1997)。助走姿勢から踏み切り動作 終了に至るまでに,膝関節角度は約 80°から 140°まで(Virmavirta ら 1993b), 股関節角度は約 40°から 140°まで(Arndt ら 1995; Schwameder ら 1995)変化す ることが知られている。これらの関節が伸展する際の角速度は非常に大きく,それ ぞれの関節における角速度の最大値は,膝関節で 12 rad/s(約 688 deg/s),そして 股関節で 10 rad/s(約 573 deg/s)に達する(Virmavirta ら 1993b)。このような素早 い動きによって,実際の踏み切り動作に要する時間は非常に短く,0.25~0.30 s 程度 となっている(Komi ら 1974; Schwameder ら 1995)。このような素早い動きが行わ れている理由の一つは,踏み切り時間を短くすることで,股関節および膝関節を伸 展している時間を短くし,空気抵抗による助走速度の減少を防ぐためである (Baumann 1979)。もう一つの理由は,素早い動作によって大きな上昇速度を獲得 するためである。以下では,踏み切り動作による身体重心の上昇速度が,飛距離に 与える影響について検討した研究を概観する。 踏み切り動作によって得られる,身体重心の上昇速度の大きさが,スキージャン プの飛距離に影響を与えることは,コンピュータシミュレーションを用いた研究に よって理論的に確かめられてきた(Ward-Smith ら 1983; Denoth ら 1987; Hubbard ら 1989; Müller ら 1996)。これらの研究は,助走路に対して垂直方向の上昇速度が 1 m/s. 4.
(15) 増大すると,飛距離が 7 m (Hubbard ら 1989)から 20 m (Denoth ら 1987)程度 増大することを示している。それぞれの研究で用いられたジャンプ台の形状やジャ ンパーのモデルなどの条件が異なるため,これらの研究から得られた値はそれぞれ 異なるが,いずれの研究も,踏み切り動作による上昇速度の大きさが,飛距離を決 定する上で重要な役割を果たすことを示している。また,実際の競技場面において も,映像解析によって得られた身体重心の上昇速度と飛距離との間に,正の相関関 係が観察されたことが示されている(Komi ら 1974; Schwameder 1993; Schwameder ら 1995)。 助走路に対して垂直上向きの上昇速度を身体重心に与えるためには,踏み切り動 作によって,助走路に対して垂直下向きに力を発揮し,その反力である床反力を得 ることが重要となる。その理由は,床反力の積分値(力積)を身体質量で除した値 が,身体重心の上昇速度を意味するからである。 このように,踏み切り動作における床反力の発揮は,身体重心の上昇速度獲得に 深く関わっているため,その発揮方法を知るために様々な計測が行われてきた。 Tveit ら(1981)は,踏み切り動作によって発揮された床反力ベクトルの作用点(圧 力中心点)を知るため,ジャンプブーツのつま先および踵の 2 箇所に力センサーを 埋め込み,実際のスキージャンプ踏み切り動作において力を計測した。その結果, 踏み切り動作中に,圧力中心点が踵からつま先へと移動することを明らかにした。 その後,足底部のどこに力を伝えているのかを調べる研究は,近年の計測器の小型 化に伴い発展してきており,最近では 16~85 個の圧力センサーを備えた中敷きをジ ャンプブーツに挿入して,実際のスキージャンプ踏み切り動作に伴う足底部の圧力 分 布 を よ り 精 密 に 知 る こ と が で き る よ う に な っ て き た ( Schwameder ら 1995; Virmavirta ら 2001a; Virmavirta ら 2001c; Virmavirta ら 2001d)。 また,実際のジャンプ台に床反力計を埋設し,選手が発揮した床反力を計測する. 5.
(16) 試みが行われてきた(Sobotka ら 1977; Troxler ら 1979; Sägesser ら 1981; Vaverka ら 1981; Virmavirta ら 1989; Vaverka ら 1991; Vaverka ら 1993; Virmavirta ら 1993a; Virmavirta ら 1993b; Virmavirta ら 1993c)。Virmavirta ら(1989,1993a,1993b)は, 床反力の大きさが飛距離に影響を与えたことを示した。しかし,これらの研究では 床反力の平均値や最大値などの変数が用いられ,身体重心の上昇速度に深く関与す る力積に関する検討は行われていない。また,これらの実験が行われた 1980 年代後 半はスキーを平行に揃えて飛行する技術が広く用いられていた時期であり,最近の スキー板を V 字に開く飛行技術(いわゆる V 字姿勢)が用いられるようになってか らの研究は極めて少ない。. 1.1.2. 踏み切り動作の多様性について. 優れたスキージャンプ選手が踏み切り動作で発揮する床反力のパターン(床反力 発揮様式)は,同一選手内で再現性が高く,選手間で非常に異なることが,踏み切 り動作の模擬トレーニング(シミュレーションジャンプ)の分析から明らかにされ てきた(渡辺 1970; 渡辺ら 1971; 渡辺 1972; 渡辺 1974; Pedotti ら 1987)。同様に, 実際のスキージャンプの踏み切り動作でも,このような傾向が観察されることが報 告されている。実際のスキージャンプ踏み切り動作の多様性を指摘した先行研究を 以下に示す。 オリンピック冬季競技大会およびワールドカップなどの国際競技会の上位入賞者 を対象とした踏み切り動作の解析から,踏み切り動作には,選手個々の特徴がある ことが示されてきた。まず,踏み切り動作の姿勢に関しては,踏み切り局面終了時 の体幹部と水平線とのなす角度(Vaverka ら 1996; Vaverka ら 1997; Janura ら 2007; Virmavirta ら 2009),および下腿と水平線とのなす角度(Virmavirta ら 2009)につ いて上位選手間でも角度に大きな違いが見られたことが報告されている。一方で,. 6.
(17) 前述のシミュレーションジャンプと同様に,床反力発揮様式にも選手個々の特徴が あることが示されてきた(Virmavirta ら 1993a; Virmavirta ら 1993b)。 これらの研究結果は,被検者を一流選手に限定した場合でも,踏み切り局面にお ける動作様式や床反力発揮様式が被検者間で異なることを示すものである。しかし ながら,それぞれの床反力発揮様式が,身体重心の上昇速度などの力学量にどのよ うな影響を与えるのか検討されていない。また,床反力発揮様式の違いが,踏み切 り動作の姿勢,特に踏み切り局面終了時の姿勢に与える影響は検討されていない。 ここで,踏み切り局面に続く飛行局面では,飛行姿勢が空気力(抗力,揚力および ピッチングモーメント)を決定すること(Straumann 1927; 谷ら 1951)を考慮する と,床反力発揮様式の違いが,踏み切り局面終了時の姿勢にどのような影響を及ぼ すのかを明らかにすることは重要であると考えられる。. 1.1.3. 飛行姿勢の研究について. 前述のように,踏み切り局面終了時の姿勢は,その後に続く初期飛行局面の姿勢 でもある。ここでは,まず飛行局面を対象とした先行研究について概観し,本研究 で取り扱う初期飛行局面に関する課題を抽出する。次に飛行姿勢の空気力を測定す る手法について検討する。. 1.1.3. a. 飛行姿勢と空気力との関係について. スキージャンプの飛行局面に関する研究は,「最も良く飛ぶ飛行姿勢」とは何か を追求してきた。飛行姿勢に関する研究では,映像解析を用いたキネマティクス的 研究,風洞実験の手法を用いた空気力学的研究,および空気力学的資料を用いたシ ミュレーション研究の 3 つの分析手法が主に用いられてきた。以下にこれらの研究 を取り上げる。. 7.
(18) キネマティクス的研究は,優れた選手の飛行局面における身体の姿勢(関節角度 など)から,良い飛行姿勢を定義するものである。ごく初期の研究から,身体の前 傾について着目した分析が行われており,成績の優れた選手は成績の悪い選手に比 べ,飛行中の下肢または身体全体の前傾の角度が小さく(前傾が深く),身体また は下肢とスキーとのなす角度が小さいことが明らかにされてきた(Hochmuth 1958; Komi ら 1974; Gisler ら 1977; Baumann 1979)。 一方で,前傾姿勢の有効性を理論的に明らかにしてきたのは,風洞実験を用いた 空気力学的研究とシミュレーション研究である(Straumann 1927)。Straumann が風 洞実験を行った当時は,下肢とスキーとのなす角度は現在より大きく(下肢の前傾 が少なく),肩関節を屈曲した(上肢を頭の上に伸ばした)飛行姿勢であったが(村 上ら 2007; Müller 2009),Strauman が下肢とスキーとのなす角度を小さくし,抗力 を小さくする姿勢の優位性をシミュレーションによって示したことにより,下肢を 前傾させた姿勢が定着したと言われている(村上ら 2007)。その後,上肢を体側に 沿わせた姿勢が,上肢を頭上に挙上した姿勢よりも揚力が大きいという谷ら(1951, 1971)の研究によって,上肢を体側に沿わせた姿勢が一般的になった。これらの研 究の中で,飛行技術に最も大きな変化をもたらしたものは,スキーの先端を開いた 姿勢(V 字姿勢)が,従来のスキーを平行に揃えた姿勢よりも揚力および揚抗比が 増し,飛距離に有利であることを示した一連の研究(Mahnke ら 1990; 神ら 1992; 渡 部 1992; 渡部ら 1992; Watanabe ら 1993; 渡部ら 1993)であろう。その後の飛行姿 勢の空気力資料の蓄積により(瀬尾ら 1999; Seo ら 2004a),飛距離を最大化させ るためにはどのように姿勢を変化させればよいのかを,最適化制御問題として解く ことが行われるようになった(吉田ら 1996; 瀬尾ら 2000; Seo ら 2004b)。 本研究で着目する初期飛行局面は,ジャンプ台を飛び出してから安定した飛行姿 勢に至るまでの 0.4~1.0 s の間(15~30 m)と定義されている(Arndt ら 1995;. 8.
(19) Schwameder ら 1995; Schwameder ら 2005; Virmavirta ら 2005)。初期飛行局面の終 盤におけるスキーと身体とのなす角度と,飛距離との間には有意な負の相関関係が あることが報告されていることから(Arndt ら 1995; Schwameder ら 1995; Virmavirta ら 2005),この局面では素早く身体を前傾させて安定した飛行姿勢に移行すること が優れた技術であると考えられる。このように,素早い身体の前傾を実現させるた めには,踏み切り動作において,身体重心周りに前回りの角運動量を事前に与えて おく必要がある。しかしながら,ジャンプ台を飛び出した直後に身体-スキー系に 作用するピッチングモーメントの大きさは不明であるため,適切な前傾姿勢を得る ためには,どの程度の角運動量を踏み切り動作で与えておけばよいのか知られてい ない。 また,初期飛行局面における空気力の増大が,飛距離に影響を与えることが報告 されている(Müller 1996)。Müller(1996)は,フライングヒル(Planica, K = 185 m) を想定したシミュレーションの結果,初期飛行局面(0.4 s)における抗力を 10%減 少させると飛距離は 186.6 m から 194.2 m(約 4%)に増大し,揚力を 10%増大させ ると飛距離は 192.4 m(約 3%)に増大すること報告している。この結果は,初期飛 行局面における 10 %程度の空気力の変化であっても,飛距離の増大をもたらすこと を示している。しかしながら,このような空気力の増減がどのような姿勢変化によ ってもたらされるのかについては明らかにされていない。 このように,初期飛行局面の空気力(揚力,抗力およびピッチングモーメント) は,飛距離に大きな影響を及ぼすものと考えられるが,初期飛行局面の姿勢を対象 とした空気力学的資料は非常に少ないのが現状である。現時点で利用できる初期飛 行局面の空気力学的資料は,ある一つの飛行姿勢について空気力を計測したもので ある(Luhtanen ら 1997; Schmölzer ら 2002; Schmölzer ら 2005)。そのため,これ らの研究で用いられた姿勢固有の空気力は知ることができても,迎え角,股関節角. 9.
(20) 度,下肢とスキーとのなす角度およびスキーの V 字角度などの空気力に影響を及ぼ すと考えられる姿勢を変化させた場合の空気力を知ることができない。そのため, スキージャンプの飛行シミュレーション研究においては,踏み切り局面終了時から その後 0.4 s までの姿勢変化の大きい局面を,空気力の働かない放物運動として取り 扱うことしかできなかった(小早川ら 1985; Jin ら 1995; 吉田ら 1996; 瀬尾ら 2000; Seo ら 2004b)。 さらに,踏み切り局面終了時の姿勢については,優れた成績を収めた選手に限定 しても,股関節角度および体幹部分の前傾角度に個人間の変動が大きいことが示さ れている(Vaverka ら 1996; Vaverka ら 1997; Janura ら 2007)。したがって,優れ た選手であっても,初期飛行局面においては多様な姿勢変化を伴いながら,安定し た飛行姿勢に移行していると推察される。 以上のような背景から,初期飛行局面の多様な姿勢変化に対応した空気力資料を 蓄積し,飛行姿勢(迎え角,股関節角度,下肢とスキーとのなす角度およびスキー の V 字角度など)の変化による空気力の変化を推定する回帰モデルを構築すること が重要であると考えられる。. 1.1.3. b. 飛行局面の空気力測定手法について. ここでは,スキージャンプ飛行姿勢の空気力を測定する手法について検討を行う。 これまでに行われてきた研究は,その手法から,1)風洞実験による空気力学的研 究,2)映像解析による研究,3)加速度計とジャイロセンサーによる研究,4) 数値流体力学的研究,の 4 つに分類される。以下にそれぞれの研究を示す。 1)風洞実験による空気力学的研究は,これらの 4 つの研究の中で最も古くから 行われてきた(Straumann 1927; 谷ら 1951; Tani ら 1971; 谷ら 1971; 渡部 1981; Ward-Smith ら 1982; Watanabe 1983; 小早川ら 1985; 神ら 1992; 渡部 1992; 渡部ら. 10.
(21) 1992; Tavernier ら 1993; Watanabe ら 1993; 渡部ら 1993; 渡部ら 1994; Jin ら 1995; Müller ら 1996; 瀬尾ら 1999; 瀬尾ら 2000; Schmölzer ら 2002; Reisenberger ら 2004; Seo ら 2004a; Meile ら 2006; Maryniak ら 2009)。風洞実験では,人工的に発 生させた一様な気流の中に測定対象(模型または実物)を固定し,測定対象に取り 付けた計測器(ロードセルまたはストレインゲージ方式)によって作用した空気力 を測定する方法を用いる(東 1993)。実験室において測定ができるため,模型の姿 勢を厳密に決めることが可能であり,また気流速度も任意に設定できることが利点 である。ただし,模型を使用する場合には,実物の形状をできるだけ忠実に再現し た模型を使用する必要がある。また,測定上の問題ではないが,一つの姿勢変化毎 に模型の設定を変更しなくてはならないため,広範囲の姿勢変化を対象に空気力を 測定する際には,後述する 3 つの研究手法よりも多くの時間を要する。 2)映像解析による研究は,実際のジャンプの飛行姿勢を撮影し,2 次元または 3 次元的に映像解析を行うことで,身体-スキー系の加速度とその進行方向から空気 力を算出する方法を用いる(Sasaki ら 2001; 平井ら 2006; 平井ら 2007; Gasser ら 2008; Murakami ら 2008)。この手法は,原理的には全飛行局面の飛行姿勢に作用す る空気力を計測することができる。ただし,飛行中の風向きおよび風速の変化によ る空気力の影響を差し引くことが困難であるため,精度良く空気力を測定するため には無風であることが条件となる。しかしながら,自然環境下でこの条件を満たす ことは非常に困難である。また,高解像度(1024×512 pixels)の高速度ビデオ映像 を用いて,手動デジタイズによる入力誤差を最小限にしても,映像解析で得られた 座標の 2 回微分操作によって加速度を算出する過程で,高周波ノイズが増幅するた め,実際には空気力推定が困難であることが報告されている(Sasaki ら 2001; 平井 ら 2006; 平井ら 2007; Gasser ら 2008; Murakami ら 2008)。 3)加速度計とジャイロセンサーによる研究は,選手に取り付けた加速度計とジ. 11.
(22) ャイロセンサーによって,実際に飛行している選手の加速度の変化から空気力を測 定する方法を用いる。まだ例数は少ないが,最近の計測機器の軽量化・小型化と無 線による選手の非拘束化によってこの方法が実用されるようになってきた(Ohgi ら 2008)。この方法は,原理的には全飛行局面の飛行姿勢に作用する空気力を計測す ることができ,さらに,センサーの利用によって前述の 2 つの研究手法よりも即時 に分析結果が得られるという利点がある。しかながら,前述の映像解析による研究 と同様に,風の影響を除去することが困難である。また,センサーの取り付け位置 によっては,身体-スキー系の加速度に加えて身体の挙動による加速度(例えば股 関節の伸展など)も空気力の作用として計測されてしまう恐れがある。 4)数値流体力学的研究(Computational Fluid Dynamics: CFD)は,身体-スキー 系の周りを流れる流体(空気)の挙動を記述したレイノルズ平均ナビエ・ストーク ス(Reynolds Averaged Navier-Stokes: RANS)方程式と呼ばれる偏微分方程式を数値 的に解くことで空気力を推定する方法を用いる(Asai ら 1997; 浅井ら 1998; Meile ら 2006; Meile ら 2008)。CFD は計算によって空気力を推定する手法として非常に 強力であり,比較的単純な構造物(平板など)に作用する空気力を精度良く知るこ とができる(ファ-ツィガーら 2008)。一方で,ヒトの身体のように複雑な曲面で 構成された物体に関しては,CFD で得られた空気力の大きさが風洞実験で得られた 空気力の 65.8~88.4%程度の大きさであったという報告もある(Meile ら 2006)。 すなわち,身体-スキー系のような複雑の形状を対象とした場合,CFD によって空 気力を高い精度で得られるとは限らない。また,計算された空気力がどの程度正し いのか判断するためには,前述の風洞実験によって得られた空気力との比較が必要 であるため,結局は風洞実験を行うことが必要となる。 これらの研究手法の特徴から,2)映像解析による研究,および3)加速度計と ジャイロセンサーによる研究は,空気力の精度に問題があると考えられる。次に,. 12.
(23) 4)数値流体力学的研究は,測定結果の精度を風洞実験によって確認する必要があ るため,結果的には,1)風洞実験による空気力学的研究を行うことが,これらの 研究手法の中で最も妥当であると考えられる。. 1.2. 研究の目的および課題. 本研究は,スキージャンプの 4 局面の中でも踏み切り局面に着目し,その直後の 飛行局面(初期飛行局面)に及ぼす空気力学的な影響を考慮しつつ,踏み切り局面 に固有の技術的要因と飛距離との関係を明らかにすることを目的とした。. この目的を達成するために,本研究の課題を以下のように設定した。 1)踏み切り局面において発揮される床反力の力学的特徴と,飛距離との関係を明 らかにする。このため,競技者の技術水準が高く,助走速度および風の影響が よくコントロールされているスキージャンプ国際競技会の参加選手を対象に, 踏み切り局面において発揮された床反力を測定し,その力学量(平均床反力, 最大床反力,力積)と飛距離との関係を検討する(第 2 章. 実験 1)。. 2)一流スキージャンプ選手の踏み切り動作を,発揮した床反力発揮様式から分類 し,その力学的特性を明らかにする。このため,世界一流の技術を持つ複数の スキージャンプ選手を対象に,踏み切り局面における床反力の測定および映像 解析を行い,床反力発揮様式の違いが身体重心の上昇速度および,踏み切り局 面終了時の姿勢に与える影響を検討する(第 3 章. 実験 2)。. 3)踏み切り局面終了時の姿勢の違いが,その後の初期飛行局面の飛行姿勢制御に どのような影響を与えるのか明らかにする。このため,踏み切り局面終了時の. 13.
(24) 姿勢の差違が,その後の初期飛行局面の姿勢制御,飛行速度および飛行軌跡に 与える影響を,映像解析の手法(第 4 章. 実験 3),および風洞実験から得ら. れた空気力資料を用いた飛行シミュレーション手法(第 5 章 討する。. 14. 実験 4)から検.
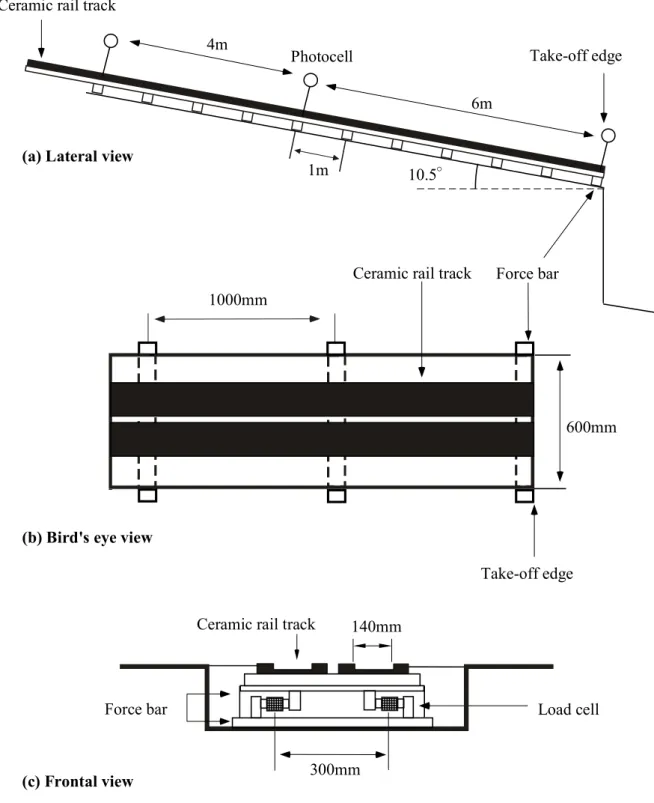
(25) 2. 踏み切り局面における力学的諸変量が飛距離に及ぼす影. 響(実験1). 2.1. 目的. 本研究では競技者の技術レベルが高く,さらに助走速度や風の影響がよくコント ロールされているスキージャンプ国際競技会の参加選手を対象に,踏み切り局面に おいて発揮された床反力を測定し,平均床反力,最大床反力および力積と,スキー ジャンプの飛距離との関係を明らかにすることを目的とした。. 2.2. 方法. 実験 1 では,国際ジャンプ競技会において踏み切り動作における床反力を測定し, 床反力から算出された変数と飛距離との相関関係を解析した。また,助走速度と体 重が飛距離に及ぼす影響も補足的に解析した。以下に測定および解析方法について 述べる。. 2.2.1. 床反力計. 本研究では実際のスキージャンプにおいて,選手が踏み切り動作によって発揮し た床反力をジャンプ台に埋設された床反力計を用いて測定した。測定された床反力 は助走路に垂直方向の成分である。この床反力計は長野県白馬村の白馬村ジャンプ 競技場ノーマルヒルジャンプ台(K = 90 m)に設置されており,助走路の終端 10 m の区間に埋設されている。Fig. 1 に床反力計の模式図を示す。上から順に側面図, 俯瞰図,前面図をそれぞれ示す。床反力計は,ロードセルを左右に 1 つずつ備えた Force bar が助走路に沿って 1. m 間隔で 11 本配置された構造となっている。2 本の. Force bar から得られた信号を 1 台の床反力計として(最下部の 1 台のみ Force bar. 15.
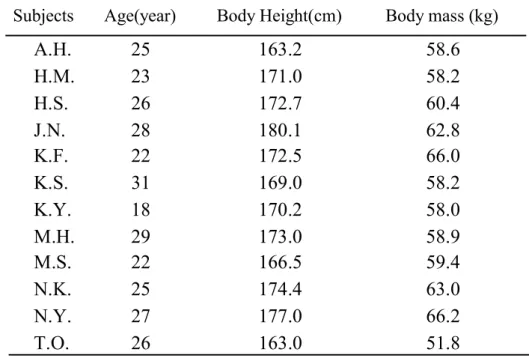
(26) を 3 本使用),合計 5 台の床反力計がそれぞれ増幅器に接続されている。最終的な 出力は,これら 5 台の床反力計の総和となる。この床反力計はフィンランドの P.V. Komi らの研究グループ(Jyväskylä Univ., Finland)によって設計・開発され,REUTE PRECISION OY 社(Finland)が作成したものである。埋設される前に行われたロー ドセルの特性試験では,直線誤差およびヒステリシス誤差は 0.05%以下,適正負荷 240kg(2354N),最大負荷 300kg(2943N)であった。これらの値は,今回の実験 で測定された床反力の範囲を十分にクリアするものであった。. 2.2.2. 被検者. 被検者は 1996 年 9 月 21 日に長野県白馬村において開催されたサマージャンプ競 技会:FIS Continental Cup Asia Series NTT Cup Summer Jumping Games の参加者 50 名 である(ノーマルヒル競技. K = 90 m)。参加者の中にはオリンピック冬季競技大. 会(リレハンメル,1994 年)の日本代表選手も含まれている。日本人選手以外にノ ルウェー,フィンランド,中国,スイス,ポーランド,ドイツ,オーストリア,韓 国,チェコスロヴァキアからの参加選手も含まれる。データの収集は 1 本目および 2 本目の競技中に行われた。. 16.
(27) Ceramic rail track 4m. Take-off edge. Photocell 6m. (a) Lateral view. 1m. 10.5°. Ceramic rail track. Force bar. 1000mm. 600mm. (b) Bird's eye view Take-off edge Ceramic rail track. 140mm. Force bar. (c) Frontal view. Load cell. 300mm. Figure 1 Schematic diagram of the force measurement system installed in the take-off platform(Normal hill:K=90, Hakuba jumping stadium).. 17.
(28) 2.2.3. 測定手順. 白馬ジャンプ競技場ノーマルヒルジャンプ台の助走路に埋設された長さ 10 m の ロードセル方式床反力計を用いて,助走路に垂直方向に発揮された床反力を測定し た。実験模式図を Fig. 2 に示す。試合終了直後に助走路の終端から 1 m 毎に較正用 の荷重負荷をかけて床反力計(10 m)の較正を行った。床反力計の前半 3.8 m は R1 と呼ばれる曲線部分(曲率半径 85 m)を含み,後半の 6.2 m は下向き 10.5°の勾配 を持つ直線部分にあたる。ジャンプ台の終端から 10 m の区間に対して 1 m 間隔で 60kg, 150kg, 200kg の 3 段階の荷重負荷を用いて,各較正点の勾配(10.5~13.1°) を考慮に入れた上で,助走路に対して垂直方向について較正を行った。また,選手 の滑走位置を知るために,助走路の終端からスタート地点に向かって 0 m,6 m,10 m,13 m の 4 ヶ所に光電管を設置し,選手が光電管を通過したときの光電管の電圧 変化を記録した。 上記の床反力および光電管からの位置情報は,アナログデータレコーダ(日本光 電社製,RMG-5204)を用いて記録した。アナログデータレコーダによって記録さ れたデータは,後日研究室にて A/D 変換ボードを用いてサンプリング周波数 1000 Hz にてコンピュータに取り込んだ。試技終了直後に,スキー板,ヘルメットなどジ ャンプ競技に用いる装備を全て装着した状態で各選手の総質量を計測した。. 18.
(29) Edge of take-off platform Direction of movement Photocell Ski jumper 4m. Hip. Knee. 6m 10.5°. Force plate. Amp.. Data recorder. Sync. signal. High speed camera VTR. Figure 2 Schematic diagram of experimental setup for the experiment. In this diagram, the force measurement system and the camera setting are depicted. The high speed camera was used in experiment. In video analysis, two joint angles (Knee and Hip) during take-off were calculated.. 19.
(30) (F'6-0m) Fz peak (I6-0m ) 1000N. Total Body Weight Fz. 10m -500. -400. 0m (Take-off edge). 6m -300. -200. -100. Photocell. 0. Time (msec) Figure 3 The force curve and photocell signal. Fz peak refers to maximal forces and F'6-0m refers to averaged force levels and I6-0m refers to impulse of the force. Photocell signal was recorded to identify the position of a ski jumper running on the take-off platform. These variables were given by using photocell signals for 6m distance before take-off edge.. 20.
(31) 2.2.4. 床反力の解析. まず,ジャンプ台に埋設された床反力計から得られた信号から高周波のノイズを 除去するために遮断周波数 50Hz の特性を持つ 2 次のバターワース型ローパスフィ ルタをデータの両端から用いて平滑化を行った後に,以下の解析を行った。 先行研究(渡部 1983)によると,選手が踏み切り動作を開始する位置は助走路の 終端から約 3 m 手前の位置であったと報告されている。そこで本研究では,踏み切 り動作の開始時点を十分に含むと思われる助走路の終端から 6 m 手前の地点から助 走路の終端を選手が通過するまでの区間(助走路の直線部分に当たる)について解 析を行った。 床反力データから以下の項目を算出した(Fig. 3 参照) 1)F'6-0m:助走路の終端を基準(0 m)として床反力計の 6-0m の区間で発揮された 床反力の平均値(N)を選手の総質量(kgBw)で割った値(N/kgBw) 2)Fzpeak:6-0m の区間で発揮された床反力の最大値(N)を選手の総質量(kgBw) で割った値(N/kgBw) 3)I6-0m:6-0m の区間において発揮された床反力の積分値(Ns)を選手の総質量 (kgBw)で割った値(Ns/kgBw)(力積の算出にあたっては,得られた床反力 データ(N)から各選手の総重量(N)を引いた値を積分した。). 2.2.5. 統計処理. 1 本目および 2 本目の各試技において,床反力計から得られた3変数(F'6-0m, Fzpeak, I6-0m)と,選手の総質量および助走速度を加えた合計 5 変数と,飛距離との 相関係数を求めた。なお,助走速度は大会公式速度を使用した。 また上位群と下位群の比較として,上位 10 名 (longest 10)と最下位から 10 名 (shortest 10)の 2 群を 1 本目および 2 本目の試技からそれぞれ飛距離を基準に抽出. 21.
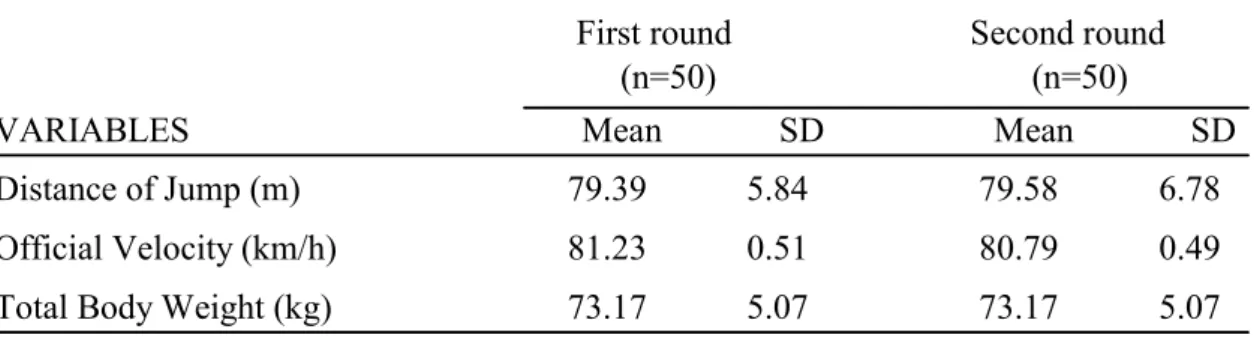
(32) し,2 群の平均値を比較した。統計処理には対応のない t 検定を用いた。 さらに 1 本目および 2 本目の試技より抽出された上位 10 名について,1~5 位を top5 群(n=5),6~10 位を next5 群(n=5)に分類し,2 群間の床反力変数の比較を 行った(対応のない t 検定を使用)。なお,F 検定によって 2 群の分散が等しくな いと判断された場合には,ノンパラメトリックテスト(Mann-Whitney の U-test)を 用いた。統計パッケージとして Statview5.0 (SAS Institute Inc.)を使用した。すべ ての統計処理において危険率 5%水準を統計学的有意とした。. 2.3. 結果. ここでは,踏み切り動作に伴って選手が発揮した床反力から算出した変数(平均 床反力,最大床反力および力積)と飛距離との関係を中心に検討する。. 2.3.1. 力学的諸変量と飛距離との相関関係. 2.3.1. a Table 1. 総質量および公式速度について に1本目および2本目の試技における飛距離(m),助走速度(km/h),. 総質量(kg)の平均値および標準偏差を示す。なお,助走速度は大会公式速度をも って助走速度とした。. 22.
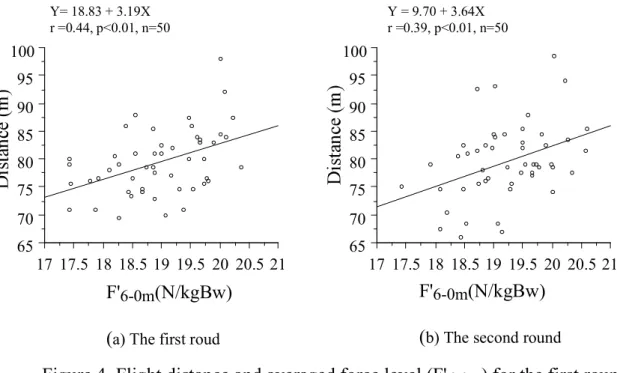
(33) Table 1 The selected variables of 50 subjects in the first and the second round. First round (n=50) VARIABLES. Second round (n=50). Mean. SD. Mean. SD. Distance of Jump (m). 79.39. 5.84. 79.58. 6.78. Official Velocity (km/h). 81.23. 0.51. 80.79. 0.49. Total Body Weight (kg). 73.17. 5.07. 73.17. 5.07. ジャンプの飛距離については,1本目と2本目の試技においてほぼ同値であり, 統計学的に有意な差は見られなかった(79.39±5.84 m VS 79.58±6.78 m)。 飛距離と総質量の間には,1本目の試技において有意な負の相関関係が見られた が(r = -0.39, p < 0.01, n = 50),2本目の試技においては有意な相関関係は見られ なかった(r=-0.14, N.S., n=50)。 飛距離と助走速度の間には,1本目の試技においては有意な相関関係は見られな かったが(r=0.18, N.S., n=50),2本目の試技において両者の間には有意な正の相 関関係が見られた(r = 0.36, p < 0.05, n = 50)。 総質量と助走速度の間には有意な正の相関関係が見られた(1本目:r = 0.30, p < 0.05, n = 50,2本目:r = 0.35, p < 0.05, n = 50)。. 2.3.1. b. 平均床反力について. 1本目の試技における 50 名の選手の平均床反力(F'6-0m)の平均値と標準偏差は 18.97±0.80 N/kgBw であった。2本目の試技における F'6-0m の平均値と標準偏差は 19.21±0.72 N/kgBw であった。 Fig. 4a および Fig. 4b はそれぞれ1本目と2本目の試技における飛距離と平均床反 力(F'6-0m)の関係を示したものである。それぞれ縦軸は飛距離を,横軸は平均床反. 23.
(34) Y= 18.83 + 3.19X r =0.44, p<0.01, n=50. Y = 9.70 + 3.64X r =0.39, p<0.01, n=50. 100. 100. 95. 95. 90. 90. 85. 85. 80. 80. 75. 75. 70. 70. 65. 65. 17 17.5 18 18.5 19 19.5 20 20.5 21. 17 17.5 18 18.5 19 19.5 20 20.5 21. F'6-0m(N/kgBw). F'6-0m(N/kgBw). (a) The first roud. (b) The second round. Figure 4 Flight distance and averaged force level (F'6-0m) for the first round (a) and the second round (b).. 力を示す。Fig. 4a に示されるように,1本目の試技において飛距離と F'6-0m の間に は有意な正の相関関係が見られた(r = 0.44, p < 0.01, n = 50)。また Fig. 4b に示され るように,2本目の試技においても飛距離と F'6-0m の間には有意な正の相関関係が 見られた(r = 0.39, p < 0.01, n = 50)。. 2.3.1. c. 最大床反力について. 1本目の試技における 50 名の最大床反力(Fzpeak)の平均値と標準偏差は 22.45± 1.41 N/kgBw であった。2本目の Fzpeak の平均値と標準偏差は 22.69±1.55 N/kgBw で あった。 Fig. 5a および Fig. 5b はそれぞれ飛距離と最大床反力(Fzpeak)の関係を示したも のである。それぞれ縦軸は飛距離を,横軸は最大床反力を示す。Fig. 5a に示される ように,1本目の試技において飛距離と Fzpeak の間には有意な正の相関関係が見ら れた(r = 0.36, p < 0.05, n = 50)。しかしながら,Fig. 5b に示されるように,2本目. 24.
(35) Y = 58.85 + 0.91X r = 0.21, N.S., n=50. Y = 46.37 + 1.47X r = 0.36, p<0.05, n=50. 100. 100. 95. 95. 90. 90. 85. 85. 80. 80. 75. 75. 70. 70. 65. 65. 18 19 20 21 22 23 24 25 26 27. 18 19 20 21 22 23 24 25 26 27. Fzpeak(N/kgBw). Fzpeak(N/kgBw). (a) The first round. (b) The second round. Figure 5 Flight distance and peak force value (Fzpeak ) for the first round (a) and the second round (b).. の試技においては飛距離と Fzpeak との間に有意な相関関係は見られなかった(r = 0.21, N.S., n = 50)。. 2.3.1. d. 力積について. 1本目の試技における 50 名の力積(I6-0m )の平均値と標準偏差は 2.37±0.21 Ns/kgBw であった。また,2本目の試技における I6-0m の平均値と標準偏差は 2.42± 0.18Ns/kgBw であった。Fig. 6a および Fig. 6b はそれぞれ1本目と2本目の試技にお ける飛距離と力積(I6-0m)の関係を示すものである。縦軸は飛距離を,横軸は力積 (I6-0m)をそれぞれ示す。Fig. 6a に示されるように,1本目の試技における飛距離 と I6-0m の間に有意な正の相関関係が見られた(r = 0.48, p < 0.001, n = 50)。また Fig. 6b に示されるように,2本目の試技における飛距離と I6-0m の間にも有意な正の相関 関係が見られた( r = 0.35, p < 0.05, n = 50)。. 25.
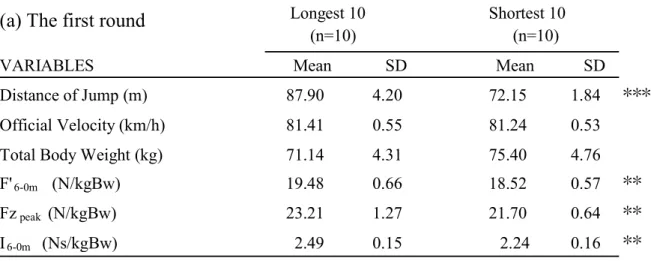
(36) Y = 47.54 + 13.21X r=0.35, p<0.05, n=50. Y = 47.35 + 13.53X r=0.48, p<0.001, n=50. 100. 100. 95. 95. 90. 90. 85. 85. 80. 80. 75. 75. 70. 70. 65 1.9. 2.1. 2.3. 2.5. 2.7. 65. 2.9. 1.9. 2.1. 2.3. 2.5. I6-0m(Ns/kgBw). I6-0m(Ns/kgBw). (a) The first round. (b) The second round. 2.7. 2.9. Figure 6 Flight distance and impulse of the force (I6-0m) for the first round (a) and the second round (b).. 2.3.2. 上位群と下位群の比較. 競技成績の異なる被検者群での比較を行うために,1本目および2本目の試技に おいて,飛距離を基準に1位から 10 名と最下位から 10 名の2群を抽出した。上位 群(Longest 10)と下位群(Shortest 10)の飛距離,助走速度,総質量,平均床反力, 最大床反力および力積について,平均値と標準偏差を Table 2a(1 本目の試技)と Table 2b(2本目の試技)に示す。. 2.3.2. a. 飛距離,総質量および助走速度について. Table 2 に示したように,1本目および2本目の両試技において,飛距離は上位群 が下位群よりも有意に高い値を示した(1本目:87.90±4.20 m VS 72.15±1.84 m, p < 0.001, 2本目:89.05±5.05 m VS 70.55±3.49 m, p < 0.0001)。助走速度は1本目の 試技において上位群と下位群に有意な差は見られなかったが(81.41±0.55 km/h VS. 26.
図
+7


関連したドキュメント
Keywords and Phrases: moduli of vector bundles on curves, modular compactification, general linear
In our paper we tried to characterize the automorphism group of all integral circulant graphs based on the idea that for some divisors d | n the classes modulo d permute under
Answering a question of de la Harpe and Bridson in the Kourovka Notebook, we build the explicit embeddings of the additive group of rational numbers Q in a finitely generated group
Definition An embeddable tiled surface is a tiled surface which is actually achieved as the graph of singular leaves of some embedded orientable surface with closed braid
We give a Dehn–Nielsen type theorem for the homology cobordism group of homol- ogy cylinders by considering its action on the acyclic closure, which was defined by Levine in [12]
Our method of proof can also be used to recover the rational homotopy of L K(2) S 0 as well as the chromatic splitting conjecture at primes p > 3 [16]; we only need to use the
One important application of the the- orem of Floyd and Oertel is the proof of a theorem of Hatcher [15], which says that incompressible surfaces in an orientable and
The Grothendieck-Teichm¨ uller group and the outer automorphism groups of the profinite braid groups (joint.. work with
