Trace Analysis of Metals Using Naphthalene Part I Spectrophotometric Determination of Cobalt after Extraction of Its Chinoform Complex with Molten Naphthalene
journal or
publication title
福井大学工学部研究報告
volume 30
number 1
page range 63‑79
year 1982‑03
URL http://hdl.handle.net/10098/4360
FUKUI UNIVERSITY
VO L. 30 No. 1 1982
Trace Analysis of Metals Using Naphthalene Part I
~pectrophotometric Determination of Cobalt after Extraction of Its Chinoform Complex with Molten Naphthalene
* ** ***
Masatada SATAKE , Bal K. PURl , J u Chieng YUH and
****
Lih-Fen CHANG
(received Feb. 28, 1982)
A new method is described for naphthalene extraction and spectrophotometric determination of trace cobalt with chinoform.
The method is based on the formation of the colored complex which is extractable with molten naphthalene and on the dissolution of the extract in dimethylformamide. This solution follows Beer's law'at 428 nm over the range of 3-43 pg of cobalt per 10 ml of dimethylformamide. The color of the complex is stable for 90 min. The various factors such as pH, amounts of reagent and naphthalene, digestion and shaking time are studied, and the molar absorptivity and relative standard deviation are estimated. The extraction of the complex into molten naphthalene is rapidly com- pleted by contact with molten naphthalene or by slight shaking.
1. Introduction
Chinoform (5-chloro-7-iodo-8-hydroxyquinoline), which is a derivative of oxine(8-hydroxyquinoline), forms water-insoluble complexes with various metal ions such as iron(III) , zinc, cadmium, bismuth(III) ,
palladi~m, etc. These complexes are easily and quantitatively extracted into chloroform or benzene.
We have investigated a method of analyzing the trace amounts of metals involving extraction of metal complexes into molten naphthalene
. . d . . 1) -10) I
and thelr subsequent spectrophotometrlc etermlnatlon. n
*
Division of Applied Science, Fukui University.** Dept. of Chemistry, Indian Institute of Technology, New Delhi.
*** Chang HuaJuniormiddle School, Chang Hua city, Republic of China.
**** National Taiwan Education College, Republic of China.
the present work, chinoform as a complexing reagent was chosen for the spectrophotometric determination of cobalt. This reagent reacts with cobalt in alkalline solution with the formation of a water-insoluble complex, which is quantitatively extracted into molten naphthalene at the temperature above 81°C. The extracted naphthalene mixture is dissolved in dimethylformamide and the absorbance of the solution is measured at 428 nm.
2. Experimental method Apparatus and reagents
All absorbance measurements were made with a Shimadzu Model QV-50 UV-Visible spectrophotometer in a 10 rom glass cell.
The measurements of pH were performed with a Beckman Model H-2 pH meter.
A stock solution of cobalt was prepared from cobalt nitrate
(analytical reagent-grade) in distilled water. More dilute solutions were prepared as required by diluting a stock solution.
The chemicals used were either chemically pure or reagent-grade materials unless otherwise mentioned.
Chinoform solution, 0.2% was prepared by dissolving this reagent in ethanol.
Buffer solutions of different pH were prepared by mixing 1M acetic acid and 1M ammonium acetate solution for pH 3-6, or 1M aqueous
ammonia and 1M ammonium acetate solution for pH 8-11.
Naphthalene solution, 20% was prepared by dissolving this reagent in acetone.
Deionized water was used.
Procedure
To about 25 ml of samples containing 1-9 ml of 5ppm standard cobalt solution in 80-ml tightly stoppered Erlenmeyer flask, was added 2.0 ml of 0.2% chinoform solution, the pH being adjusted to 8.2. The solution was mixed well and heated on a water bath for about 15 min.
After digestion, 2.0 g of naphthalene was added. Shake i t vigorously untill naphthalene solidifies forming fine crystalline deposit.
After extraction, two phase was separated through a filter paper, and the surplus water attached to a filter paper was removed. Dry i t in a dryer at about SooC. Then dissolve i t in dimethylformamide and dilute to 10 mI. Measure the absorbance of the solutionin a 10-rom glass cell against the reagent blank.
3. Results and discussion 3.1 Absorption spectra
Sample solution containing 30 pg of cobalt, 2.0 ml of 0.2%
chinoform solution and 2.0 ml of the acetate buffer solution(pH 8.2) was prepared by the procedure, and the absorption spectra of the reagent and cobalt complex was measured at various wavelengths in the range of 370-470 nm, as shown in Fig. 1. The curve of the complex shows a absorption maximum at 428 nm and becomes insignificant beyond 470 nm. The reagent blank shows strong absorption below 390 nm.
Therefore, 428 nm was chosen as the most siutable wavelength.
3.2 Effect of pH
The relationship between the absorbance and pH of the solution after extraction was investigated in the pH range 6.5-10.3. The results are shown in Fig.2. From the experimental data, the ab- sorbance of the complex is almost constant over the narrow range 8.0-8.4. Therefore, the pH of the solution was adjusted to 8.2 for the absorbance measurements.
1.0
0.8
UJ u
z 0.6
<
III
g Q:
III 0.4
ex:
0.2
390 4 IO 430 450 470 WAVELENGTH, NM
FIG. I ABSORPTION SPECTRA OF CHINOFORM AND COBALT COMPLEX IN NAPHTHALENE-DIMETHYLFORMAMIDE COBALT: 30 ~G ; 0.2% CHINOFORM : 2.0 ML ;
pH : 8.2 ; DIGESTION TIME : IS MIN ; NAPHTHALENE 2.0 G ; STANDING TIME: IS MIN
REFERENCE : WATER
UJ U
1.0
0.8
~ 0.6
g
III
ex: 0.4
0.2
O---~--~--~--~_
7.0 8.0 9.0 IO.O 11.0
pH
FIG. 2 EFFECT OF pH
COBALT : 30 ~G WAVELENGTH: 428 NM ; 0.2% CHINOFORM 2.0 ML ; NAPHTHALENE: 2.0G;
DIGESTION TIME IS MIN; STANDING TIME :
IS MIN
REFERENCE REAGENT BLANK
3.3 Effect of reagent concentration
Varying amounts of chinoform were added to the sample solution containing 30 pg of cobalt and 2.0 ml of the acetate buffer solution,
and variation in the absorbance of the complex were studied at 428 nm.
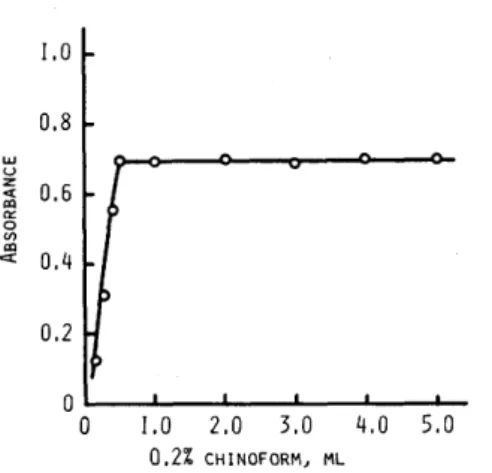
The results are shown in Fig.3. It can be seen that the absorbance increased with increasing amounts of chinoform up to 0.5 ml of 0.2%
chinoform solution and remained practically constant over the range 0.5-5.0 mI. Consequently, ~.O ml of 0.2% chinoform solution were added for the further work.
3.4 Effect of buffer solution and naphthalene
To the sample solution containing 30 pg of cobalt and 2.0 ml of 0.2% chinoform solution were added varying volume of the buffer so- lution(pH 8.2) and the effect of the buffer solution on the ab- sorbance was investigated between 1.0 and 4.0 mI. From the experi- mental data, the absorbance was not changed by addi tion of up to 4.0 ml of the buffer solution. The effect of addition of naphthalene on the extraction was investigated , and the results obtained are shown in Fig.4. As seen in Fig.4, the absorbance is independent of the amounts of naphthalene over the range 0.3-3.0 g. Therefore, 2.0 g of naphthalene was used for the further work.
UJ u z «
III a::
0 en c:t: III
1.0 0.8 0.6 0.4 0.2
1.0 2.0 3.0 0.2% CHINOFORM, ML
4.0 5.0
FIG. 3 EFFECT OF REAGENT CONCENTRATION COBALT: 30 ~G ; WAVELENGTH : 428 NM pH: 8.2
NAPHTHALENE : 2.0 G ; DIGESTION TIME : 15 MIN;
STANDING TIME : 15 MIN REFERENCE : REAGENT BLANK
1.0 0.8
0 0 a 0 0 0 Q
UJ u
0.6
z «
III a::
0 en
III 0.4
c:t:
0.2
o'---~---
o
0.6 1.2 1.8 2.4... -
3.0NAPHTHALENE- G
FIG. 4 EFFECT OF ADDITION OF NAPHTHALENE COBALT : 30 pG ; WAVELENGTH : 428 NM ;
pH : 8.2 i 0.2% CHINOFORM : 2.0 Ml i SHAKING TIME :1.0 MIN i STANDING TIME: 15 MIN REFERENCE : REAGENT BLANK
3.5 Effect of digestion and shaking time
The cobalt-chinoform complex in the solution containing 30 pg of cobalt at pH 8.2 was digested at high temperature, and the results are shown in Fig.S. From the experimental results, the variation
in the absorbance can't be seen between 5 and 50 min. Therefore, 15 min of digestion time was chosen for the further work. The effect of shaking time on the absorbance was examined. The results showed that the extraction of the complex into molten naphthalene was very fast and no change was seen in the degree of extraction when shaking time was varied from 5 to 50 min. Therefore, 15 min of shaking time was chosed for the further work.
3.6 Effect of standing time
The mixture of the cobalt complex and naphthalene was dissolved in dimethylformamide, and the effect of standing time on the ab- sorbance was examined between 5 and 90 min. The color of the complex in dimethylformamide solution was very stable and this period of standing time did not give the change in the absorbance.
are shown in Fig.6.
The results
LU U
1.0 0.8
Z 0.6
~ ~
~ 0.4 0.2
o o
o Q o
10 20 30 40
DIGESTION TIME, MIN FIG. 5 EFFECT OF DIGESTION TIME COBAl T : 30)JG ; I-/AVElENGTH : 428 NM ;
50
pH :8.2 ; 0.2% CHINOFORM : 2.0 Ml ; NAPHTHALENE:
2.0 G ; STANDING TIME: 15 MIN REFERENCE : REAGENT BLANK
3.7 Calibration curve
1.0 0.8
LU u
z 0.6
c(
<Q
a::
0 U)
<Q
0.4
<[;
0.2 0
0 20 40 60 80
STANDING TIMe MIN FIG. 6 EFFECT OF STANDING TIME COBALT : 30)JG ; WAVELENGTH :428 NM
pH : 8.2 ; 0.2% CHINOFORM : 2.0 Ml ; NAPHTHALENE: 2.0 G ; DIGESTION TIME: I5 MIN REFERENCE : REAGENT BLANK
Under the optimum conditions described above, the calibration curve for cobalt determination was constructed at 428 nm against the reagent blank. The result is shown in Fig.7. Beer's law was obeyed over the concentration of 3-43 pg cobalt in 10 ml of dimethylformamide.
4 - 1 - 1
The molar absorptivity was 1.4 x 10 l·mol ·cm at 428 nm, the sensitivity as expressed by Sandell's ,notation being 4.3 x 10⁻³ ~g
cobalt per cm . 2 The precision of this method was estimated with ten samples containing 30 pg of cobalt. A mean absorbance at 428 nm was 0.700 with a standard deviation of 1.15 x 10⁻²
, or a relative standard deviation of 1.6%.
1.0 0.8
w u z < 0.6
~
~
0 ~
~ 0.4 0.2
COBALT, pG/IO ML DMF FIG. 7 CALIBRATION CURVE FOR COBALT WAVELENGTH: 428 NM ; pH : 8.2 ; 0.2%
CHINOFORM : 2.0 ML ; DIGESTION TIME:
IS MIN; NAPHTHALENE: 2.0 G ; STANDING TIME: IS MIN
REFERENCE : REAGENT BLANK
References
1. T.Fujinaga, M.Satake and T.Yonekubo, Bull. Chern. Soc. Jpn., 1975, ~, 899.
2. T.Fujinaga, M.Satake and M.Shimizu, Bunseki Kagaku, 1976,~, 313.
3. M.Satake and Y.Takagi, Bunseki Kagaku, 1977, ~, 386.
4. M.Satake, Anal. Chim. Acta, 1977, ~, 423.
5. T.Fujinaga, M.Satake and T.Yonekubo, Bull. Chern. Soc. Jpn., 1973, 46, 2090.
6. T.Fujinaga, M.Satake and T.Yonekubo, Ta1anta, 1972, 19, 689.
7. T.Fujinaga, M.Satake and T.Yonekubo, Bunseki Kagaku, 1971,
~, 1225.
8. M.Satake, Memoirs Fac. Engineering, Fukui Univ., 1970, 18, 225.
9. T.Fujinaga, M.Satake and T.Yonekubo, Bunseki Kagaku, 1970, 19, 216.
10. T.Fujinaga, T.Kuwamoto, T.Yonekubo and M.Satake, Bunseki Kagaku, 1969, ~, 1113.
Part II
Atomic Absorption Spectrophotometric Determination of Manganese after Adsorption of Its 5-Chloro-7-iodo- 8-quinolinol Complex on Microcrystalline Naphthalene A new method is proposed for the atomic absorption
spectrophotometric determination of trace amounts of manganese after separation by adsorption of its complex on microcrystal- line naphthalene. Manganese reacts with 5-chloro-7-iodo- 8-quinolinol to form a water-insoluble complex , which is easily and quantitatively adsorbed at pH range 8.0 to 9.4 on microcrystalline naphthalene at room temperature. The resulting naphthalene mixture is separated from aqueous solution and shaken vigorously with IN nitric acid for 1 min.
Then the solid is separated by filtration using a filter paper in a funnel. Manganese in the aqueous phase is measured at
o
2795A.
1. Introduction
5-chloro-7-iodo-8-quinolinol, being a derivative of oxine (8-quinolinol), forms metal complexes with various metal ions.
It is known that 5-chloro-7-iodo-8-quinolinol reacts with metal ions to produce water-insoluble colored complexes. These
complexes are extracted into chloroform or benzene, and trace metals are determined spectrophptometrically.
Since 1968, we have studied on a new method involving solid- liquid separation after liquid-liquid extraction, and have applied i t to the determination of various metals by naphthalene extraction method. l )-3) The method is based on the formation of metal complex which is extractable quantitatively with molten naphthalene.
The extract is separated from the aqueous solution and dissolved in a suitable organic solvents, the trace amounts of metals being determined spectrophotometrically.
We have developed a new method for the spectrophotometric deter- mination of the trace amounts of metals using microcrystalline naphthalene as an organic coprecipitant. In the present study, 5-chloro-7-iodo-8-quinolinol was chosen as a complexing reagent for the manganese determination and the new method for the determination of trace manganese by atomic absorption spectrophotometry is reported.
2. Experimental method Reagents and apparatus
A stock solution of manganese was prepared by dissolving manganese chloride (analy tical reagent-grade) in distilled water. More dilute solutions were prepared as required by diluting a stock solution.
5-chloro-7-iodo-8-quinolinol solution, 0.2% was prepared by dissolving this reagent in ethanol.
Naphthalene solution, 20% was prepared by dissolving this reagent in acetone.
Buffer solutions of different pH were prepared by mixing 1M
acetic acid and 1M ammonium acetate solution for pH 3-6, or 1M aqueous ammonia and 1M ammonium acetate solution for pH 8-11.
The chemicals used were either chemically pure or reagent-grade materials unless otherwise mentioned.
Deionized water was used.
All absorbance measurements were made with a Perkin-Elmer Model 403 atomic absorption spectrophotometer, with an air-acetylene burner head. A hollow-cathode lamp for manganese was obtained from Perkin- Elmer Ltd.
The measurements of pH were carried out with a Beckman Model G pH meter.
Procedure
Transfer 50-300 ~g of manganese to a 100-ml stoppered Erlenmeyer flask, and dilute with water to about 40 mI. Add 2.5 ml of 0.2% 5-chloro-7-iodo-8-quinolinol solution and adjust pH to 8.5 with 2.0 ml of the acetate buffer solution. Mix the solution well, let stand for 10 min, add 3.0 ml of 20% naphthalene solution and shake vigorously for 1 min. Filter off on a filter paper placed flat on a teflon filter plate in a funnel. Wash the naphthalene with water, and transfer i t to a 100-ml stoppered Erlenmeyer flask.
Add 50 ml of IN nitric acid and shake i t vigorously for 1 min.
Filter off aqueous phase into a 100-ml messflask and dilute to the volume with IN nitric acid. Measure the absorbance of the solution by atomic absorption spectrophotometer.
3. Results and discussion
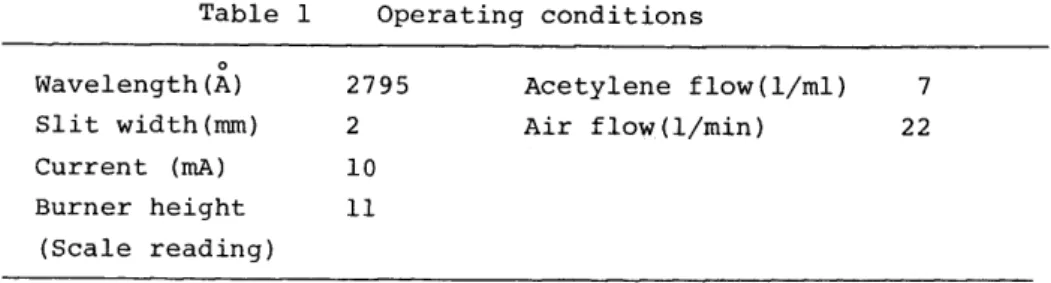
3.1 Operating conditions for atomic absorption measurement All the measurements were carried out with the operating conditions listed in Table 1.
Table 1 Operating conditions
o
Wavelength (A) Slit width(rrun}
2795
2
Current (rnA) 10 Burner height 11
(Scale reading) 3.2 Effect of pH
Acetylene flow(l/ml}
Air flow(l/min}
7 22
After the pH of the sample solutions containing 150 pg of
manganese and 2.5 ml of 0.2% S-chloro-7-iodo-8-quinolinol solution was controlled to 7.0-10 with different buffer solution or IN aqueous arrunonia, the absorbance of the complex was measured according to the procedure. The results are shown in Fig.l. The absorbance of the
w u z <I:
~ o
(/) Cl: a:I
6 1 FIG. I EFFECT OF pH
8 9 IO
pH
MN : 150 PG ; 0.2% 5-CHLORO-l-IODO-8-QUINOLINOL
2.5 ML ; 20% NAPHTHALENE-ACETONE : 3.0 ML SHAKING TIME : I MIN
~ 0.05 z <I:
a:I 0::
o
(/) a:I
<C
o o 1.0 2.0 3.0 4.0
0.2% 5-CHLORO-l-IODO-8-QUINOLINOL, ML FIG. 2 EFFECT OF REAGENT CONCENTRATION MN : 150 pG ; pH ; 20% NAPHTHALENE-ACETONE
3.0 ML ; SHAKING TIME: I MIN
complex starts from pH 7.0, reaches a maximum at 7.9, remains constant over the range 7.9-9.2, and thereafter decreases sharply.
Thus pH of the solution was adjusted to 8.5 for adsorption of the complex.
3.3 Effect of reagent concentration
Various amounts of 0.2% S-chloro-7-iodo-8-quinolinol solution were added to the sample solution containing 150 pg of manganese and 2.0 ml of the buffer solution(pH 8.S}, the procedure being the same as above. Figure 2 shows the variation in the absorbance with the reagent concentration. The absorbance increases with increasing in the amount of reagent up to 2.0 ml of 0.2% solution, becoming almost constant over the range 2.0-4.0 mI. Thus 2.5 ml of 0.2% solution
was added for the further work.
3.4 Effect of addition of buffer solution
The effect of addition of the buffer solution on the absorbance was examined. The addition of 0.5-4.0 ml of the buffer solution was practically no variation in the absorbance. Therefore, 2.0 ml of the buffer solution was used for the adsorption of the complex.
~O.05
<
~ o
In
~
o o
o o
1.0 2.0 3.0 4.0 I M BUFFER SOLUTION, ML
FIG. 3 EFFECT OF ADDITION OF BUFFER SOLUTION MN :150 ~G ; 0.2% S-CHLORO~7-IODO-8-QUINOLINOL
2.0 ML ; pH : 8.5 ; 20% NAPHTHALENE-ACETONE
3.0 ML ; SHAKING TIME : I MIN
::: 0.05 z ~-<C ... --co ... ---<cr)-
<
~ o
In ell
<C
o o
1.0 2.0 3.0 4.020% NAPHTHALENE-ACETONE, ML FIG. 4 EFFECT OF NAPHTHALENE CONCENTRATION MN : 150)JG ; pH : 8.5 ; 0.2% 5-CHLORO-7-IODO- 8-QUINOLINOL : 2.0 ML ; SHAKING TIME: I MIN
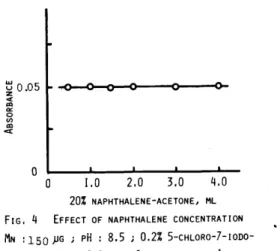
3.5 Effect of naphthalene concentration
The effect of addition of naphthalene on the adsorption was studied, and the result is shown in Fig.4. The complex was completely adsorbed on microcrystalline naphthalene in the range 1.0-4.0 ml of 20% naphthalene solution. Consequently, 3.0 ml of 20%
solution was used as the most suitable amount for the further work.
3.6 Effect of shaking time
Three ml of 20% naphthalene solution was added to the sample solution containing the manganese complex at pH 8.5, and the mixture was vigorously shaken for period of time ranging from 15 to 120 sec.
The experimental data show that the complex is quantitatively
adsorbed on microcrystalline naphthalene by vigorous shaking of this period, as is shown in Fig.5. Therefore, 60 sec shaking time was chosen for the further work.
3.7 Calibration curve
With the optimum conditions described above, a calibration curve for manganese was constructed. It was found to be linear over the concentration range up to 300 pg manganese in 100 ml of aqueous solution. The result is shown in Fig.6. Seven replicate deter-
minations of sample solution containing 150 ~g of manganese showed a relative standard deviation of 2.3%.
3.8 Effect of acid
The adsorbed naphthalene mixture was vigorously shaken with 50 ml of various acids, and nitric acid, hydrochloric acid, sulfuric acid, and their concentrations were tested to dissolve the manganese complex adsorbed on microcrystalline naphthalene. The complex is soluble in these acids. Among these acids, i t was found that IN nitric acid was the most suitable concentration .
~ 0.05
« z
III a::
o en cr III
o o
o ~ 0 a 0
30 60 90 SHAKING TIME, SEC FIG. 5 EFFECT OF SHAKING TIME
120
MN :150 ~G ; pH : 3.5 ; 0.2% 5-CHLORO-7-IODO- 8-QUINOLINOL : 2.0 ML ; 20% NAPHTHALENE-ACETONE
3.0 ML ; BUFFER SOLUTION : 2.0 ML
3.9 Effect of diverse ions ....
u z
« ~ 0.05 o en cr III
o
o 50 100 150 200 250MN, pG/IOO ML AQUEOUS SOLUTION FIG. 6 CALIBRATION CURVE FOR MANGANESE pH : 8.5 ; 0.2% 5-CHLORO-7-IODO-8-QUINOLINOL:
2.0 ML ; 20% NAPHTHALENE-ACETONE: 3.0 ML
The effect of the diverse ions was examined with the solution containing 150 ~g of manganese and various amounts of diverse alkali metal salts. The pH of the solution was adjusted to 8.5. The common alkali salts such as NaCl, Na 2S04 , Na2C03 , CH3COONa, Na2S03 , KBr, KN0
3, sodium tartrate, sodium oxalate, sodium citrate and sodium dihydrogen phosphate even at 100 mg concentration level, have l i t t l e interference on the determination.
References
1) T. Fujinaga, M.Satake and T.Yonekubo, Bunseki Kagaku, 1971, 20, 1225.
2) T.Fujinaga, M.Satake and T.Yonekubo, Talanta, 1972, 19, 689.
3) T.Fujinaga, M.Satake and T.Yonekubo, Bull. Chern. Soc. Jpn., 1973, .!§., 2090.
Part III
Atomic Absorption Spectrophotometric Determination of Cadmium after Adsorption of Its 5-Chloro-7-iodo- 8-quinolinol Complex on Microcrystalline Naphthalene A new atomic absorption spectrophotometric method for the determination of cadmium after adsorption of its 5-chloro- 7-iodo-8-quinolinol complex on microcrystalline naphthalene has been studied. Cadmium in the solution reacts with 5-chloro-7-iodo-8-quinolinol in pH range 6.4-9.5 to form a water-insoluble complex which is easily adsorbed on micro- crystalline naphthalene. The adsorbed naphthalene mixture is separated from aqueous solution, the cadmium complex being dissolved in IN nitric acid by vigorous shaking for 1 min.
This solution showed a linear relationship up to 200 ~g cadmium in 100 ml of aqueous solution. The coefficient of variation for ten determinations of 100 pg cadmium was 1.9%. The effect of experimental variables such as wavelength, pH, amounts of reagent and naphthalene, shaking time and diverse ions have been examined.
1. Introduction
As solvent extraction techniques in atomic absorption spectro- photometry have proved to be a simple and convenient means of selectively extracting and concentrating a desired metals, i t has been extensively employed for the determination of trace metals in steels, alloys, and biological and natural water samples.
The complexing reagents react with various metal ions to form water-insoluble complexes, and these complexes have been used for the determination of metals using organic solvents such as chloroform or benzene as extractant. We have already developed a new method
"analysis of metals by solid-liquid separation after liquid-liquid extraction" and applied i t to the spectrophotometric determination of metals l)-lO)using organic compound with appropriate degree of melting point as extractant, e.g., naphthalene (mp:810C) , biphenyl
(mp:710C), etc. However, because of the time needed to separate and dry the naphthalene phase after extraction, this method takes longer than the ordinary one using extraction directly into chloroform.
Since 1978, we have developed a new method of analysis involving adsorption of metal complexes on naphthalene and subsequent spectro-
photometric determinations, and demonstrated for palladiuml l) and . k 112) . h f . ld . . 13 ) . h . 1 . d . nlC e Wlt a- url lOXlme, copper Wlt ammonlum pyrro 1 lne dithiocarbamate and iron(III)14) with 2-thenoyltrifluoroacetone.
The present communication describes the optimum conditions for an improved procedure for the adsorption of cadmium 5-chloro-7-iodo- 8-quinolinol complex on microcrystalline naphthalene at room temper- ature and subsequent determination of this metal by atomic absorption spectrophotometry after dissolution of naphthalene mixture in N,N- dimethylformamide. The acetone solution of naphthalene upon mixing with aqueous phase yields microcrystalline naphthalene that has excellent adsorption characteristics toward the metal complexes.
This technique is simple, convenient and interesting.
Experimental method Reagents and apparatus
A stock solution of cadmium was prepared from cadmium chloride (analytical reagent-grade) in distilled water. More dilute solution was prepared as required by diluting a stock solution.
5-chloro-7-iodo-8-quinolinol solution, 0.2% was prepared by dissolving this reagent in ethanol.
Naphthalene solution, 20% was prepared by dissolving this reagent in acetone.
Buffer solutions of different pH were prepared by mixing 1M acetic acid and 1M ammonium acetate solution for pH3-6, or 1M aqueous ammonia and 1M ammonium acetate solution for pH8-ll.
The chemicals used were either chemically pure or reagent-grade materials unless otherwise mentioned.
Deionized water was used.
All absorbance measurements were made with a Perkin-Elmer Model 403 atomic absorption spectrophotometer, with an air-acetylene burner head. A hollow-cathode lamp for manganese was obtained from Perkin- Elmer Ltd.
The pH measurements were carried out with a Beckman Model G pH meter.
Procedure
Transfer 25-200pg of cadmium to a 100-ml stoppered Erlenmeyer flask and dilute to 40 ml with water. Add 2.0 ml of 0.2% 5-chloro- 7-iodo-8-quinolinol solution and adjust pH to 8.5 with 2 ml of the buffer solution. Mix the solution well, let stand for 10 min, add
3.0 ml of 20% naphthalene solution and shake vigorously for 1 min.
Filter off on a filter paper placed flat on a teflon filter plate in a funnel. Wash the colored naphthalene mixture with water and transfer to a 100-ml stoppered Erlenmeyer flask. Add 50 ml of IN nitric acid and shake i t vigorously for 1 min. Filter off aqueous phase into a 100-ml messflask and dilute to the volume with lNnitric acid. Measure the absorbance of the solution by atomic absorption spectrophotometer.
Results and discussion.
Operating conditions.
All the absorbance measurements were carried out with the operating conditions listed in Table l~ unless otherwise specified.
Table 1
o
Wavelength (A) Slit width(mm) Current(mA)
Operating conditions 2288
4 8
Acetylene flow(l/ml) Air flow (l/ml) Burner height 11
(Scale reading)
Effect of pH.
7 22
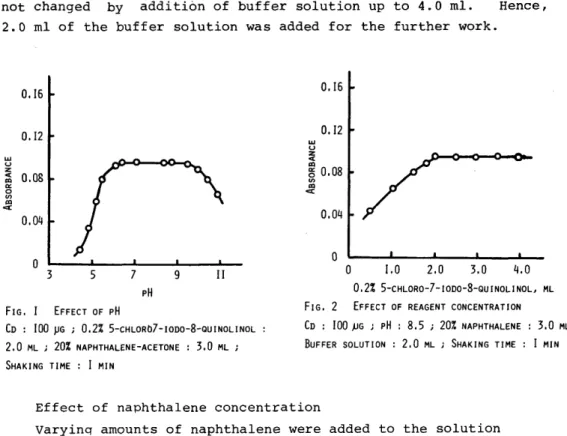
The effect of pH on the absorbance of the complex was investigated with the sample solution containing 100 pg of cadmium and 2.0 ml of 0.2% S-chloro-7-iodo-8-quinolinol solution, and is given in Fig.l.
From Fig.l i t can be seen that the absorbance increases with in- creasing pH, reaches the maximum and constant value in the range 6.7-
9.4. Thereafter the absorbance decreases gradually. Therefore, the pH of the solution was adjusted to 8.5 for the further work.
Effect of reagent concentration.
Varying volume of 0.2% 5-chloro-7-iodo-8-quinolinol solution was added to the solution containing the fix cadmium and buffer solution at pH 8.5. and the variation in the absorbance with the reagent concentration was investigated. The result shown in Fig.2 depict that the absorbance increases with increasing amount of the reagent up to 2.0 ml and then remains unchanged up to 4.0 mI. Hence, 2.5 ml of 0.2% solution was found sufficient for the adsorption.
Effect of addition of buffer solution.
The effect of addition of the buffer solution on the absorbance
was investigated.
not changed by
From the result shown in Fig.3, the absorbance was addition of buffer solution up to 4.0 mI. Hence, 2.0 ml of the buffer solution was added for the further work.
0.16
0.12
UJ u z <: 0.08
IQ 0:: g
c::r IQ
0.04
0
3 5 7 9 II
pH
FIG. I EFFECT OF pH
CD : 100 ~G i 0.2% 5-CHLOR07-IODO-8-QUINOLINOL 2.0 ML i 20% NAPHTHALENE-ACETONE: 3.0 ML i SHAKING TIME : I MIN
0.16
0.12
UJ u z <:
IQ
g
0.08c::r IQ
0.04
0
0 1.0 2.0 3.0 4.0
0.2% 5-CHLORO-7-IODO-8-QUINOLINOL, ML FIG. 2 EFFECT OF REAGENT CONCENTRATION CD : 100 PG i pH : 8.5 i 20% NAPHTHALENE : 3.0 ML BUFFER SOLUTION: 2.0 ML i SHAKING TIME: I MIN
Effect of naphthalene concentration
Varyinq amounts of naphthalene were added to the solution
containing the cadmium complex, and the adsorption of the complex was
0.16
UJ 0.12 z u
<:
CQ - 0 0 0 0 0 0 0---0-
~
0.08<C
0.04
o----~----~--~----~-
o
1.0 2.0 3.0 4.0I M BUFFER SOLUTION, ML
FIG. 3 EFFECT OF ADDITION OF BUFFER SOLUTION CD : IOO pG ; pH : 8.5 i 0'.2% 5-CHLORO-7-IODO- 8-QUINOLINOL : 2.0 ML ; 20% NAPHTHALENE-ACETONE 3.0 ML j SHAKING TIME: I MIN
0.16
0.12
UJ u
z ~ COO 0 ()p
<:
IQ 0.08
0::
0 (I)
c:r CQ
0.04
o o
1.0 2.0 3.0 4.0 20% NAPHTHALENE-ACETONE, ML FIG. 4 EFFECT OF NAPHTHALENE CONCENTRATION CD : 100 PG ; pH : 8.5 ; 0.2% 5-CHLORO-7-IODO- 8-QUINOLINOL : 2.0 ML ; SHAKING TIME : I MINcarried out by the described procedure. The result is shown in Fig.4.
From the experimental result, the addition of 0.5-4.0 ml of 20%
naphthalene acetone solution did not affect the adsorption of the
complex. Hence, 3.0 ml of 20% solution was added as the most suitable amount for the further work.
Effect of shaking time
Three ml of 20% naphthalene solution were added to the solution containing the complex, and the adsorption of the complex on micro- crystalline naphthalene was carried out according to the procedure.
Figure 5 shows the effect of shaking time on the absorbance. No change was seen in the degree of adsorption of the complex when shaking time was varied from 15 to 120 seconds. Therefore, sixty seconds were selected as shaking time for the further work.
0.16
0.12
UJ u z
< ~ 0 0 0-
III 0:: 0.08
0
'"
<C III
0.04
0
0 30 60 90 120
SHAKING TIME, SEC FIG. 5 EFFECT OF SHAKING TIME
CD : 100 PG ; pH : 8.5 ; 0:2% 5-CHLORO-7-IODO- 8-QUINOLINOL : 2.0 ML ; 20% NAPHTHALENE-ACETONE 3.0 ML ; SHAKING TIME : I MIN
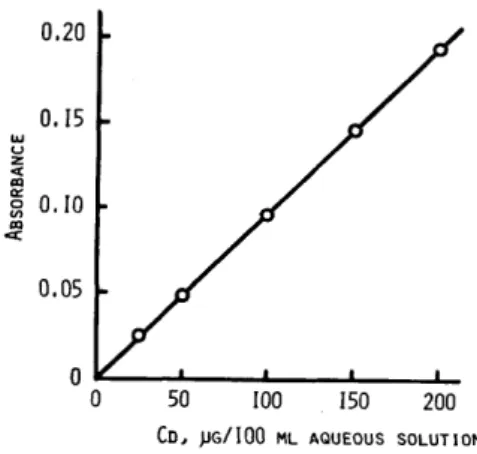
Calibration curve for cadmium.
0.20
O. IS
UJ u Z <
III 0:: 0.10
~
<C III
0.05
CD, pG/IOO ML AQUEOUS SOLUTION FIG. 6 CALIBRATION CURVE FOR CADMIUM
pH : 8.5 ; 0.2% 5-CHLORO-7-IODO-8-QUINOLINOL 2.0 ML ; 20% NAPHTHALENE-ACETONE: 3.0 ML ;
Based on the optimum conditions described above, the absorbance to the various concentration of cadmium was measured. The result is shown in Fig.6. A calibration curve for cadmium obeyed Beer's law in the range up to 200 pg in 100 ml aqueous. A relative standard deviation on seven replicate determinations containing 100 ~g of cadmium was 1.9%.
Effect of acids.
Tests were made with various acids HCl, HN0
3, HCl0 3, CH
3COOH and H2S0
4 to dissolve the cadmium complex adsorbed on microcrystalline naphthalene. Fifty ml of these acids with different concentration was added to the adsorbed naphthalene mixture and shaken vigorously for 1 min. The procedure was followed as is stated above. From the experimental results, IN HN0
3 was proved to be the most suitable concentration to dissolve the complex.
Effect of diverse ions.
Sample solutions containing 100 pg of cadmium and various amounts of diverse alkali metal salts were prepared, the effect of diverse interfering salts on the cadmium determination being studied. The pH of the solution was adjusted to 8.5 and measured after adsorption.
From the results, the following species gave no interference with the determination even at 100 mg concentration level: sodium tartrate, sodium oxalate, sodium citrate, NaH
2P0 4·2H
20, KN0
3, KBr, Na 2S0
3, Na2Co
3, CH3COONa, Na2S0
4 and NaCl.
References
1. T. Fujinaga, T. Kuwamoto, E. Nakayama and M. Satake, Talanta, 1969, ~, 1225.
2. Idem, Bunseki Kagaku, 1969, 18, 398.
3. T. Fujinaga, T. Kuwamoto, T. Yonekubo and M. Satake, Ibid., 1969, 18, 1113.
4. T. Fujinaga, M. Satake and T. Yonekubo, ibid. ,1970, 19, 216.
5. Idem, ibid., 1971, ~, 1255.
6. Idem, Bull. Chern. Soc. Japan, 1973, ~, 2090.
7. Idem, ibid., 1975, ~, 899.
8. Idem, Talanta, 1972, ~, 689.
9. T. Fujinaga, M. Satake and M. Shimizu, Bunseki Kagaku, 1976, 25, 313.
10. M. Satake, Anal. Chim. Acta, 1977, ~, 423.
11. M. Satake, Y. Matsumura, T. Fujinaga and Y. Takagi, Bunseki Kagaku, 1978, ~, 486.
12. M. Satake, Y. Matsumura and T. Fujinaga, Talanta, 1978, ~, 718.
13. T. Fujinaga, Y. Takagi and M. Satake, Bull. Chern. Soc. Japan, 1979, ~, 2556.
14. M. Satake, Y. Matsumura and Mool C. Mehra, Mikrochimica Acta, 1980