Title Slow fluctuation of Rac1 activity is associated with biologicaland transcriptional heterogeneity of glioma cells( Dissertation_全文 )
Author(s) Yukinaga, Hiroko
Citation Kyoto University (京都大学)
Issue Date 2014-05-23
URL http://dx.doi.org/10.14989/doctor.k18455
Right
許諾条件により本文は2015-02-14に公開; This dissertation is author version of following the journal article. Hiroko Yukinaga, Clara Shionyu, Eishu Hirata, Kumiko Ui-Tei, Takeshi Nagashima, Shinji Kondo, Mariko Okada-Hatakeyama, Honda Naoki, and Michiyuki Matsuda
Fluctuation of Rac1 activity is associated with the phenotypic and transcriptional heterogeneity of glioma cells J Cell Sci 2014 127:1805-1815; Advance Online Article February 12, 2014, doi:10.1242/jcs.139733
Type Thesis or Dissertation
Textversion ETD
平成26年 発行 Journal of Cell Science 掲載予定 主論文
Research Article 1
2
Slow fluctuation of Rac1 activity is associated with biological and transcriptional 3
heterogeneity of glioma cells 4
5
H. Yukinaga1, C. Shionyu2, E. Hirata2, K. Ui-Tei3, T. Nagashima4,6, S. Kondo4, M.
6
Okada-Hatakeyama5, H. Naoki7, M. Matsuda1,2,8*
7 8
1
Department of Pathology and Biology of Diseases, Graduate School of Medicine, Kyoto
9
University, Kyoto, Japan, 2Laboratory of Bioimaging and Cell Signaling, Graduate School of
10
Biostudies, Kyoto University, Kyoto, Japan, 3Department of Biophysics and Biochemistry,
11
Graduate School of Science, University of Tokyo, Tokyo, Japan, 4Research Unit for
12
Immunodynamics, RIKEN Research Center for Allergy and Immunology, Yokohama, Japan,
13 5
Laboratory for Cellular Systems Modeling, RIKEN Research Center for Allergy and
14
Immunology, Yokohama, Japan, 6Division of Cell Proliferation, United Centers for
15
Advanced Research and Translational Medicine, Tohoku University Graduate School of
16
Medicine, 7Imaging Platform for Spatio-Temporal Information, Graduate School of
17
Medicine, Kyoto University, 8Institute for Integrated Cell-Material Sciences, Kyoto
18
University, Japan.
19 20
*To whom correspondence should be addressed.
21
Mailing address: Department of Pathology and Biology of Diseases, Graduate School of
22
Medicine, Kyoto University, Kyoto, Yoshida-Konoe-Cho, Sakyo-ku, Kyoto 606-8501,
23 Kyoto, Japan 24 Tel: 81-75-753-4421 25 FAX: 81-75-753-4655 26 E-mail: [email protected] 27 28
Running title: Heterogeneity by fluctuation of Rac1 activity
29
Keywords: Rac1/Invasion/Heterogeneity/
2 Summary
1
Phenotypic heterogeneity of cancer cells is caused not only by genetic and epigenetic
2
alterations, but also by stochastic variation of intracellular signaling molecules. Using cells
3
that stably express Förster resonance energy transfer (FRET) biosensors, we here show
4
correlation of Rac1 activity fluctuation with invasive property of C6 glioma cells. By
5
long-term time-lapse imaging Rac1 activity in C6 glioma cells was found to fluctuate with a
6
timescale significantly longer than the replication cycle. Because the level of Rac1 activity
7
in each cell was robust to suspension-adhesion procedure, C6 glioma cells were sorted by
8
Rac1 activity, yielding Rac1high and Rac1low cells. The Rac1high cells invaded more efficiently
9
than did Rac1low cells in the Matrigel invasion assay. Among the top 14 membrane-related
10
genes enriched in Rac1high cells, four genes were associated with glioma invasion and Rac1
11
activity as examined by siRNA knockdown experiments. Among transcription factors
12
enriched in Rac1high cells, Egr2 was found to positively regulate expression of the four
13
membrane-related invasion-associated genes. The identified signaling network may cause
14
the slow fluctuation of Rac1 activity and heterogeneity in invading capacity of glioma cells.
15 16
Introduction 17
Cancer cells originated from a single cell acquire phenotypic heterogeneity due to genomic
18
instability or heritable epigenetic changes (Lengauer et al., 1998; Shackleton et al., 2009).
19
This heterogeneity is of great advantage for the cancer progression and guarantees its
20
insidious, highly invasive nature in tissues (Heppner, 1984; Rubin, 1990; Shackleton et al.,
21
2009). Recently, however, it has also been reported that the fate and behavior of mammalian
22
cells, including cancer cells, can be determined by stochastic gene expression variation
23
(Brock et al., 2009). For example, patterns of signaling heterogeneity in monoclonal cancer
24
cells can generate diverse phenotypes with different drug sensitivities (Singh et al., 2010).
25
A typical example of cancers that exhibit extensive heterogeneity is glioblastoma,
26
which was previously termed glioblastoma “multiforme,” reflecting its histopathological
27
divergence in size, shape, karyotype, etc. (Louis, 2006). Among the many experimental
28
models of glioblastoma, the C6 glioma cell model has been frequently used to study
29
invasiveness of glioblastoma cells (Grobben et al., 2002). The C6 glioma cells implanted
30
into syngeneic Wistar rats share many histological hallmarks with human glioblastoma and
31
preferentially migrate along neuronal fibers and through the perivascular space, a pattern
32
which resembles the spread of human glioblastoma.
33
Rho-family GTPases regulate cytoskeletal dynamics and thereby affect many cellular
34
processes, including cell polarity, migration, vesicle trafficking and cytokinesis
35
(Etienne-Manneville and Hall, 2002). In cancer cells, Rho-family GTPases play critical roles
36
in manifesting the cancer cell-specific behavior (Sahai and Marshall, 2002). Rac1, for
3
example, accelerates tumorigenesis by regulating apoptosis, cell cycle progression, assembly
1
and disassembly of tight junction and adherens junction, cell migration, and cell invasion
2
(Mack et al., 2011). Importantly, these pleiotropic functions of Rho-family GTPases have
3
been characterized by comparing cancer cells with non-cancer cells. Meanwhile, little is
4
known about the heterogeneity and fluctuation of Rho-family GTPase activity within the
5
cancer cell population.
6
Sorting cells with respect to a property of interest is essential to study the
7
heterogeneity of cancer cells by genetic, epigenetic, biochemical, or cell biological analyses.
8
Cell surface markers and cognitive antibodies have been routinely used for this purpose, but
9
the methods used to sort cells depending on the intracellular activity of a signaling molecule
10
are limited. Biosensors based on the principle of Förster resonance energy transfer (FRET)
11
have been widely used to monitor the activity of the signaling molecules (Kiyokawa et al.,
12
2006; Miyawaki, 2011); however, due to a lack of methods for the stable expression of the
13
FRET biosensors, cell sorting with FRET biosensor-expressing cells has been a difficult
14
task.
15
Recently, we developed methods to express FRET biosensors stably in cell lines and
16
transgenic mice (Kamioka et al., 2012; Komatsu et al., 2011). With C6 rat glioma cells stably
17
expressing a FRET biosensor for Rac1, we found that C6 glioma cells penetrating the brain
18
parenchyma showed higher Rac1 and Cdc42 activities and lower RhoA activity than those
19
advancing in the perivascular regions (Hirata et al., 2012). This observation urged us to
20
investigate the mechanism by which the heterogeneity of Rho-family GTPase activity is
21
generated, and the role of the heterogeneity in the invasion of glioma cells. For this purpose,
22
we established a method to sort cells with respect to their levels of Rho-family GTPase
23
activity. Then, by using next-generation sequencers, we identified genes whose expressions
24
were correlated with Rac1 activity. Using this approach, we here show that slow fluctuation
25
of Rac1 activity is associated with the heterogeneity of glioma invasion.
26 27
Results 28
Distribution of Rac1 activity among C6 glioma cells 29
We have shown that C6 glioma cells invading at the periphery of a tumor mass in the rat
30
brain or a 3D spheroid exhibit higher Rac1 activity than those trailing such leader cells
31
(Hirata et al., 2012). We speculated that such distribution of Rac1 activity among C6 glioma
32
cells may be autonomously generated during cell growth and spreading. To test this idea, we
33
prepared C6 glioma cells that stably express a FRET biosensor, Raichu-Rac1, and visualized
34
Rac1 activity on glass-bottom dishes (Fig. 1A). We detected significant variation in Rac1
4
activity, which exhibited a typical normal distribution (Fig. 1B, C). Correlation between the
1
Rac1 activity and the expression level of the biosensor was not observed (Fig. 1D)
2 3
Fluctuation and Robustness of Rac1 activity 4
The normal distribution of Rac1 activity probably reflected the noise of the system (Brock
5
et al., 2009). To study the mechanism underlying the generation of the noise, we time-lapse
6
imaged Rac1 activity in C6 glioma cells for 5 days (Fig. 2A, Movie S1). C6 glioma cells
7
expressing Raichu-Rac1 were seeded onto a glass-bottom dish having 282-m-diameter
8
spot, which prevented cells from straying out from the visual field. To maintain cell density
9
within the optimal range for cell growth, the Raichu-Rac1-expressing cells were
10
co-cultured with parental C6 glioma cells. We chose spots having a single
11
biosensor-expressing cell and one to several parental C6 cells for the tracking. Rac1
12
activity was averaged over the entire cell area and plotted against time (Fig. 2B). Except for
13
the rapid decline and increment during cell division, Rac1 activity exhibited fluctuation
14
with timescales longer than the cell cycle (>40 hours). Consequently, after 5 days, when the
15
single cells proliferated to 6 to 8 cells, Rac1 activity varied significantly among the
16
daughter cells (Supplementary Fig. S1A). Analysis with power spectrum did not reveal any
17
periodicity of Rac1 activity fluctuation (Fig. 2C). Of note, Rac1 activity did not
18
significantly change before and after cell division, suggesting that the level of Rac1 activity
19
was maintained by a mechanism that is robust to cell division (Fig. 2D). The range of Rac1
20
activity after 5 days (Fig. 2B) was similar to the range of Rac1 activity observed for the cell
21
population (Fig. 1C). Therefore, we concluded that the distribution of Rac1 activity was
22
generated primarily by the slow fluctuation with timescales longer than the cell cycle. To
23
understand the biological significance of the observed distribution of Rac1 activity, we
24
examined the correlation between the cell area and Rac1 activity (Fig. 2E), and found a
25
weak positive correlation. The positive, albeit weak, correlation between cell area and Rac1
26
activity probably reflects the high level of Rac1 activity in lamellipodia (Itoh et al., 2002;
27
Kraynov et al., 2000). We also examined the velocity of migration (Fig. 2E), but could not
28
observe any clear correlation with Rac1 activity.
29
Next, to examine the robustness of the level of Rac1 activity, we detached the cells
30
by trypsin, and then induced cell adhesion by trypsin inhibition in situ (Fig. 2F).
31
Trypsinization induced cell rounding and decreased Rac1 activity. Following trypsin
32
inhibition induced cell adhesion and restored the Rac1 activity. Notably, the relative Rac1
33
activity of each cell did not change before, during, and after trypsinization (Fig. 2F). This
34
observation agrees with the previous report that the suspension of adherent cells reduces
35
Rac1 activity (del Pozo et al., 2000), and also suggests that the level of Rac1 activity in
5
each cell is maintained by a robust mechanism, which is not affected by the
1
suspension-adhesion procedure.
2 3
FRET-based cell sorting to select Rac1high and Rac1low populations 4
To understand the mechanisms underlying and roles played by the slow fluctuation and
5
robustness of Rac1 activity, we attempted to examine the transcriptomes of C6 glioma cells
6
with different levels of Rac1 activity. Encouraged by the observation that the
7
suspension-adhesion procedure did not alter the relative Rac1 activity of each cell, we
8
sorted C6 glioma cells depending on Rac1 activity with FACS. The FRET/CFP ratio was
9
used as the index of FRET efficiency as in microscopy. The FRET/CFP ratio was
10
independent of the expression level of the biosensor (Fig. 3A) as observed in 2D condition
11
(Fig. 1D). C6 glioma cells in the highest and lowest decile with respect to the FRET/CFP
12
ratio were named the Rac1high and Rac1low populations, respectively, and sorted (Fig. 3B).
13
There was a serious concern about whether the Rac1 activity monitored by the
14
FRET/CFP ratio in FACS reflected the Rac1 activity of cells grown on the culture dishes,
15
because Rac1 activity is closely associated with cell attachment (del Pozo et al., 2000). In
16
Fig. 2F, we showed that suspension-adhesion procedure did not alter the relative Rac1
17
activity of each cell among the cell population. Here, we quantified GTP bound to the
18
endogenous Rac1 by pulldown assay. The amount of GTP-Rac1 in Rac1high cells was larger
19
than that in Rac1low cells (Fig. 3C). Furthermore, we directly measured the GTP/GDP ratio
20
by TLC after cell sorting. Both Rac1high and Rac1low cells were plated on the culture dishes
21
and labeled with 32Pi for 2 hours, followed by TLC analysis to measure the GTP/GDP ratio 22
on the biosensor (Fig. 3D). Although the difference in the GTP/GDP ratio between Rac1high
23
and Rac1low was smaller than the difference between wild-type and GTPase-deficient
24
mutant Rac1 proteins, the GTP/GDP ratio of Rac1high cells was constantly higher than that
25
of Rac1low cells, providing a biochemical validation of the FRET-based cell sorting. In
26
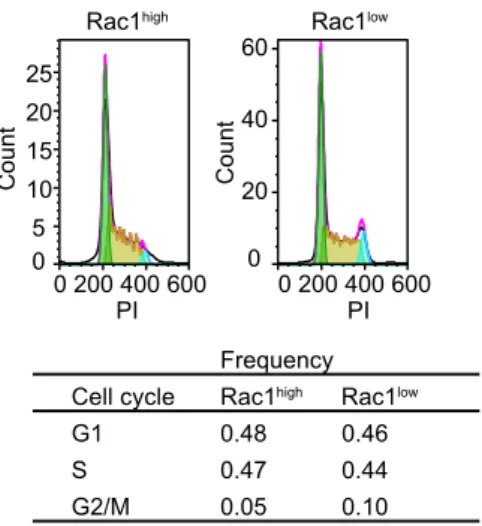
addition, we found that cells in G2/M phases were enriched in Rac1low cell (Supplementary
27
Fig. S1B), which agrees with the observation that Rac1 activity transiently dropped during
28
cell division (Fig. 2B).
29
We then examined the invasion of Rac1high and Rac1low cells into Matrigel by
30
Boyden chamber assay. Cells that had reached the lower side of filter were counted after 22
31
hours. Although the efficiency of invasion varied in each experiment, we constantly
32
observed that Rac1high cells invaded into Matrigel significantly faster than did Rac1low cells
33
(Fig. 3E). This observation agrees with the findings of our previous 3D spheroid assay that
34
cells with higher Rac1 activity invaded into Matrigel at the front and guided cells with
35
lower Rac1 activity (Fig. 1B) (Hirata et al., 2012).
6
Finally, to confirm our hypothesis that the distribution of Rac1 activity was caused
1
by slow fluctuations, the Rac1high and Rac1low cells were cultured for up to nine days and
2
re-analyzed by FACS. On the first day, the distribution of Rac1 activities within the sorted
3
populations remained discrete, but after one week the distribution of Rac1 activity within
4
each population was identical, supporting our hypothesis (Fig. 3F). We performed similar
5
experiments with C6 glioma cells expressing a FRET biosensor for Cdc42. In agreement
6
with the previous finding that the glioma cells invading at the front exhibit high Rac1
7
activity and high Cdc42 activity (Hirata et al., 2012), a similar result was obtained with
8
Cdc42high and Cdc42low cells (Fig. 3F). Furthermore, we retrogradely analyzed long-term
9
time-lapse images (Supplementary Fig. S1C), and found that, in agreement with the FACS
10
data, cells in the highest and lowest decile with respect to the FRET/CFP ratio were
11
merging in fifty hours.
12 13
Transcriptional signatures of Rac1high and Rac1low cells 14
To investigate the association of the Rac1 activity variation with transcriptional signatures,
15
RNA-Seq analysis was performed with C6 glioma cells sorted by FACS. mRNA was
16
isolated from the Rac1high and Rac1low populations of C6 glioma cells and sequenced. The
17
expression difference of Rac1high/Rac1low was plotted against average expression (Fig. 4A).
18
Similar analysis was performed for Cdc42 and RhoA to characterize the nature of the
19
Rac1high and Rac1low populations (Fig. 4B). The difference in the expression of
20
Rac1high/Rac1low was positively correlated with that of Cdc42high/Cdc42low. But there was
21
no correlation between the expression differences of Rac1high/Rac1low and
22
RhoAhigh/RhoAlow or those of Cdc42high/Cdc42low and RhoAhigh/RhoAlow. Again, this is in
23
agreement with our previous observation that both Rac1 and Cdc42 activities were high in
24
cells migrating at the front of glioma cells in rat brains and in 3D Matrigel (Hirata et al.,
25
2012). For identification of differentially expressed genes, we used the weighted average
26
difference method (WAD). The WAD method identified 713 differentially expressed genes
27
using a cutoff of the top 5% of ranked genes. Gene ontology analysis based on biological
28
process terms showed that the Rac1high phenotype is associated with the GPCR protein
29
signaling pathway, cell-matrix adhesion, and electron transport chain in that order (Fig. 4C).
30
The Rac1low phenotype is associated with cell division, cell cycle, and mitosis terms. In
31
addition, analysis with cellular component terms showed that genes related to the
32
respiratory chain, focal adhesion, and mitochondrial respiratory chain complex I, were
33
enriched in the Rac1high population, and that genes related to the cytoplasm, nucleus, and
34
integral to membrane were enriched in Rac1low population (Fig. 4D).
35 36
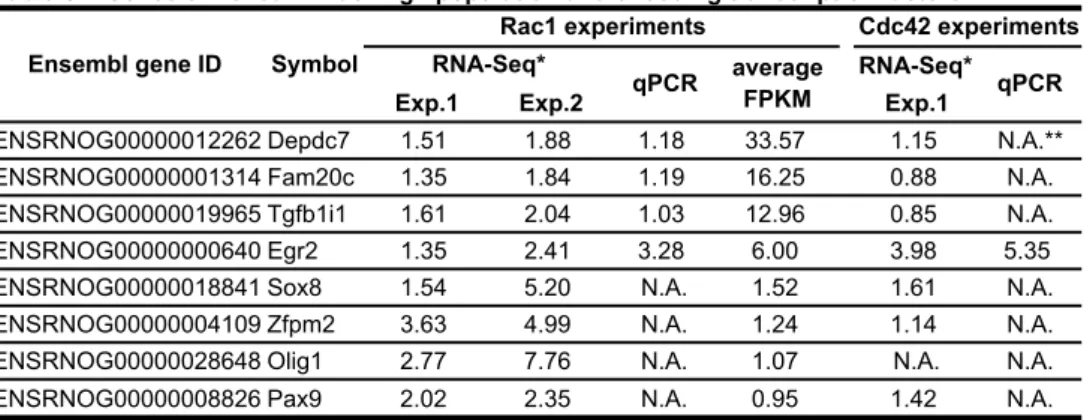
Identification of genes that regulate C6 glioma cell invasion 37
7
Based on the RNA-Seq data, we attempted to identify genes that regulate glioma invasion.
1
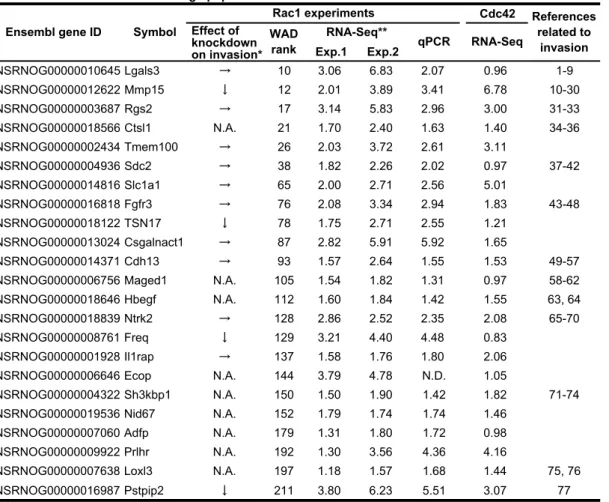
For this purpose, we focused on the top 23 up-regulated genes related to cell component
2
term “membrane” (Table S1). Notably, 18 genes out of the 23 genes were up-regulated in
3
Cdc42high cells in comparison to Cdc42low cells, strongly suggesting that a large part of
4
Rac1high cells are overlapped with Cdc42high cells. Before starting detailed characterization
5
of the membrane-related genes enriched in Rac1high cells, the difference in gene expression
6
between Rac1high cells and Rac1low cells was confirmed by qPCR, except for Ecop, to
7
which we failed to prepare specific primers. Next, we knocked-down top 10 genes with
8
three different siRNAs, except for cathepsin L1 (ctsl1), against which we failed to prepare
9
three effective siRNAs. From the remaining 12 genes, we arbitrarily chose and
10
knocked-down Ntrk2, Freq, Il1rap, and Pstpip2. C6 glioma cells were then examined for
11
their invasive potential by the Matrigel invasion assay. Among the 14 membrane-related
12
genes, knockdown of MMP15, TSN17, Pstpip2, and Freq, which we call membrane-related
13
invasion-associated genes, significantly inhibited C6 glioma cell invasion (Fig. 5A). Except
14
for MMP15, knockdown of the membrane-related invasion-associated genes suppressed
15
Rac1 activity, suggesting thatTSN17, Pstpip2, and Freq promoted invasion via Rac1
16
activation (Fig. 5B). Knockdown of membrane-related but invasion-irrelevant genes,
17
Lgals3 and Rgs2, did not affect Rac1 activity. Notably, knockdown of TSN17 and Freq,
18
but not Pstpip2, caused rounding of the cell shape (Fig. 5C). These two genes may be
19
associated with Rac1-mediated membrane protrusion.
20
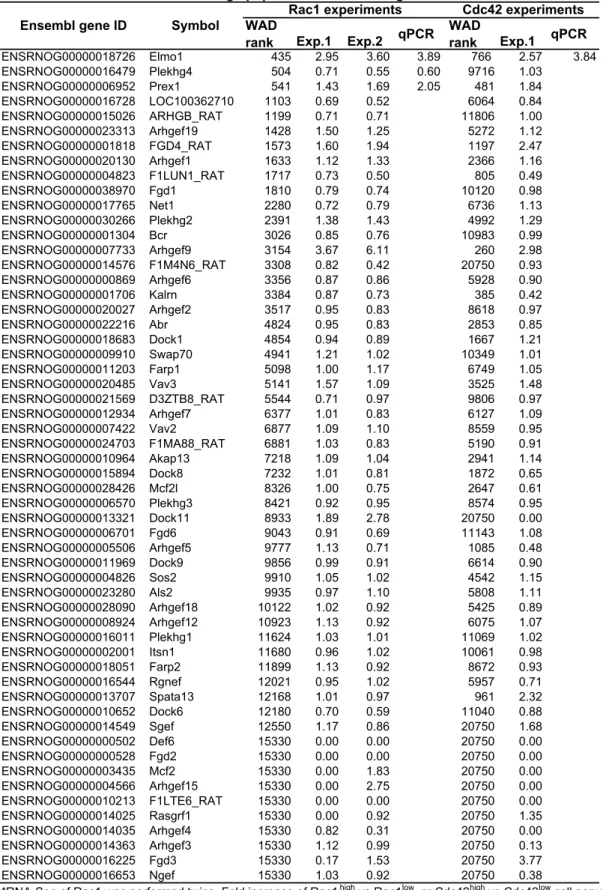
We next sought for transcription factors enriched in Rac1high cells (Table S2), and
21
found that Egr2 was reproducibly enriched in Rac1high cells and Cdc42high cells. Similarly,
22
we identified Elmo1 and PRex1 as Rac1 activators enriched in Rac1high cells (Table S3).
23
Knockdown of Egr2 and Elmo1, but not PRex1, suppressed C6 cell invasion and decreased
24
Rac1 activity (Fig. 5D, E). Unlike the knockdown of membrane-related genes, TSN17 and
25
Freq, knockdown of Egr2 or Elmo1 decreased Rac1 activity without affecting the cell
26
shape (Fig. 5F).
27
Thus, we identified genes of four membrane-related proteins, a transcriptional
28
factor, and a Rac1 activator as invasion-associated genes enriched in Rac1high cells. Notably,
29
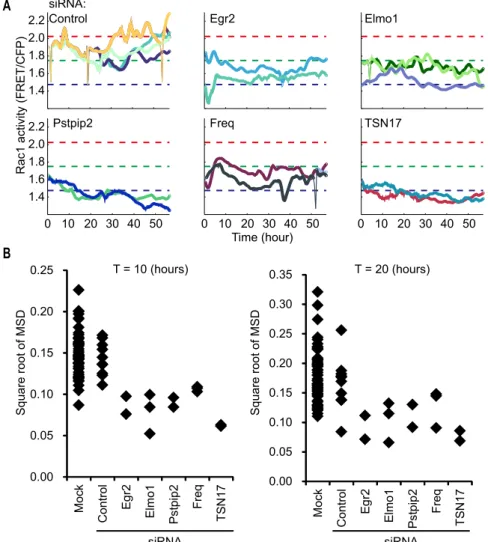
knockdown of Egr2, Elmo1, Pstpip2, Freq, and TSN17 not only decreased the average
30
Rac1 activity but also suppressed the fluctuation of Rac1 activity (Supplementary Fig. S2),
31
implying that the fluctuation of Rac1 activity may be associated with the basal level of
32
Rac1 activity.
33 34
Hierarchy of the invasion-associated genes enriched in Rac1high cells 35
To untangle the signaling network of the invasion-associated genes enriched in Rac1high
36
cells, we first transiently activated Rac1 by rapamycin-induced Rac1 activation system
8
(Yagi et al., 2012). Upon rapamycin-induced membrane translocation of Tiam1, a GEF for
1
Rac1, Rac1 activation was clearly detected by both FACS (Fig. 6A) and pulldown assay
2
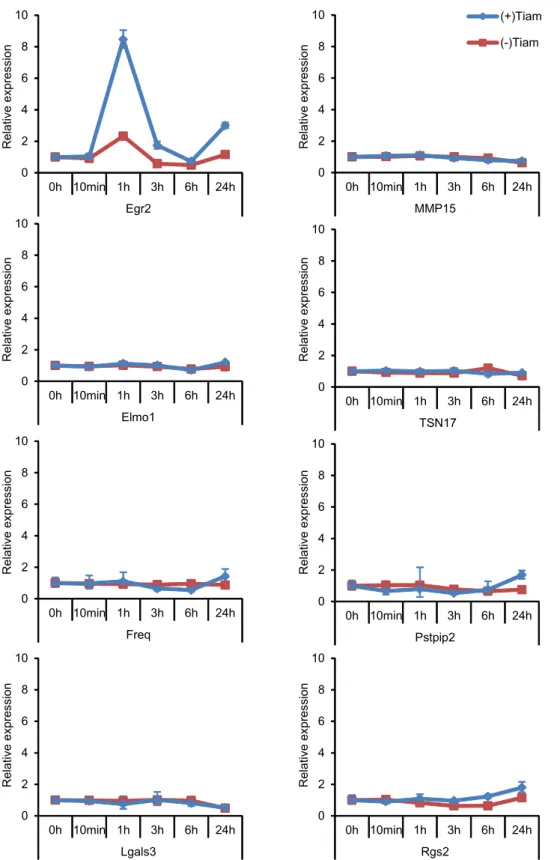
(Fig. 6B). Among the genes tested, only Egr2 was significantly induced rapidly and
3
transiently (Supplementary Fig. S3). We next knocked down each gene and quantified the
4
expression of the other invasion-associated genes by qPCR (Supplementary Fig. S4). The
5
comprehensive knockdown experiments revealed intriguing features of the signaling
6
network that regulates Rac1 activity (Fig. 6C). First, the membrane-related
7
invasion-associated genes, Pstpip2, TSN17, Freq, and MMP15, could be clustered by the
8
response to the knockdown of the other genes. Second and more importantly, we could
9
infer the hierarchy of the genes by assuming that the knockdown of a gene decreases the
10
expression of the downstream genes and increases the expression of the upstream gene(s)
11
by a negative feedback loop. For example, Egr2 knockdown decreased expression of all
12
four membrane-related invasion-associated genes, but not an invasion-irrelevant gene,
13
Rgs2, or Elmo1. On the other hand, knockdown of the membrane-related
14
invasion-associated genes increased Egr2 expression, suggesting the presence of negative
15
feedback loops to Egr2. Because the effect of Egr2 knockdown on the expression of
16
Pstpip2 was not significant, this gene may be placed in a different signaling pathway. From
17
these data, we suggest a model of the gene network that regulates Rac1 activity and
18
invasion of C6 glioma cells (Fig. 6D).
19 20
Discussion 21
The phenotypic heterogeneity of cancer cell populations is caused by genetic, epigenetic,
22
and non-genetic mechanisms. The non-genetic mechanism that causes the variation of gene
23
expression includes transcriptional and translational noises (Brock et al., 2009). Although
24
the precise nature of such noise remains largely elusive, we can speculate that the gene
25
expression variation would reflect the intracellular signaling activities. Here we established
26
a technology to sort the cells depending on the activities of intracellular signaling
27
molecules and to examine the effect of the activity variation of signaling molecules on the
28
biological or transcriptional heterogeneity of cancer cells.
29 30
FRET-based cell sorting 31
The technology is based on two assumptions. First, the activity of the molecule of interest
32
is maintained during FACS. Second, the transcriptome is not significantly perturbed during
33
FACS. We had a serious concern as to whether the process of cell preparation, i.e.,
34
trypsinization and suspension of adherent C6 glioma cells, might mask the intercellular
35
variation in the activities of Rho-family GTPases that are observed both under 2D and 3D
9
conditions. In fact, it has been established that the suspension of adherent cells reduces
1
their Rac1 activity (del Pozo et al., 2000). Contrary to our expectation, however, the
2
intercellular variation in Rac1 activity was reproduced after the cell preparation. Reanalysis
3
of Rac1 activity by FACS, TLC, or pulldown assay demonstrated that Rac1 activity was
4
conserved in both the Rac1high and Rac1low cell populations (Fig. 3A, B). Time-lapse
5
imaging confirmed that the relative Rac1 activity of each cell was maintained before and
6
after cell division or suspension-adhesion procedure (Fig. 2D). These observations imply
7
that the Rac1 activity in a single cell consists of basal and external cue-dependent Rac1
8
activities. The external cue includes integrin, growth factors, etc., and rapidly changes Rac1
9
activity upon input of the cues (Heasman and Ridley, 2008). Meanwhile, the basal Rac1
10
activity is determined by intrinsic signaling status, which is robust to external cues and is
11
subjected to fluctuation with longer timescales.
12
The second assumption that needs further consideration is the effect of cell sorting
13
on the transcriptome. The ontology analysis of genes enriched in Rac1high cells showed
14
close correlation to biological process terms that are linked to the function of Rac1 (Fig.
15
4C). The first and second scores went to the GPCR pathway and cell-matrix adhesion. Both
16
of these are related to cell migration, with which the functions of Rac1 are most often
17
associated (Sahai and Marshall, 2002; Sander and Collard, 1999). Another major function
18
of Rac1 is the regulation of NADH-mediated production of reactive oxygen species
19
(Heasman and Ridley, 2008); therefore, it is not surprising that the electron transport chain
20
was scored at the third position. Furthermore, in agreement with the finding that Rac1
21
activity drops rapidly during cell division (Yoshizaki et al., 2003), the first to third scores
22
of genes enriched in Rac1low cells went to the pathways of cell division, cell cycle, and
23
mitosis (Fig. 4C). Furthermore, among the 23 genes up-regulated in the Rac1high population
24
and classified under the cell component term “membrane”, 13 genes are known to be
25
involved in cancer cell invasion (Table S1). These observations support our assumption
26
that the transcriptional profiles are reasonably conserved during FACS.
27 28
Genes associated with the Rac1high phenotype 29
Among the 14 genes classified under the cell component term “membrane” and enriched in
30
Rac1high cells, knockdown of 4 genes inhibited C6 glioma cell invasion in the Matrigel
31
invasion assay. Previous reports have indicated or suggested that proteins encoded by the
32
four genes are more or less associated with invasion of cancer cells. MMP15, matrix
33
metaloprotease protein 15 of MT2-MMP, is expressed predominantly in glioblastoma
34
(Lampert et al., 1998; Nakada et al., 1999), suggesting that MMP15 may play a major role
35
in the degradation of extracellular matrix during glioma invasion. TSN17, tetraspanin 17,
36
was recently shown to regulate ADAM10, which has been shown to be involved in cancer
10
progression (Dornier et al., 2012; Haining et al., 2012; Mochizuki and Okada, 2007).
1
Pstpip2 regulates F-actin bundling and enhances filopodia (Chitu et al., 2005), which
2
strongly argues for a role of this protein in glioma invasion. Freq is a calcium-binding
3
protein expressed predominantly in neuronal cells (Dason et al., 2012; Nakamura et al.,
4
2006). In primary cultured adult cortical neurons, overexpression of NCS1 induces neurite
5
sprouting; however, the role of NCS-1 in glioma invasion has not been determined.
6
Genes responsive to the activation of Rac1 or Cdc42 have been identified by
7
overexpressing constitutively active QL mutants of Rac1 or Cdc42 in NIH 3T3 cells
8
(Teramoto et al., 2003). There are some similarities between this previous work and our
9
present study. First, the expression profile of Rac1QL-expressing cells resembles that of
10
Cdc42QL-expressing cells in the previous studies. We also found that the expression
11
profile of Rac1high cells resembles that of Cdc42high cells (Fig. 4B, Table S1). Second, in
12
cells expressing Rac1QL or Cdc42QL, genes related to the extracellular matrix and cell
13
adhesion are enriched and genes related to the cell cycle are suppressed as in Rac1high cells
14
(Fig. 4C). However, there are also some discrepancies. For example, collagen alpha 1 chain
15
precursor was 3.1-fold enriched in Rac1QL-expressing cells, but was 0.56-fold suppressed
16
in Rac1high cells. This difference may have been caused by the lack of GTPase activity in
17
Rac1QL mutant, because the cycling between the GDP-bound and GTP-bound forms has
18
been shown to play an important role in cell migration (Parrini et al., 2011). In another
19
study, different levels of Rac1 were expressed in colorectal cancer cells to identify the
20
target genes of Rac1 by microarray analysis (Gomez et al., 2007). However, we could not
21
find any similarity to our data. In another study, C6 rat glioma cells were selected both in
22
vitro and in vivo for high and low migratory phenotypes (Tatenhorst et al., 2005). By
23
microarray analysis, thirty-one genes were found to be differentially expressed in
24
association with migratory phenotypes. We could not detect a significant resemblance
25
between the gene expression profiles of this study and our present findings. Thus, the
26
constitutive activation (or suppression) and intrinsic fluctuation of Rac1 activity might
27
cause different transcriptional phenotypes. Alternatively, the effect of Rac1 on
28
transcriptional profiles might be cell-type specific. In any event, different approaches led to
29
the identification of various genes related to glioma invasion. Further analyses will be
30
required to find the cause of such divergence.
31 32
Hierarchy of invasion-associated genes enriched in Rac1high population 33
The comprehensive knockdown experiments strongly argued for the role of Egr2 as a
34
master regulator of C6 glioma invasion. Knockdown of Egr2 suppressed the expression of
35
the four membrane-related invasion-associated genes. In contrast, knockdown of the four
36
membrane-related invasion-associated genes or Elmo1 increased the expression of Egr2,
11
implying negative feedback loops from the invasion phenotype to Egr2 expression.
1
Microarray analyses have revealed enrichment of Egr2 in metastatic squamous cell
2
carcinomas (Kim et al., 2006; Liu et al., 2008). Furthermore, in fibroblasts infected with
3
Kaposi sarcoma-associated herpesvirus, Egr2 induces MMPs and Extracellular Matrix
4
MetalloPRoteinase INducer (emmprin) (Dai et al., 2012). These observations strongly
5
argue for the proposal that Egr2 is a key regulator of glioma invasion.
6 7
Origin of the heterogeneity of Rac1 activity 8
What causes the heterogeneity of Rac1 activity among C6 glioma cells? The five-day
9
time-lapse image revealed that the distribution of Rac1 activity was caused by non-genetic
10
slow fluctuation with time scales of more than 40 hours (Fig. 2A). This conclusion was also
11
supported by the observation that the isolated Rac1high or Rac1low cell population restored
12
the original distribution within one week (Fig. 3F, Supplementary Fig. S1C). Notably, our
13
conclusion agrees with the variation of protein levels in human H1299 lung carcinoma cells
14
(Sigal et al., 2006), in which the expression levels of proteins have been shown to fluctuate
15
with a timescale of more than 40 hours. By the knockdown experiments against genes
16
enriched in Rac1high population, we identified a gene network regulating Rac1 activity (Fig.
17
6D). This network comprises both positive and negative feedback loops, which are
18
sufficient to cause oscillation of a signaling network. Although we have not been able to
19
confirm that the variation in Rac1 activity in vivo is also driven by the same mechanism,
20
slow fluctuations of gene expression, and resulting fluctuation of Rac1 activity could
21
generate glioma cells with different levels of invading capacity.
22 23
Materials and Methods 24
Biosensors and cell lines 25
C6 rat glioma cells were obtained from American Type Culture Collection and cultured in
26
DMEM containing 10% FBS. The FRET biosensors for Rac1, Cdc42, and RhoA,
27
Raichu-Rac1, Raichu-Cdc42, and Raichu-RhoA, respectively, were described previously
28
(Itoh et al., 2002; Yoshizaki et al., 2003). For the establishment of stable cell lines
29
expressing Raichu biosensors, we took two approaches. First, we replaced CFP with teal
30
fluorescent protein (TFP) and delivered the expression cassettes by a retroviral vector into
31
C6 glioma cells as described previously (Hirata et al., 2012). More recently, piggyBac
32
transposon-mediated gene transfer was used to stably express Raichu biosensors with
33
higher sensitivity (Komatsu et al., 2011; Yusa et al., 2009) . The cells were single-cell
34
cloned before further experiments unless described otherwise.
35 36
12 Time-lapse FRET imaging
1
FRET images were obtained and processed using essentially the same conditions and
2
procedures as previously reported (Aoki and Matsuda, 2009). Cells were plated on 35
3
mm-diameter glass-bottom dishes (AGC Techno Glass, Shizuoka, Japan) or
4
micro-patterned glass-bottom dishes (CytoGraph; Dai Nippon Printing Co., Tokyo, Japan).
5
Cells were imaged at 37oC in 5% CO2 with an inverted microscope (IX81; Olympus, 6
Tokyo, Japan) equipped with a x40 objective lens (UAPO/NA 1.35; Olympus), a x40
7
objective lens (UPLSAPO/NA 0.95; Olympus), and a x60 objective lens (PlanApoPH/NA
8
1.40; Olympus), a cooled CCD camera (Cool SNAP-HQ or Cool SNAP-K4; Roper
9
Scientific, Tucson, AZ), an LED illumination system (CoolLED precisExcite; Molecular
10
Devices, Sunnyvale, CA), an IX2-ZDC laser-based autofocusing system (Olympus) and an
11
MD-XY30100T-Meta automatically programmable XY stage (SIGMA KOKI, Tokyo,
12
Japan). The following filters used for the dual emission imaging studies were obtained
13
from Omega Optical (Brattleboro, VT): an XF1071 (440AF21) excitation filter, an XF2034
14
(455DRLP) dichroic mirror, and two emission filters, XF3075 (480AF30) for CFP and
15
XF3079 (535AF26) for yellow fluorescent protein (YFP). After background subtraction,
16
FRET/CFP ratio images were created with MetaMorph software (Universal Imaging, West
17
Chester, PA), and represented by intensity-modulated display mode. In the
18
intensity-modulated display mode, eight colors from red to blue are used to represent the
19
FRET/CFP ratio, with the intensity of each color indicating the mean intensity of FRET
20
and CFP. For the quantification, the FRET and CFP intensities were averaged over the
21
whole cell area, and the results were exported to Excel software (Microsoft Corporation,
22
Redmond, WA).
23 24
FRET-based Cell Sorting 25
C6 glioma cells expressing Raichu-Rac1 were trypsinized, resuspended in PBS containing
26
3% FBS, and analyzed and/or sorted with a FACSAria (Becton Dickinson, Franklin Lakes,
27
NJ). We used the following combinations of lasers and emission filters for the detection of
28
fluorescence from the biosensor: for the donor fluorescence of TFP and CFP, a 407 nm
29
laser and a 480AF30 filter (Omega Optical); for the sensitized FRET from YFP, a 407 nm
30
laser and a 535AF26 filter (Omega Optical); and for the acceptor fluorescence of YFP, a
31
475 nm laser and a 535AF26 filter (Omega Optical). Cells were first gated for size and
32
granularity to exclude cell debris and aggregates. For cell sorting, C6 glioma cells in the
33
highest and lowest decile with respect to the FRET/CFP (or TFP) ratios were sorted as
34
Rac1high and Rac1low populations, respectively, into DMEM containing 10% FBS. Small
35
fractions of Rac1high and Rac1low were reanalyzed for validation and the remaining cells
36
were snap-frozen and stored at -80°C until RNA extraction. Detailed data analysis was
37
performed using FlowJo. 7.6 software (Tree Star Inc., Ashland, OR).
13 1
TLC of guanine nucleotides bound to GTPases 2
Guanine nucleotides bound to Raichu biosensors or GFP-tagged Rac1 proteins were
3
quantified essentially as described previously (Gotoh et al., 1995). Briefly, cells were sorted
4
by FACS and plated on 6-well dishes. After 3 hours, cells were metabolically labeled with
5 32
Pi for 2 hours and lysed with lysis buffer. The cell lysates were clarified by centrifugation 6
and used to immunoprecipitate Raichu biosensors or GFP-tagged Rac1 with an anti-GFP
7
antiserum and Protein-A Sepharose. Guanine nucleotides bound to the immuoprecipitates
8
were separated by TLC and quantitated with a BAS-1000 image analyzer.
9 10
Rac1 pulldown analysis 11
Rac1 pulldown assay was performed according to the manufacturer’s protocol (Cytoskelton,
12
Inc, Denver, CO).
13 14
RNA extraction 15
Total RNA was isolated with a Qiagen RNeasy Micro Kit (Qiagen, Hilden, Germany) or a
16
Qiagen RNeasy Mini Kit, according to the manufacturer’s protocol. RNA preparations
17
were confirmed to be free of proteins using a NanoDrop ND-1000 instrument (Thermo
18
Fisher Scientific Inc., Waltham, MA), and the integrity of these measurements was
19
confirmed using a 2100 BioAnalyzer (Agilent Technologies, South Queensferry, UK).
20
RNA that had an RNA integrity Number (RIN) ≥ 8.6 was used for RNA-Seq.
21 22
Library preparation and sequencing 23
Total RNA was poly(A)-selected using poly(T) Dynabeads (Invitrogen, San Diego, CA).
24
Sequencing libraries were prepared according to Illumina's mRNA-Seq protocol and
25
sequenced at the Omics Science Center (OSC) RIKEN Yokohama Institute. Two
26
independent libraries were analyzed for each data set. Sequence-read data have been
27
submitted to the Sequence Read Archive at DDBJ (submission No. DRA000605).
28 29
Mapping and processing of RNA-Seq reads 30
The reads of each dataset were aligned to the rat reference genome (rn4, Nov. 2004,
31
version 3.4) using TopHat v1.3.0 (Trapnell et al., 2009). The resulting sequence
32
alignment/map files in the BAM format were analyzed with Cufflinks version 0.8.0
33
(Trapnell et al., 2010) to compute fragments per kilobase of transcript per million mapped
34
reads (FPKM). Genomic annotations were obtained from Ensembl in gene transfer format
35
(GTF). We used only reads mapped to 20 or fewer sites on the genome. The WAD method
36
(Kadota et al., 2008) was then performed on the data of pairs of cells to generate expression
37
differences. Differentially expressed genes were filtered for a WAD ranking cutoff of the
14
top 5.0%. Gene Ontology (GO) annotations were used to assign biological functions to
1
genes included in this study (Ashburner et al., 2000).
2 3
3D Matrigel invasion assay 4
3D Matrigel invasion assay was performed with a BD BioCoat Matrigel Invasion Chamber
5
(Becton Drive, Franklin Lakes, NJ) according to the manufacturer’s protocol. Briefly, 2 x
6
104 cells were seeded on the membrane with or without Matrigel precoating. After 22 hours,
7
cells were fixed, stained for nuclei with propidium iodide, and imaged with an
8
epifluorescence microscope. The number of nuclei was counted with MetaMorph software
9
(Universal Imaging). Data is expressed as the percent invasion through the Matrigel Matrix
10
and membrane relative to the migration through the control membrane.
11 12
3D spheroid imaging 13
Organotypic culture was prepared as described previously (Gaggioli et al., 2007). In a
14
12-well plate coated with poly-(2-hydroxyethyl methacrylate) (Sigma, St. Louis, MO) and
15
containing 1 ml serum-free CO2-independent medium (Invitrogen), 106 cells were cultured 16
overnight with slow agitation to form small aggregates. The aggregates were embedded in
17
6 mg/ml Matrigel, maintained in complete medium and observed under a two-photon
18
microscope or a confocal microscope for up to 18 hours in an incubation chamber.
19 20
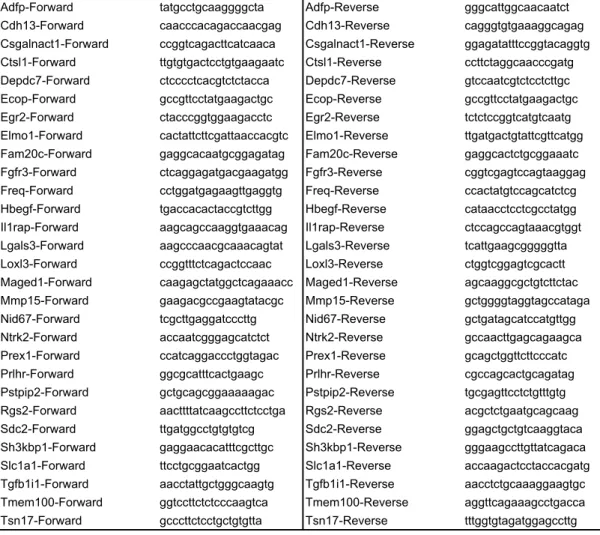
Quantitative RT-PCR 21
RNA was reverse-transcribed by a High Capacity cDNA Reverse Transcription kit
22
(Applied Biosystems, Foster City, CA) according to the manufacturer’s protocol. Then, the
23
expression levels of each gene and GAPDH used as a standard were analyzed by Power
24
SYBR Green PCR Master Mix (Applied Biosystems) with ABI PRISM7300 Sequence
25
Detection System (Applied Biosystems). The sequences of primers used for qPCR are
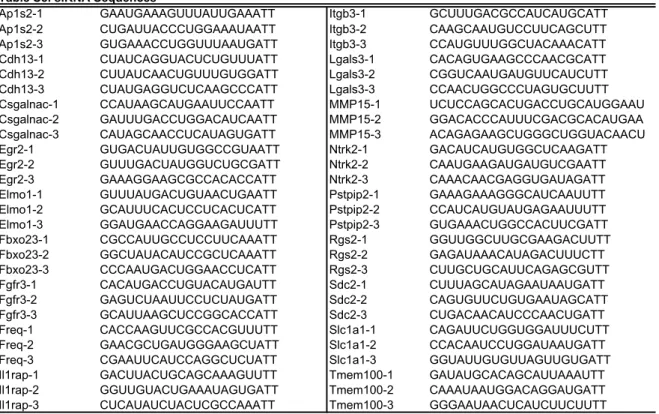
26 shown in Table S4. 27 28 siRNA-Knockdown experiments 29
Stealth RNAi Negative Control Duplex and Stealth RNAi against MMP15 were purchased
30
from Invitrogen. Mission siRNAs against the other genes were purchased from
31
Sigma-Aldrich (St. Louis, MO). C6 cells stably expressing Raichu-Rac1 were transfected
32
with 20 μM siRNA by Lipofectamine 2000 (Invitrogen). Two days after transfection,
33
cells were used for invasion assay, qPCR, or FRET imaging. The siRNA sequences are
34
shown in Table S5.
35 36
Rapamycin-induced Rac1 activation 37
15
Rapamycin-induced Rac1 activation with FKBP-Tiam1 was reported previously (Yagi et
1 al., 2012). 2 3 Supplementary Materials 4
Figure S1. (A) Rac1 activity of a single C6 glioma cell and its daughter cells traced for five
5
days. (B) Enrichment of cells in G2/M phases in Rac1low cell populations. (C) Time-lapse
6
analyses of Rac1high and Rac1low cells.
7
Figure S2. Suppression of Rac1 activity fluctuation by the knockdown of genes enriched in
8
the Rac1high cells.
9
Figure S3. Effect of Rac1 activation on the expression of invasion-associated genes.
10
Figure S4. Effect of knockdown of the invasion-associated genes on the expression of the
11
other genes.
12
Table S1. Genes enriched in Rac1high population and related to "membrane".
13
Table S2. Transcription factors enriched in Rac1high population.
14
Table S3. Rac1 activators enriched in Rac1high population.
15
Table S4. Primer sequences used for qPCR.
16
Table S5. siRNA sequences.
17
Movie S1. Slow fluctuation of Rac1 activity during 5-day time-lapse imaging.
18 19
Acknowledgments 20
We thank A. Miyawaki, T. Akagi, J. Miyazaki, K. Yusa, and H. Niwa for the plasmids. Y.
21
Inaoka, K. Hirano, Y. Naruo, K. Takakura and A. Kawagishi are also to be thanked for their
22
technical assistance. We thank F. Hori at Omics Science Center, RIKEN Yokohama Institute
23
and N. Fujii, K Ikeo, and N. Monma at Cell Innovation Project Data Analysis Center,
24
National Institute of Genetics for the sequencing and data analyses. We are grateful to the
25
members of the Matsuda Laboratory for their helpful discussions. MM was supported by the
26
Research Program of Innovative Cell Biology by Innovative Technology (Cell Innovation)
27
from the Ministry of Education, Culture, Sports, and Science (MEXT), Japan. HY was
28
supported by the Global COE Program "Center for Frontier Medicine" and by a Grant-in-Aid
29
for JSPS Fellows by MEXT, Japan.
30 31
References 32
Aoki, K. and Matsuda, M. (2009). Visualization of small GTPase activity with fluorescence
33
resonance energy transfer-based biosensors. Nat. Protoc. 4, 1623-1631.
16
Ashburner, M., Ball, C. A., Blake, J. A., Botstein, D., Butler, H., Cherry, J. M., Davis, A. P.,
1
Dolinski, K., Dwight, S. S., Eppig, J. T. et al. (2000). Gene ontology: tool for the
2
unification of biology. The Gene Ontology Consortium. Nat. Genet. 25, 25-29.
3
Brock, A., Chang, H. and Huang, S. (2009). Non-genetic heterogeneity--a
4
mutation-independent driving force for the somatic evolution of tumours. Nat.Rev.Genet.
5
10, 336-342.
6
Chitu, V., Pixley, F. J., Macaluso, F., Larson, D. R., Condeelis, J., Yeung, Y. G. and Stanley, E.
7
R. (2005). The PCH family member MAYP/PSTPIP2 directly regulates F-actin bundling
8
and enhances filopodia formation and motility in macrophages. Mol.Biol.Cell 16,
9
2947-2959.
10
Dai, L., Qin, Z., Defee, M., Toole, B. P., Kirkwood, K. L. and Parsons, C. (2012). Kaposi
11
sarcoma-associated herpesvirus (KSHV) induces a functional tumor-associated
12
phenotype for oral fibroblasts. Cancer Lett. 318, 214-20.
13
Dason, J. S., Romero-Pozuelo, J., Atwood, H. L. and Ferrus, A. (2012). Multiple roles for
14
Frequenin/NCS-1 in synaptic function and development. Mol.Neurobiol. 45, 388-402.
15
del Pozo, M. A., Price, L. S., Alderson, N. B., Ren, X. D. and Schwartz, M. A. (2000).
16
Adhesion to the extracellular matrix regulates the coupling of the small GTPase Rac to its
17
effector PAK. EMBO J. 19, 2008-2014.
18
Dornier, E., Coumailleau, F., Ottavi, J. F., Moretti, J., Boucheix, C., Mauduit, P.,
19
Schweisguth, F. and Rubinstein, E. (2012). TspanC8 tetraspanins regulate
20
ADAM10/Kuzbanian trafficking and promote Notch activation in flies and mammals. J.
21
Cell Biol. 199, 481-96.
22
Etienne-Manneville, S. and Hall, A. (2002). Rho GTPases in cell biology. Nature (London)
23
420, 629-635.
24
Gaggioli, C., Hooper, S., Hidalgo-Carcedo, C., Grosse, R., Marshall, J. F., Harrington, K.
25
and Sahai, E. (2007). Fibroblast-led collective invasion of carcinoma cells with differing
26
roles for RhoGTPases in leading and following cells. Nat.Cell Biol. 9, 1392-1400.
27
Gomez, d. P., Bandres, E., Espina, C., Valdes-Mora, F., Perez-Palacios, R., Garcia-Amigot, F.,
28
Garcia-Foncillas, J. and Lacal, J. C. (2007). Differential expression of Rac1 identifies its
29
target genes and its contribution to progression of colorectal cancer. Int.J Biochem.Cell
30
Biol. 39, 2289-2302.
31
Gotoh, T., Hattori, S., Nakamura, S., Kitayama, H., Noda, M., Takai, Y., Kaibuchi, K.,
32
Matsui, H., Hatase, O., Takahashi, H. et al. (1995). Identification of Rap1 as a target for
33
Crk SH3 domain-binding guanine nucleotide-releasing factor, C3G. Mol. Cell Biol. 15,
34
6746-6753.
35
Grobben, B., De Deyn, P. P. and Slegers, H. (2002). Rat C6 glioma as experimental model
36
system for the study of glioblastoma growth and invasion. Cell Tissue Res. 310, 257-270.
17
Haining, E. J., Yang, J., Bailey, R. L., Khan, K., Collier, R., Tsai, S., Watson, S. P., Frampton,
1
J., Garcia, P. and Tomlinson, M. G. (2012). The TspanC8 subgroup of tetraspanins
2
interacts with A disintegrin and metalloprotease 10 (ADAM10) and regulates its
3
maturation and cell surface expression. J. Biol. Chem. 287, 39753-65.
4
Heasman, S. J. and Ridley, A. J. (2008). Mammalian Rho GTPases: new insights into their
5
functions from in vivo studies. Nat Rev.Mol.Cell Biol. 9, 690-701.
6
Heppner, G. H. (1984). Tumor heterogeneity. Cancer Res. 44, 2259-2265.
7
Hirata, E., Yukinaga, H., Kamioka, Y., Arakawa, Y., Miyamoto, S., Okada, T., Sahai, E. and
8
Matsuda, M. (2012). In vivo fluorescence resonance energy transfer imaging reveals
9
differential activation of Rho-family GTPases in glioblastoma cell invasion J. Cell Sci.
10
125, 858-868.
11
Itoh, R. E., Kurokawa, K., Ohba, Y., Yoshizaki, H., Mochizuki, N. and Matsuda, M. (2002).
12
Activation of Rac and Cdc42 video-imaged by FRET-based single-molecule probes in the
13
membrane of living cells. Mol. Cell Biol. 22, 6582-6591.
14
Kadota, K., Nakai, Y. and Shimizu, K. (2008). A weighted average difference method for
15
detecting differentially expressed genes from microarray data. Algorithms.Mol.Biol. 3, 8.
16
Kamioka, Y., Sumiyama, K., Mizuno, R., Sakai, Y., Hirata, E., Kiyokawa, E. and Matsuda,
17
M. (2012). Live imaging of protein kinase activities in transgenic mice expressing FRET
18
biosensors. Cell Struct. Funct. 37, 65-73.
19
Kim, D. H., Muto, M., Kuwahara, Y., Nakanishi, Y., Watanabe, H., Aoyagi, K., Ogawa, K.,
20
Yoshida, T. and Sasaki, H. (2006). Array-based comparative genomic hybridization of
21
circulating esophageal tumor cells. Oncol. Rep. 16, 1053-9.
22
Kiyokawa, E., Hara, S., Nakamura, T. and Matsuda, M. (2006). Fluorescence (Forster)
23
resonance energy transfer imaging of oncogene activity in living cells. Cancer Sci. 97,
24
8-15.
25
Komatsu, N., Aoki, K., Yamada, M., Yukinaga, H., Fujita, Y., Kamioka, Y. and Matsuda, M.
26
(2011). Development of an optimized backbone of FRET biosensors for kinases and
27
GTPases. Mol. Biol. Cell 22, 4647-4656.
28
Kraynov, V. S., Chamberlain, C., Bokoch, G. M., Schwartz, M. A., Slabaugh, S. and Hahn, K.
29
M. (2000). Localized rac activation dynamics visualized in living cells. Science 290,
30
333-337.
31
Lampert, K., Machein, U., Machein, M. R., Conca, W., Peter, H. H. and Volk, B. (1998).
32
Expression of matrix metalloproteinases and their tissue inhibitors in human brain tumors.
33
Am.J Pathol. 153, 429-437.
34
Lengauer, C., Kinzler, K. W. and Vogelstein, B. (1998). Genetic instabilities in human
35
cancers. Nature (London) 396, 643-649.
18
Liu, C. J., Liu, T. Y., Kuo, L. T., Cheng, H. W., Chu, T. H., Chang, K. W. and Lin, S. C.
1
(2008). Differential gene expression signature between primary and metastatic head and
2
neck squamous cell carcinoma. J. Pathol. 214, 489-97.
3
Louis, D. N. (2006). Molecular pathology of malignant gliomas. Annu.Rev.Pathol. 1,
4
97-117.
5
Mack, N. A., Whalley, H. J., Castillo-Lluva, S. and Malliri, A. (2011). The diverse roles of
6
Rac signaling in tumorigenesis. Cell Cycle 10, 1571-1581.
7
Miyawaki, A. (2011). Development of probes for cellular functions using fluorescent
8
proteins and fluorescence resonance energy transfer. Annu.Rev.Biochem. 80, 357-373.
9
Mochizuki, S. and Okada, Y. (2007). ADAMs in cancer cell proliferation and progression.
10
Cancer Sci. 98, 621-8.
11
Nakada, M., Nakamura, H., Ikeda, E., Fujimoto, N., Yamashita, J., Sato, H., Seiki, M. and
12
Okada, Y. (1999). Expression and tissue localization of membrane-type 1, 2, and 3 matrix
13
metalloproteinases in human astrocytic tumors. Am.J Pathol. 154, 417-428.
14
Nakamura, T. Y., Jeromin, A., Smith, G., Kurushima, H., Koga, H., Nakabeppu, Y.,
15
Wakabayashi, S. and Nabekura, J. (2006). Novel role of neuronal Ca2+ sensor-1 as a
16
survival factor up-regulated in injured neurons. J. Cell Biol. 172, 1081-1091.
17
Parrini, M. C., Sadou-Dubourgnoux, A., Aoki, K., Kunida, K., Biondini, M., Hatzoglou, A.,
18
Poullet, P., Formstecher, E., Yeaman, C., Matsuda, M. et al. (2011). SH3BP1, an
19
exocyst-associated RhoGAP, inactivates Rac1 at the front to drive cell motility. Mol. Cell
20
42, 650-661.
21
Rubin, H. (1990). The significance of biological heterogeneity. Cancer Metastasis Rev. 9,
22
1-20.
23
Sahai, E. and Marshall, C. J. (2002). Rho GTPases and Cancer. Nat.Rev.Cancer 2, 133-142.
24
Sander, E. E. and Collard, J. G. (1999). Rho-like GTPases: their role in epithelial cell-cell
25
adhesion and invasion. Eur.J.Cancer 35, 1905-1911.
26
Shackleton, M., Quintana, E., Fearon, E. R. and Morrison, S. J. (2009). Heterogeneity in
27
cancer: cancer stem cells versus clonal evolution. Cell 138, 822-829.
28
Sigal, A., Milo, R., Cohen, A., Geva-Zatorsky, N., Klein, Y., Liron, Y., Rosenfeld, N., Danon,
29
T., Perzov, N. and Alon, U. (2006). Variability and memory of protein levels in human
30
cells. Nature (London) 444, 643-646.
31
Singh, D. K., Ku, C. J., Wichaidit, C., Steininger, R. J., III, Wu, L. F. and Altschuler, S. J.
32
(2010). Patterns of basal signaling heterogeneity can distinguish cellular populations with
33
different drug sensitivities. Mol.Syst.Biol. 6, 369.
34
Tatenhorst, L., Puttmann, S., Senner, V. and Paulus, W. (2005). Genes associated with fast
35
glioma cell migration in vitro and in vivo. Brain Pathol. 15, 46-54.
19
Teramoto, H., Malek, R. L., Behbahani, B., Castellone, M. D., Lee, N. H. and Gutkind, J. S.
1
(2003). Identification of H-Ras, RhoA, Rac1 and Cdc42 responsive genes. Oncogene 22,
2
2689-2697.
3
Trapnell, C., Pachter, L. and Salzberg, S. L. (2009). TopHat: discovering splice junctions
4
with RNA-Seq. Bioinformatics. 25, 1105-1111.
5
Trapnell, C., Williams, B. A., Pertea, G., Mortazavi, A., Kwan, G., van Baren, M. J., Salzberg,
6
S. L., Wold, B. J. and Pachter, L. (2010). Transcript assembly and quantification by
7
RNA-Seq reveals unannotated transcripts and isoform switching during cell
8
differentiation. Nat Biotechnol. 28, 511-515.
9
Yagi, S., Matsuda, M. and Kiyokawa, E. (2012). Suppression of Rac1 activity at the apical
10
membrane of MDCK cells is essential for cyst structure maintenance. EMBO Rep. 13,
11
237-243.
12
Yoshizaki, H., Ohba, Y., Kurokawa, K., Itoh, R. E., Nakamura, T., Mochizuki, N.,
13
Nagashima, K. and Matsuda, M. (2003). Activity of Rho-family GTPases during cell
14
division as visualized with FRET-based probes. J. Cell Biol. 162, 223-232.
15
Yusa, K., Rad, R., Takeda, J. and Bradley, A. (2009). Generation of transgene-free induced
16
pluripotent mouse stem cells by the piggyBac transposon. Nat.Methods 6, 363-369.
17 18 19
20 Figure Legends
1
Fig. 1. Activity variation of Rac1. (A) Schematic view of the Raichu-Rac1 FRET biosensor. 2
(B) C6 glioma cells that stably expressed Raichu-Rac1 were grown on glass-bottom dishes
3
and imaged to visualize the FRET/CFP ratio in the intensity-display mode with the
4
FRET/CFP ratio ranges as indicated in the figures. Bar, 200 m. (C) The FRET/CFP ratio
5
averaged for each cell in (B) is shown in the histogram, which could be normal distribution
6
(p=0.92, Kolmogorov-Smirnov test and p=0.3, Shapiro-Wilk normality test). Analyses were
7
performed by R(R Ver 2.12.1). (D) The FRET/CFP ratio and YFP intensity in each cell are
8
plotted to show the independence of the Rac1 activity from the concentration of the
9
biosensor.
10 11
Fig. 2. Fluctuation and Robustness of Rac1 activity. (A) C6 glioma cells expressing 12
Raichu-Rac1 were plated on glass-bottom dishes with parent C6 glioma cells, which served
13
as feeder cells at a low cell density. Cells were time-lapse imaged for 5 days
14
(Supplementary Movie 1). Representative snap shots of FRET/CFP images and DIC
15
images overlaid with FRET/CFP image are shown. (B) The time course of a single cell and
16
its derivatives after smoothing by the Savitzky-Golay filter, except for the mitosis phase,
17
during which period a surge of Rac1 activity was observed (asterisks and thin lines). The
18
color of each arrow is used to depict each newborn cell. The data are also shown in
19
Supplementary Fig. S1. (C) Power spectrum of Rac1 activity. Blue and red lines indicate
20
normalized power spectra of analyzed cells (N = 58) and the average, respectively. (D)
21
Correlation of Rac1 activities before and after cell division. (E) Scatter plots show the
22
relationship between Rac1 activity and the cell area and velocity of cells. (F) C6 glioma
23
cells expressing Raichu-Rac1 in serum-free media were time-lapse-imaged. During the
24
imaging, 1.25% Trypsin was added at 0.5 h. At 0.75 h, FBS was added to inactivate Trypsin.
25
Bars, 20 m.
26 27
Fig. 3. Isolation of Rac1high and Rac1low cell populations by FACS. (A) C6 glioma cells
28
expressing Raichu-Rac1 were analyzed by FACS. The Rac1 activity (FRET/CFP) did not
29
correlate with the FRET biosensor concentration (YFP) in each cell. (B) The top and
30
bottom 10% of cells were sorted to obtain Rac1high (red) and Rac1low (blue) populations.
31
Small fractions of Rac1high and Rac1low cells were reanalyzed after sorting. (C) Rac1high and
32
Rac1low cells were collected and analyzed by pulldown assay. Cells expressing
33
CFP-Rac1V12 and CFP-Rac1N17 were used as positive and negative controls, respectively.
34
(D) Rac1high and Rac1low cells were plated on dishes and cultured for 3 hours. Cells were
35
labeled with 32Pi for 2 hours, lysed, and immunoprecipitated with an anti-GFP antibody, 36
followed by TLC to quantify GTP and GDP bound to the FRET biosensor. . (E) Rac1high
37
and Rac1low cells were used for the Matrigel invasion assay. (F) Rac1high, Rac1low cells,
21
Cdc42high, and Cdc42low cells were plated on dishes and cultured for the indicated periods
1
and re-analyzed by FACS.
2 3
Fig. 4. RNA-Seq analysis of Rac1high and Rac1low cell populations. (A) poly(A)-selected
4
RNA was isolated from Rac1high and Rac1low cell populations and used for RNA-Seq
5
analysis. The relationship between average expression [log2(Rac1high×Rac1low) / 2] and
6
expression difference of Rac1high vs Rac1low [log2(Rac1high/Rac1low)] is shown in the M-A
7
plot. The WAD method identified 713 differentially expressed genes using cutoffs of the
8
top 5% ranked genes. Cell populations enriched in Rac1high and Rac1low cells are depicted
9
with pink and blue dots, respectively. The top 14 genes for the cellular component term
10
“membrane” are marked in orange, except for Pstpip2, Freq/NCS-1, MMP15, and Tsn17,
11
which are shown with red dots. Elmo1 and Egr2 are shown in green dots. (B) RNA-Seq
12
analysis was similarly performed for the Cdc42high, Cdc42low, RhoAhigh, and RhoAlow cell
13
populations. Scatter plots of the expression differences are shown. (C and D) Gene ontology
14
analysis with biological process terms (C) or cellular component terms (D) is shown. The
15
p-value was calculated by Pearson product-moment correlation coefficients.
16 17
Fig. 5. Effect of knockdown of genes enriched in the Rac1high cell population on invasion
18
and Rac1 activity. (A) For the top 14 genes enriched in the cellular component term
19
“membrane”, three siRNAs for each gene were prepared and used to knockdown the target
20
genes in C6 glioma cells. Cells were used for invasion analysis as described in the text. The
21
results of two independent experiments are included. *P<0.05, **P<0.01 and ***P<0.001.
22
P-value was calculated by two-tailed paired t-test. (B) Four genes associated with invasion
23
phenotype in (A) and Lgals3 and Rgs2 used as controls were knocked down and
24
FRET/CFP ratio values were quantified for each C6 glioma cells. Numbers of cells
25
analyzed are shown at the bottom. (C) Representative snap shots of FRET/CFP images of
26
C6 glioma cells transfected with the siRNAs. Bars, 100 μm. (D, E, F) Effect of knockdown
27
of Egr2, Elmo1, and PRex1 was also examined as in (A), (B), and (C). Bars, 100 μm.
28 29
Fig. 6. Identification of a signaling network comprising the genes enriched in the Rac1high 30
cell population and associated with invasion. (A, B) C6 glioma cells expressing
31
Raichu-Rac1 alone or Raichu-Rac1, plasma membrane-targeted
32
Lyn-FKBP12-rapamycin-binding domain (LDR) and FK506-binding protein (FKBP) fused
33
with Tiam1 were stimulated with (solid line) 10 M rapamycin or the solvent DMSO
34
(dashed line) for 30 min. Rac1 activity was examined with FACSAria (A) or by pulldown
35
assay (B). C6 glioma cells expressing CFP-Rac1N17 and CFP-Rac1V12 were used as
36
negative and positive controls, respectively. White and black arrows indicate CFP-Rac1 and
37
endogenous Rac1, respectively. Densitometry for GTP-bound Rac1 was normalized to the
22
amount of the total Rac1.(C) Genes listed in the left column were knocked down as in Fig.
1
5 or Rac1 was activated as in (A). mRNAs purified from the cells were used for qPCR
2
analysis for the genes in the top row. Fold changes to the control siRNA-transfected cells
3
are shown in the log(2) scale. The genes were clustered by nearest neighbor method. Data
4
on invasion and Rac1 activity shown in Fig. 5 are also included. (D) A proposed model of
5
Rac1 activity regulation in C6 glioma cells.
6 7
A B C D Rac1 PAK 475nm 433nm YFP GDP CFP GEFs GAPs 530nm GTP YFP CFP 433nm Active form Inactive form Rac1 Activity (FRET/CFP) Cell number 0 20 40 60 80 1.5 1.9 2.3 2.7 Rac1 activity (FRET/CFP) 2.5 1.7 40 80 120 160YFP intensity
Rac1 activity (FRET/CFP) 1.6
2.0 2.4
A E R² = 0.17 1.5 1.7 1.9 2.1 2.3 2.5 0 2000 4000
Rac1 activity (FRET/CFP)
Are 2) R² = 0.01 1.5 1.7 1.9 2.1 2.3 2.5 0 50 100
Rac1 activity (FRET/CFP)
Velocit 1.4 1.6 1.8 2 2.2 2.4
Rac1 activity (FRET/CFP)
0 24 48 72 96 120 0 24 48 72 96 120 0 0.25 0.5 0.75 1 3 5 0 0.25 0.5 0.75 1 3 5 FBS F
Rac1 activity (FRET/CFP)
0 20 40 60 80 100 120 1.6 1.8 2.0 2.3 2.4 2.6 B C D
*
*
*
*
*
*
*
(FRET/CFP) (FRET/CFP) R = 0.68 2.5 2.3 2.1 1.9 1.8 2.0 2.2 2.4 -1) 0.45 0.40 0.35 0.30 0.25 0.20 0.15 0.10 0.05 0 0 0.04 0.08 0.12 0.16 0.20 Fig. 20.8 0.6 0.4 0.2 102 103 104 R ac 1 ac tiv ity (F R E T/ C FP ) FRET biosensor concentration (YFP) GDP GTP Ori WT N17 V12 Rac1 low Rac1 high % of Max
Rac1 activity (FRET/CFP)0.4 0.6 0.4 0.6 Before sorting After sorting
Rac1low Rac1high
0 20 40 60 80 100 Day 0 Day 1 Day 7 Day 14 Cdc42high Cdc42low Cdc42high Cdc42low Cdc42high Cdc42low Cdc42high Cdc42low 0.4 0.6 0.8 Cdc42 activity (FRET/CFP) Day 0 Day 1 Day 7 Day 9 0.4 0.6
Rac1 activity (FRET/CFP) Rac1high Rac1low Rac1high Rac1low Rac1high Rac1low Rac1high Rac1low
active Rac1 total Rac1
N17 V12 Rac1 low Rac1 high N17 V12 Rac1 low Rac1 high
Rac1lowRac1high
Normalized
active / total Rac1 0.95
1 1.05 1.1 1.15 Invasion (%) p=0.6×10⁻⁵ 0 20 40 60 80 100
Rac1lowRac1high
32 34 36 38 40 42 44 p=0.036
Rac1lowRac1high
GTP/(GTP+GDP) (%) A F E D C B Fig. 3
Rac1 vs.Cdc42 Expression dif ference [log 2 (Cdc42 high /Cdc42 low )] r= 0.358 p<2.20e-16 -2 -1 0 1 2 -2 -1 0 1 2 Expression difference [log2(Rac1high/Rac1low)]
Rac1 vs. RhoA Expression dif ference [log 2 (RhoA high /RhoA low )] r= 0.066 p= 0.086 Expression difference [log2(Rac1high/Rac1low)]
-2 -1 0 1 2 -2 -1 0 1 2 Cdc42 vs. RhoA r= 0.008 p= 0.830 Expression difference [log2(Cdc42high/Cdc42low)]
-2 -1 0 1 2 Expression dif ference [log 2 (RhoA high /RhoA low )] -2 -1 0 1 2 A B C D
Genes up-regulated in Rac1high population
Biological Process Count P-value
G-protein coupled receptor protein signaling pathw ay 4 7.36E-07
cell-matrix adhesion 6 3.94E-05
electron transport chain 6 7.55E-05
cellular response to mycophenolic acid 5 1.60E-04
Rac protein signal transduction 3 1.60E-04
positive regulation of endothelial cell proliferation 2 1.64E-04
negative regulation of MAP kinase activity 2 4.09E-04
bioluminescence 4 4.77E-04
glial cell migration 2 9.46E-04
ureteric bud development 4 1.47E-03
Genes up-regulated in Rac1low population
Biological Process Count P-value
cell division 24 3.81E-18
cell cycle 30 7.77E-18
mitosis 21 1.19E-16
G-protein coupled receptor protein signaling pathw ay 5 2.43E-10
G1/S transition of mitotic cell cycle 8 2.37E-07
regulation of cell cycle 9 5.35E-06
organ regeneration 9 6.03E-06
positive regulation of cell cycle cytokinesis 4 7.46E-06
mitotic cell cycle 4 9.77E-05
signal transduction 28 1.54E-04
Genes up-regulated in Rac1high
population
Cellular Component Count P-value
respiratory chain 5 2.94E-05
focal adhesion 7 1.21E-04
mitochondrial respiratory chain complex I 4 4.09E-04
cytoplasmic vesicle membrane 5 4.63E-04
Golgi membrane 9 8.99E-04
mitochondrial membrane 5 9.81E-04
membrane 57 1.45E-03
endoplasmic reticulum 18 2.50E-03
Golgi apparatus 17 2.60E-03
integrin complex 3 3.78E-03
Genes up-regulated in Rac1low population
Cellular Component Count P-value
cytoplasm 114 1.79E-09
nucleus 110 9.47E-08
integral to membrane 40 1.90E-07
spindle pole 9 1.06E-06
extracellular matrix 15 1.72E-06
centrosome 17 2.63E-06 spindle 9 2.85E-06 chromosome 13 1.90E-05 cytoskeleton 19 1.74E-04 microtubule 11 4.57E-04 Pstpip2 Freq TSN17 Mmp15 Elmo1 Egr2 0 2 4 6 8 10 12 Average expression [log2(Rac1
high×Rac1low)/2]
Expression dif ference [log 2 (Rac1 high /Rac1 low )] 0 2 1 -1 -2 Fig. 4
A B C 0 10 20 30 40 50 60 Control Egr2 % Invasion p = 0.03 0 10 20 30 40 50 60 Control Elmo1 p = 0.006 D E F 10 100 Lg al s3 M M P 15 R gs 2 T m em 10 0 S d c2 S lc 1a 1 F gf r3 T S N 17 C sg al n ac t1 C dh 13 N tr k2 F re q/NCS-1 Il1 ra p P st pi p2 C on tr ol % In va si on
***
***
*
**
siRNAsiRNA siRNA siRNA
Control Egr2 Elmo1 siRNA 1.5 2.5 Rac1 activity (FRET/CFP)
Control Egr2 Elmo1
Rac1 activity (FRET/CFP)
2.5 2.0 1.5 1.0 siRNA 242 232 127 N = 0 10 20 30 40 50 60 Control PRex1 p = 0.57
Control Lgals3 MMP15 Rgs2 TSN17 Freq Pstpip2
Rac1 activity (FRET/CFP)
3.0 2.5 2.0 1.5 1.0 242 175 177 98 94 66 127 siRNA N =
siRNA: Control Lgals3 MMP15 Rgs2 TSN17 Freq Pstpip2