首都大学東京 博士 ( 理学 ) 学位論文 ( 課程博士 ) 論文名
中部ベトナムにおける極端降水
―現地観測・衛星推定評価・将来予測(英文)
著者
トリン トゥアン ロン
審査担当者 主査
委員
委員
上記の論文を合格と判定する
平成 年 月 日
首都大学東京大学院都市環境科学研究科教授会
研究科長
DISSERTATION FOR A DEGREE OF DOCTOR OF PHILOSOPHY (SCIENCE) TOKYO METROPOLITAN UNIVERSITY
TITLE: Extreme precipitation over Central Vietnam: in-situ observation, satellite estimation and future projection
AUTHOR: Long TRINH TUAN
EXAMINED BY Chief examiner:
Examiner:
Examiner:
QUALIFIED BY THE GRADUATE SCHOOL OF URBAN ENVIRONMENTAL SCIENCES TOKYO METROPOLITAN UNIVERSITY
Dean:
Date:
Extreme precipitation over Central Vietnam: in-situ observation, satellite estimation and future projection
Long TRINH TUAN
Department of Geography
Graduate School of Urban Environmental Sciences
Tokyo Metropolitan University
March 2019
iv
Contents
List of figures ... vi
List of tables ... xi
Acronyms ... xii
Acknowledgments ... xv
Abstract ... xvii
Chapter 1. Introduction ... 1
1.1 Motivational background information ... 1
1.2 Main objectives ... 3
1.3 Dissertation outline ... 4
Chapter 2. Autumn Rainfall Increasing Trend in South Central Vietnam and Its Association with Changes in Sea Surface Temperature ... 6
2.1 Introduction ... 6
2.2 Data and methods ... 8
2.2.1 Data sources ... 8
2.2.2 Methodology ... 9
2.3 Observed trends in rainfall during boreal autumn ... 10
2.4 Rainfall change associated with dynamics and thermodynamics of large-scale circulation features ... 12
2.5. Conclusions ... 15
Chapter 3. Evaluation of Satellite Precipitation Products over Central Vietnam ... 16
3.1 Introduction ... 16
3.2 Methods... 18
3.2.1 Satellite precipitation datasets ... 18
3.2.2 Gauge precipitation data ... 20
3.2.3 Widespread heavy rainfall (WHR) days ... 21
3.2.4 Study area ... 21
3.2.5 Evaluation method ... 22
v
3.3 Results and discussion ... 23
3.3.1 Overall performance ... 23
3.3.2 SPDs’ ability to detect heavy rainfall in WHR days ... 27
3.3.3 Potential factors influencing satellite precipitation estimations ... 28
3.4 Conclusions ... 30
Chapter 4. Application of Quantile Mapping Bias Correction for Mid-future Precipitation Projections over Vietnam ... 32
4.1 Introduction ... 32
4.2 Data and methodology ... 34
4.2.1 Numerical experiments ... 34
4.2.2 Quantile mapping bias correction ... 34
4.2.3 Observation-based rainfall data ... 34
4.2.4 Precipitation indices ... 35
4.3 Results and discussion ... 35
4.3.1 Evaluation of the QM BC ... 35
4.3.2 Projected changes of precipitation and PIs ... 38
4.4 Conclusions ... 39
Chapter 5. General Conclusions and Outlook ... 41
Bibliography ... 45
Figures ... 58
Tables ... 85
vi
List of figures
Fig. 2.1. (a) Topography of Vietnam. The broken line indicates the Truong Son Mountains Range. Star indicates Hue station (107.6°E, 16.4°N). (b) Climatological SOND rainfall averaged for the period 1961–2012 calculated by 59 rain gauge station’s data in Vietnam.
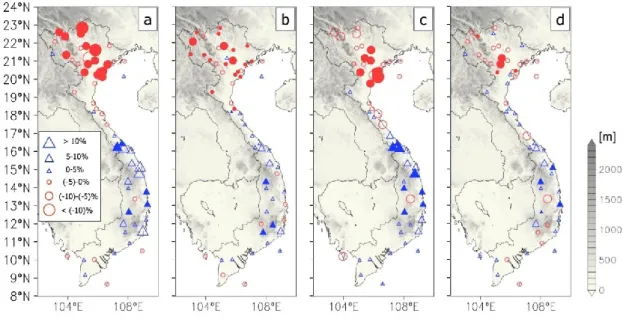
Fig. 2.2. Trends in (a) Pav, (b) RR01, (c) R50mm and (d) Rx1day. Trends are calculated as percentage variations with respect to the mean value per decade. Triangle (circle) symbols indicate increasing (decreasing) trend. Solid symbol denotes statistical significance at 5%
level.
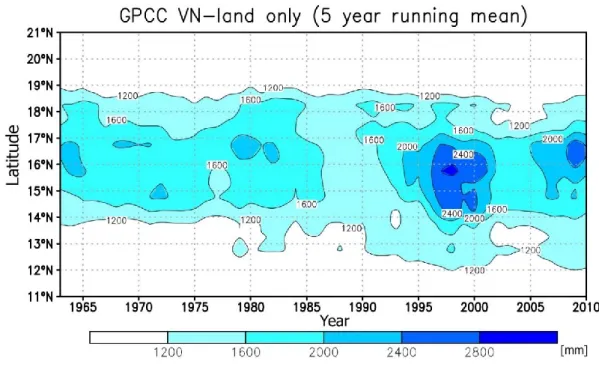
Fig. 2.3. Five-year running mean of latitudinal mean GPCC SOND rainfall (Vietnam land only) from 1963 to 2010.
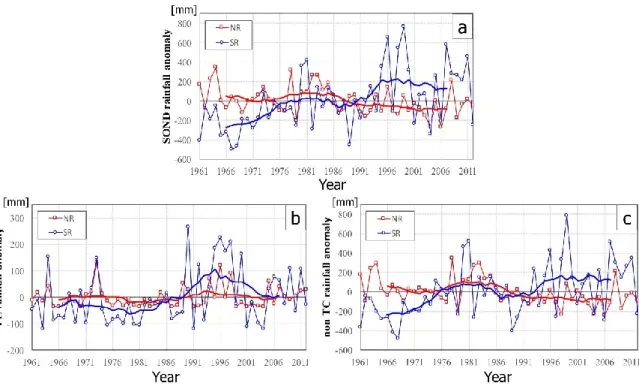
Fig. 2.4. Inter-annual variations of SOND rainfall anomaly in the NR (red line) and SR (blue line) for (a) station-averaged rainfall (b) TC rainfall and (c) non-TC rainfall. Thick lines show their 11-year running mean.
Fig. 2.5. 1961–2012 SOND climatology of (a) 850 hPa winds (vector; m s-1) and wind speed (shading; m s-1), gray shadings denote where the pressure is lower than topography, (b) vertically integrated moisture flux transport (vector; kg m-1 s-1) and vertically integrated moisture flux convergence (shading; kg kg-1 s-1).
Fig. 2.6. Long-term SOND trends for (a) 850 hPa wind (vector) and SST (shading), (b) evaporation (mm), (c) specific humidity at 2 m (g kg-1), (d) vertically integrated moisture flux transport (vector; kg m-1 s-1) and convergence (shading; kg kg-1 s-1), and (e) outgoing longwave radiation (W m-2). The dotted region denotes statistical significance at 5% level.
In case of vectors, only significant vectors at 5% level are shown. Rectangular boxes show north and south VES, respectively.
vii
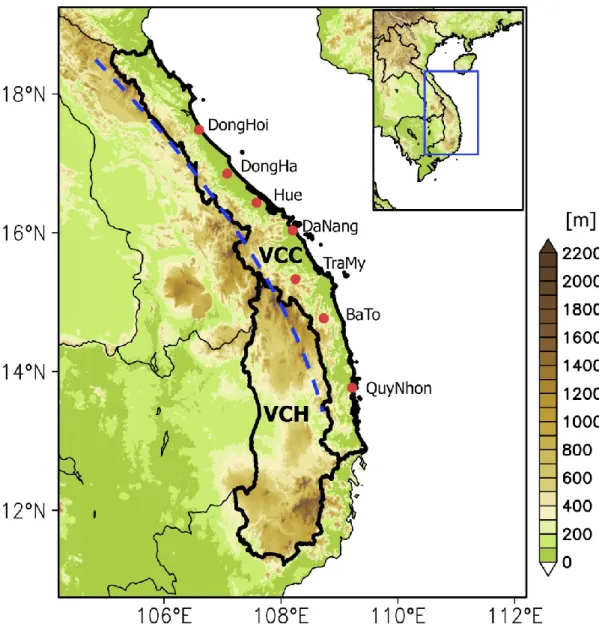
Fig. 3.1. Topography (shaded, m) of the VCC and the VCH (surrounded by thick-solid-black lines), and eastern part of the Indochina Peninsula. The small blue box indicates the study region. The blue broken line indicates the Truong Son Mountains. The red points show rain gauge stations in the VCC and are listed in Table 3.2.
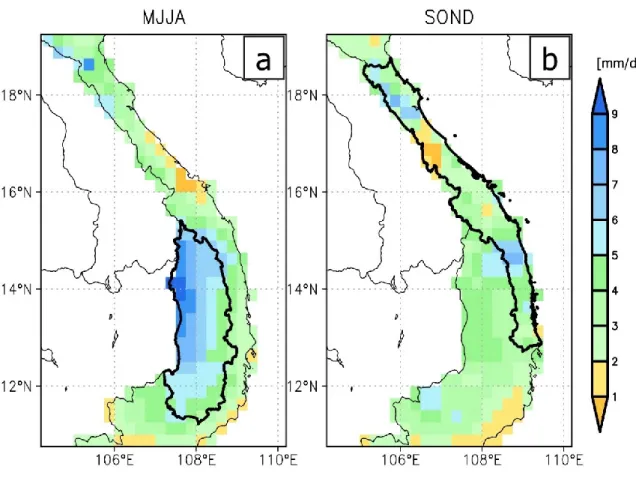
Fig. 3.2. Spatial patterns of (a) MJJA and (b) SOND total rainfall contribution in percentage to annual rainfall over central Vietnam averaged for 2001–2010, derived from the VnGP data. Vectors show horizontal wind fields at 925 hPa averaged for the corresponding months and years, derived from ERA-Interim reanalysis data. The VCH and the VCC are surrounded by black thick lines in (a) MJJA and (b) SOND patterns, respectively.
Fig. 3.3. Spatial patterns of SPDs’ rainfall difference between maximum and minimum values at each grid point in central Vietnam, averaged for (a) MJJA and (b) SOND in 2001–
2010. The VCH and the VCC are surrounded by black thick lines in (a) MJJA and (b) SOND patterns, respectively.
Fig. 3.4. Scatter plots of VnGP and SPDs (CMORPH, GSMaP and TRMM) regional mean rainfall over the VCH for MJJA in 2001–2010, for (a) daily and (b) monthly values. Sample numbers are N = 1230 for each scatter plot of daily values and N = 40 for monthly values.
Correlation coefficients between each SPD and VnGP are also displayed.
Fig. 3.5. Upper panels (from left): Spatial patterns of four-month (MJJA), 10-year (2001–
2010) averaged daily rainfall for VnGP and three SPDs (CMORPH, GSMaP and TRMM) over the VCH. Middle panels (from left): Spatial patterns of four-month (MJJA), 10-year (2001–2010) averaged daily rainfall difference between each SPD and VnGP. Lower panels (from left): CORR grid-point-values between each SPD and VnGP for monthly rainfall in MJJA during 2001–2010.
viii
Fig. 3.6. Boxplots for bias, CORR and RMSE-ratio grid-point-values over the VCH (N = 88 for each boxplot) for three SPDs (CMORPH, GSMaP and TRMM) with VnGP, for MJJA in 2001–2010. Boxplots of CORR and RMSE-ratio values are shown for both daily and monthly rainfall. Sample numbers are N = 1230 for each bias value, N = 1230 for each CORR or RMSE-ratio value for daily rainfall, and N = 40 for each CORR or RMSE-ratio value for monthly rainfall.
Fig. 3.7. Same as Fig. 3.4, except for SOND rainfall over the VCC. Sample numbers are N
= 1,220 for each scatter plot of daily values and N = 40 for monthly values.
Fig. 3.8. Same as Fig. 3.5, except for SOND rainfall over the VCC.
Fig. 3.9. Same as Fig. 3.6, except for SOND rainfall over the VCC (N = 85 for each boxplot).
Sample numbers are N = 1220 for each bias value, N = 1220 for each CORR or RMSE-ratio value for daily rainfall, and N = 40 for each CORR or RMSE-ratio value for monthly rainfall.
Fig. 3.10. RMSE ratio of the SPDs for the different categories of VnGP precipitation intensity (a) during MJJA over the VCH and (b) during SOND over the VCC. The numbers of days (i.e. sample numbers) for each category of VnGP precipitation intensity during 2001–
2010 are also displayed.
Fig. 3.11. The relations between rainfall thresholds and the POD, FAR and HSS values of SPDs’ daily rainfall estimates with rain-gauge observations at the seven stations on the WHR TI and NM days listed in Table 3.3.
Fig. 3.12. Scatter plots between the zonal wind component at 925 hPa (abscissa, unit: m s-1) in the ERA-Interim and rainfall difference ΔP (SPDs rainfall minus the VnGP rainfall;
ordinate, unit: mm day-1) averaged for each region and each month during MJJA in the VCH (a) and SOND in the VCC (b) from 2001 to 2010. N = 40 for each plot, black bordered marks show the values in September.
ix
Fig. 3.13. Scatter plots for grid point values of the elevation (abscissa, unit: km) and the time-averaged rainfall bias (SPDs rainfall minus VnGP rainfall; ordinate, unit: mm day-1) for (a) MJJA over the VCH and (b) SOND over the VCC in 2001–2010. The dashed lines are regression lines.
Fig. 4.1. (a) CORDEX–SEA domain used in the numerical downscaling experiments, and (b) the study region of inland Vietnam. Topography over Southeast Asia (shaded) is obtained from the Global 30 Arc-Second Elevation (GTOPO30) dataset. The seven climatic sub- regions of Vietnam (R1 to R7) are also displayed in Fig. 4.1 b.
Fig. 4.2. Observed mean daily precipitation (VnGP) for the period 1996–2005, and the bias of each RCM experiment before (upper row) and after BC (lower row) during (a) MJJA, and (b) SOND.
Fig. 4.3. PDFs of precipitation averaged over seven sub-regions during 1996–2005. Only values larger than 1 mm day-1 are shown for clarity. The light green and light blue shaded areas represent the range of values from the five models while the green and blue lines are the average of the PDFs from the original RCMs and bias‐corrected RCMs, respectively.
The black line is the PDF calculated from the VnGP data set.
Fig. 4.4. Regional averages of observed and simulated PIs during 1996–2005. The original (uncorrected) and QM bias corrected RCMs are represented by green and blue circles, respectively, and the ensemble average values are shown by the lines. Red dashes denote the observation-based VnGP data.
Fig. 4.5. Taylor diagrams for comparing the PIs of the original (uncorrected) and QM bias corrected RCM outputs with that of the VnGP (black circle). Green triangles and blue circles represent the RCM products before and after the QM BC, respectively. Red triangles and red circles indicate the ensemble average of the RCMs.
x
Fig. 4.6. Relative changes (%) of QM BC precipitation index (∆PIs(QM)) between the mid- future period 2046–2065 and the baseline period 1986–2005 for (a) MJJA and (b) SOND.
Hatch patterns indicate areas where at least four out of the five experiments agree in the sign of changes, i.e. where the change is called "consistent".
Fig. 4.7. Difference between the relative change of QM BC precipitation index (∆PIs(QM)) and that of original index (∆PIs(non-QM)) for (a) MJJA and (b) SOND. Hatch patterns indicate areas where those two relative changes are opposite in sign.
xi
List of tables
Table 2.1 Definition of the precipitation indices (PIs) used in the study.
Table 3.1. Summary of the three SPDs used in this study.
Table 3.2. List of the seven meteorological stations in the VCC used in this study.
Table 3.3. WHR events during 2001–2010 detected in this study in the VCC and caused by TI and NM.
Table 3.4. Summary of the statistics, POD, FAR and HSS, used in this study. They are computed from counts (letters a–d) in a 2 × 2 contingency table (N = 1,078 in TI case; N = 1148 in NM case). a: SPD rainfall > threshold, VnGP rainfall > threshold; b: SPD rainfall >
threshold, VnGP rainfall ≤ threshold; c: SPD rainfall ≤ threshold, VnGP rainfall > threshold;
and d: SPD rainfall ≤ threshold, VnGP rainfall ≤ threshold.
Table 4.1. List of selected CMIP5 GCMs downscaled using RegCM4.3 at 25 km resolution from the CORDEX-SEA simulations.
Table 4.2. Definition of the precipitation indices used in the study.
Table 4.3. Percentage contribution (%) of MJJA and SOND rainfall to the total annual values for each sub-region.
xii
Acronyms
APHRODITE Asian Precipitation – Highly-Resolved Observational Data Integration Towards Evaluation
BC Bias correction
CDD Maximum consecutive dry days CDF Cumulative distribution function
CMIP5 Coupled Model Intercomparison Project Phase 5 CMORPH Climate Prediction Center Morphing
CORDEX–SEA Coordinated Regional Climate Downscaling Experiment – Southeast Asia CORR Correlation Coefficient
CPC Climate Prediction Center CWD Maximum consecutive wet days
ECMWF European Centre for Medium-Range Weather Forecasts
ENS Ensemble average
ENSO El Niño-Southern Oscillations FAR False Alarm Ratio
GCM Global climate model GDP Gross Domestic Product
GPCC Global Precipitation Climatology Centre GSMaP Global Satellite Mapping of Precipitation
HadISST Hadley Centre Sea Ice and Sea Surface Temperature HSS Heidke Skill Score
IPCC Intergovernmental Panel on Climate Change
xiii
ITCZ Inter-tropical Convergence Zone JRA Japanese 55-year Reanalysis JTWC Joint Typhoon Warning Center
MJJA May to August
MJO Madden Julian Oscillation
MONRE Ministry of Natural Resources and Environment NM Northeast winter monsoon
NR North Region
OAFlux Objectively Analyzed air–sea Fluxes OLR Outgoing longwave radiation
Pav Precipitation average
PDF Probability density function
PI Precipitation index
POD Probability of Detection
QM Quantile Mapping
R20mm Seasonal count of days when daily precipitation ≥ 20 mm R50mm Seasonal count of days when daily precipitation ≥ 50 mm RCM Regional climate model
RCP Representative Concentration Pathways RMSD Root-mean square difference
RMSE ratio Root Mean Square Error ratio RR01 Number of rainy days
Rx1day Maximum daily precipitation
Rx5day maximum consecutive 5-day precipitation
xiv SDII Simple daily intensity index
SOLA Science Online Letters on the Atmosphere SOND September to December
SPD Satellite Precipitation Dataset
SR South Region
SST Sea surface temperature STDR Standard deviation ratio SVES South Vietnam East Sea
TC Tropical Cyclone
TF Transfer function
TI TCs and ITCZ
TRMM Tropical Rainfall Measuring Mission VCC Vietnam Central Coast
VCH Vietnam Central Highlands
VES Vietnam East Sea
VIMFC Vertically integrated moisture flux convergence VIMT Vertically integrated moisture transport
VnGP Vietnam Gridded Precipitation
VNMHA Vietnam Meteorology and Hydrology Administration WHR Widespread Heavy Rainfall
xv
Acknowledgments
First and foremost, I would like to offer my sincerest gratitude to my supervisor Prof.
Jun Matsumoto, for his advice and guidance. I am so grateful to be one of his students and to have such a kind-hearted supervisor who always makes me feel supported throughout the course of my Ph.D research. I am also grateful to my thesis examiners, Prof. Hiroshi Matsuyama and Prof. Hideo Takahashi, who gave valuable comments and suggestions for the improvement of this thesis. I am also highly indebted for the financial support provided by the Tokyo Metropolitan Government through the “Tokyo Human Resources Fund for City Diplomacy” scholarship.
I would also like to thank Assoc. Prof. Thanh Ngo-Duc from University of Science Technology Hanoi (USTH) for his continued support, encouragement and for inspiring me to pursue further goals during the past three years of my PhD course. Without him, I would have not been where I am today. His positive feedbacks and superb methodological suggestions really brought the work together and helped me culminate the thesis. The constructive criticisms and the great ideas persuasively provided by the anonymous reviewers during the peer-review processes of my papers, which are the main components of this thesis, are sincerely acknowledged as well.
I would like to thank Dr. Chanh Kieu (Indiana University Bloomington), Dr. Phu Nguyen (University of California Irvine) and Dr. Toan Nguyen (University of California David) for their discussions since the AGU fall meeting, 2018. Having had the chance to work with them has broadened my knowledge that has contributed greatly in my analysis approaches and shaping the way I do research.
xvi
Completing this work would have been more difficult without the advice and suggestions from all senior as well as junior members of the Laboratory of Climatology, Department of Geography, Tokyo Metropolitan University I have received during our Lab seminars and sub-seminars. I am thankful to have worked with Dr. Tomoshige Inoue, Dr.
Masato I. Nodzu, whom I could always seek for helpful comments and suggestions when needed. Special thanks go to Mrs. Mio Tanahashi, Mrs. Tomoko Motokado, Mrs. Yuko Saigusa for their assistance with all the paperworks, Ms. Nozomi Kamizawa, Dr. Kou Nakajima for their kind support that has helped my life in Japan so much easier. I also want to thank all of my international friends and the TMU Vietnamese Student Community for their support and friendship throughout my student life at Tokyo Metropolitan University.
In my daily work, I have been blessed with a friendly and cheerful group of fellow students. I would like to thank Dr. Julie Mae Dado, and two other doctoral students Lyndon Mark Olaguera and Rakesh Teja Konduru. I will never forget all the stimulating discussions, the weekends we worked together, and all the good times spent together during the last three years. Thank you all! I have learned so much from you all, from research to life experiences.
Last but not least, I would like to thank my family: both my parents, parents-in-law and my younger sister for their unconditional love and endless spiritual support throughout my whole life. Without their presence and encouragement, I would have not been able to be the person I am today. Above all, I would like to express my special thanks of gratitude to my beloved wife, for her love and constant support, for all the late nights and early mornings, and for keeping me sane over the past years. Finally, I dedicate Ph.D to one special person - my daughter. Seeing her growing up day by day has given me so much motivation to overcome any obstacles and difficulty times of life.
xvii
Abstract
Climate change is one of the most significant challenges facing human beings today.
Climate change has already affected agricultural production, and socioeconomic structures, and will extensively and intensively alter the development process and security issues including food, water, energy and social safety. Vietnam is one of the countries that are severely affected by climate change, particularly in coastal areas. Located in the east of the Indochina Peninsula, with complex topography, long coastline opened to the east, rainy regime in Vietnam is dominated by monsoon systems, Inter-tropical Convergence Zone (ITCZ) and tropical cyclone activities. Usually, heavy rainfall events occur in cases of combination, among them in an interaction with topography, particularly in central Vietnam.
In order to increase public awareness about trend of change in extreme precipitation, this thesis aims to answer the three following scientific questions, which are: (1) How did heavy rainfall in central Vietnam events vary and change in the past? (2) Can satellite estimations represent well the heavy rainfall events over the central coast and central highlands of Vietnam accurately and reliably? and (3) Are regional models capable of representing extreme precipitation events and how will the extreme precipitation indices change in the future?
In order to answer the first question, a 52 year long-term trend (1961–2012) of the major rainfall over south central Vietnam during September to December (SOND) was investigated. Along the coastal regions, SOND rainfall amount and heavy rainfall indices were observed to have significantly increased in the south of 17oN (south region; SR) but decreased in the north of 17oN since the late 1980s and early 1990s. In addition, tropical cyclone-induced rainfall demonstrates an increasing trend over SR. This long-term increasing trend of SOND rainfall is associated with the recent sea surface temperature
xviii
warming after the late 1980s over the South Vietnam East Sea (SVES). Owing to the recent warming and grand La Niña-like pattern after the 1990s, the SVES surface temperature has increased by 0.8–1.2 °C over the period from 1961 to 2012, leading to enhanced moisture flux convergence over SR. Besides, SVES warming also strengthens the anomalous northeasterly winds that affect SR. Consequently, SR has become more prone to deep convection and heavy rainfall events.
Next, to address the second scientific question, a comprehensive validation of three common satellite precipitation datasets (SPDs) was conducted using Vietnam Gridded Precipitation dataset (VnGP) and rain gauge station data over central Vietnam. Three SPDs, which are CMORPH, GSMaP, TRMM, were compared and evaluated for two contrasting topographic regions: the Vietnam Central Highlands and the Vietnam Central Coast during the rainy seasons from 2001 to 2010 at different spatial and temporal scales. Moreover, widespread heavy rainfall days caused by the northeast winter monsoon, ITCZ, and TCs were also identified, and their performances using these SPDs were evaluated. The results indicated that the SPDs performance differed significantly depending upon geographical locations and rainfall mechanisms. Some SPDs biases showed good agreement with the increases of elevation and zonal wind speed, suggesting that some bias correction methods could be applied to improve the products quality.
Finally, in order to provide reliable rainfall condition in the middle future, the Quantile Mapping (QM) bias correction (BC) technique was applied for the first time to address biases in the simulated precipitation over Vietnam from the Regional Climate Model (RegCM) driven by five Coupled Model Intercomparison Project Phase 5 (CMIP5) Global Climate Model products. The QM process was implemented for the period 1986–2005, and subsequently applied to the mid-future period 2046–2065 under both Representative Concentration Pathway (RCP) 4.5 and RCP 8.5. Comparison with the original model outputs
xix
during the independent validation period showed a large bias reduction from 45% to 3% over Vietnam and significant improvements in representing precipitation indices (PIs) after applying the QM technique. Moreover, the ensemble average of the BC products generally performed better than any individual BC member in capturing the spatial distribution of the PIs. A drier condition with a longer rainfall break, and shorter consecutive rainfall events are anticipated over northern and central Vietnam during their respective wet seasons in the mid- future. Furthermore, this study showed that the QM method minimally modified the future changes in PIs over most of Vietnam; thus, these corrected projections could be used in climate impacts and adaptation studies.
In summary, this study has analyzed associated changes in the atmospheric dynamic and thermodynamic fields in order to establish an observed relationship with rainfall trend over Vietnam. The performance of the three SPDs also provided useful information for water management, hydrological applications, and the algorithm correction can be applied additionally. Last but not least, the projection of middle future precipitation changes under different climate change scenarios may support policy makers and scientists in climate change adaptation and mitigation.
1
Chapter 1. Introduction
1.1 Motivational background information
Nowadays, climate change is one of the most significant challenges facing human life. The Intergovernmental Panel on Climate Change (IPCC) reported many evidences that Vietnam and other Southeast Asia countries are severely affected by climate change, particularly in coastal areas (IPCC, 2013). Vietnam is already experiencing changes in fundamental climatic elements as well as extreme weather phenomena such as tropical cyclones, heavy rains, and droughts. In the recent thirty years, natural disasters have resulted in remarkable financial loss at around ~1.5 % of the country’s annual Gross Domestic Product (GDP), in which the biggest damage of approximately 350 million US dollars was caused by tropical cyclones and floods, and is likely to increase in the coming years (MONRE, 2009, 2012). Therefore, understanding of climate change, specifically extreme precipitation events is extremely important for Vietnam in order to provide solutions to minimize widespread destruction, major collateral damage as well as loss of life.
Central Vietnam is located in the eastern part of the Indochina Peninsula, with complex topography, is particularly vulnerable to extreme precipitation events such as floods.
The cause of heavy rainfall events over central Vietnam has been investigated in many studies (Yokoi and Matsumoto, 2008; Yen et al., 2011; Chen et al., 2012b, among others).
In general, the climate of Vietnam is primarily controlled by the southwest and northeast monsoons system (Phan et al., 2009). The southwest monsoon arrives in early-May to southern Vietnam and go up to north of Vietnam in July (Wang et al., 2004; Pham et al., 2010; Nguyen et al., 2014). In northern and southern Vietnam, major rainfall is received during the boreal summer season, whereas rainfall in central Vietnam is concentrated during
2
the boreal autumn to early winter from September to December (Matsumoto, 1997;
Matsumoto et al., 2017). The major rainfall over central Vietnam is related to tropical cyclone activities, the migration of the inter-tropical convergence zone (ITCZ), and the northeast monsoon (Phan et al., 2009; Chen et al., 2015a, 2015b). Heavy rainfall sometimes occurs when these mentioned factors interact with the high mountain ranges as an orographic effect (Yen et al., 2011).
There have been many studies that showed the inter-annual variability of rainfall in Vietnam is affected by the changes in the lower boundary such as sea surface temperature (SST), moisture transport, and large-scale circulations (Chen et al., 2012a; Nguyen-Le and Matsumoto, 2016). In addition, rainfall in October to November over central Vietnam is correlated well with SST anomalies over the equatorial eastern Pacific associated with the El Niño-Southern Oscillations (ENSO; Yen et al., 2011). However, the impact of local SST on autumn boreal rainfall has not been evaluated thus far. In particular, the local impact of the sea surface conditions over the Vietnam East Sea (VES) on rainfall over central Vietnam has not been examined yet. Therefore, investigating the long-term changes in autumn rainfall in the past and the associated changes in the atmospheric, dynamics, and thermodynamic fields is necessary.
In order to provide useful information for hydrological applications such as water management or flood warning in central Vietnam, a high temporal and spatial resolution precipitation datasets are needed. In recent years, satellite precipitation estimation has been a valuable source of information, specifically for developing countries like Vietnam, which does not have a sufficient number of ground observation stations. Satellite precipitation products have been developed continuously and significantly, and thus are considered as a promising new data source (Kidd, 2001; Tapiador et al., 2012). However, there are few studies that evaluated satellite precipitation products for Vietnam, especially in complex
3
topographic regions and for heavy rainfall events. For this reason, a comprehensive validation of satellite precipitation datasets are required for central Vietnam.
In the context of climate change, regional climate models (RCMs) are being used widely in order to obtain information at a higher resolution in Vietnam (Phan et al., 2009;
Ngo-Duc et al., 2014; Van Khiem et al., 2014; Katzfey et al., 2016). Although RCMs can represent regional and even local scale climate conditions, there remain several systematic errors, especially in precipitation and extreme precipitation (Giorgi and Shields, 1999).
Moreover, RCMs are sensitive to parameterization, which leads to model biases and uncertainties (Cruz et al., 2017; Juneng et al., 2016). The biases were not only found in the mean precipitation but also in extreme precipitation events (Leander and Buishand, 2007;
Ngo-Duc et al., 2014). These biases in precipitation projections showed fairly large uncertainties in climate change, which could limit their applicability in climate impact studies. Thus, many studies such as Christensen et al. (2008) and Maraun (2013) mentioned the necessity to apply bias correction (BC) methods to simulate extreme precipitation realistically. Meanwhile, the simulations and projections over Vietnam using RCMs downscaling from the latest Fifth Assessment Report of the Intergovernmental Panel on Climate Change (IPCC, 2013) have not been published in peer-reviewed international journals before. Therefore, the information about future climate is important for climate change adaptation and mitigation not only in central Vietnam but also for the whole Vietnam.
1.2 Main objectives
This study aimed to answer the following three questions:
(1) How did heavy rainfall events vary and change in the past and how the local SST impacts the autumn rainfall over central Vietnam?
4
(2) Can satellite estimations represent well the heavy rainfall events over the central coast and central highlands of Vietnam accurately and reliably?
(3) Are regional climate models capable of representing extreme precipitation events and how will the extreme precipitation indices change in the future?
1.3 Dissertation outline
This dissertation is a compilation of two published articles and a manuscript that is currently under revision; therefore, each of these succeeding chapters is an independently- written manuscript/paper with their specific objectives, which are subsets of the main aim of this dissertation. Because of them, the conventional way of writing a dissertation is disregarded and readers may find it inconvenient by repeatedly each part of a scientific paper in every chapter. Nevertheless one can immediately achieve a conclusion by just reading any of the succeeding chapters.
Chapter 2 investigates the long-term changes in autumn rainfall and the link between the changes in rainfall and SST in the Vietnam East Sea. Moreover, the associated changes in the atmospheric dynamics, and thermodynamic fields will be analyzed to establish their relationships with rainfall trends over Vietnam. This chapter is based on an article that was published in the 54th Issue of the Geographical Reports of Tokyo Metropolitan University (Trinh-Tuan et al., 2019a).
Chapter 3 presents the evaluation of three satellite precipitation dataset (SPD) for two contrasting topographic regions: Vietnam Central Highlands and the Vietnam Central Coast, during the rainy seasons from 2001 to 2010 at different spatial and temporal scales. In addition, widespread heavy rainfall days caused by the northeast monsoon, inter-tropical convergence zone, and tropical cyclones were also identified, and their performances using these SPDs were evaluated. It is based on a manuscript that has been submitted for
5
publication and is currently under peer review in the Progress in Earth and Planetary Science (Trinh-Tuan et al., 2019b)
Chapter 4 first examines the performance of the Quantile Mapping (QM) bias correction (BC) technique in representing the spatio-temporal structure of seasonal and extreme precipitation in the historical period and then applies the correction for projected precipitation in the mid-future period 2046–2065. Moreover, this study first time used the Representative Concentration Pathways (RCPs) adopted by the IPCC for its fifth Assessment Report (IPCC, 2013) in Vietnam. Therefore this chapter will also examine for the first time how the QM BC modifies the future RCP change signal in Vietnam compared to the traditional non-BC method. It is based on an article that has been appeared in the Science Online Letters on the Atmosphere (SOLA; Trinh-Tuan et al., 2019c)
Chapter 5 provides the concluding remarks and potential future researches that were not covered in this study; then, it is followed by the bibliographical references. After the bibliographical references, the figures and tables are separated from the text following the University’s’ guidelines.
6
Chapter 2. Autumn Rainfall Increasing Trend in South Central Vietnam and Its Association with Changes in Sea Surface Temperature
2.1 Introduction
Rainfall variability significantly affects developing countries such as Vietnam, whose economy and society depends strongly on agriculture. In general, rainfall in Vietnam is dominated by the summer rainy season, which occurs from early May to mid-August and the autumn rainy season from mid-September to mid-December (Nguyen-Le et al., 2015).
In most Asian monsoon regions, major rainfall is received during the boreal summer season, whereas rainfall in central Vietnam is concentrated during the boreal autumn to early winter (September to December, hereinafter SOND; Matsumoto, 1997; Matsumoto et al., 2017).
The SOND rainfall over central Vietnam occurs primarily owing to tropical cyclone (TC) activities, the migration of the inter-tropical convergence zone (ITCZ), and the northeast monsoon (Phan et al., 2009; Chen et al., 2015a, 2015b). Heavy rainfall sometimes occurs when these mentioned factors interact with the Truong Son Mountain Range (Fig. 2.1a) as an orographic effect (Yen et al., 2011). Yokoi and Matsumoto (2008) investigated the synoptic-scale atmospheric conditions leading to a heavy rainfall in central Vietnam in early November 1999 and concluded that a northerly wind anomaly from the winter monsoon cold surge in the lower troposphere together with southerly wind anomaly over the adjacent sea was responsible for it. Wu et al. (2012) indicated that the heavy rainfall events that occurred over central Vietnam in early October of 2010 were associated with the westward- propagating synoptic-scale disturbances from the western Pacific, and the eastward propagation of a strong active phase of the Madden Julian Oscillation (MJO).
7
As for rainfall variations over longer time scales, Endo et al. (2009) investigated trends in rainfall extremes in Southeast Asian countries from the 1950s to 2000s using extreme precipitation indices. They reported increasing trends in heavy rainfall over southern Vietnam, northern Myanmar, and some areas in the Philippines, and a decreasing trend in northern Vietnam. However, these extreme precipitation indices were only analyzed based on the annual computed values; therefore, it is important to determine whether the rainfall trend in a specific season is typical to the annual trend. Villafuerte and Matsumoto (2015) detected the increasing trend of both annual and autumnal (October–December) maximum daily precipitation (Rx1day) in central Vietnam from 1951 to 2007 using the data from the Asian Precipitation – Highly-Resolved Observational Data Integration Towards Evaluation of the Water Resources (APHRODITE) project (Yatagai et al., 2012). They found that the trend of Rx1day was linked to the increasing global mean temperature.
The inter-annual variability of rainfall in Vietnam is affected by the changes in the lower boundary such as sea surface temperature (SST), moisture transport, and large-scale circulations (Chen et al., 2012a; Nguyen-Le and Matsumoto, 2016). Yen et al. (2011) demonstrated that rainfall in October to November over central Vietnam is correlated well with SST anomalies over the equatorial eastern Pacific, which is associated with the El Niño- Southern Oscillations (ENSO). They indicated that the inter-annual rainfall variation over this region was primarily attributed to heavy rainfall events that occur approximately once per season. The impact of local SST on SOND rainfall has not been evaluated thus far. In particular, the local impact of the sea surface conditions over the Vietnam East Sea (VES) has not been examined in previous studies. Therefore, in the present study, we will investigate the long-term changes in SOND rainfall during the period 1961–2012.
Subsequently, the link between the changes in SOND rainfall and SST in the VES will be examined. Moreover, the associated changes in the atmospheric dynamics, and
8
thermodynamic fields will be analyzed to establish their relationships with rainfall trends over Vietnam.
2.2 Data and methods 2.2.1 Data sources
Daily and monthly rainfall from 1961 to 2012 were collected from 59 rain gauge stations (Fig. 2.1b) of the Vietnam Meteorology and Hydrology Administration (VNMHA), including 32 stations located in the north of 17°N (north region; NR) and 27 stations in the south of 17°N (south region; SR), and gridded dataset of the Global Precipitation Climatology Centre (GPCC; Schneider et al., 2015) from 1961 to 2012. In this study, we extracted and analyzed the data from stations that satisfies the following conditions: (1) more than 30 years of rainfall data existed; (2) SOND seasons with more than 10 years of missing data were not included for extreme index calculation. The quality of the rain gauge station data was verified using the five-sigma rule following Nguyen-Xuan et al. (2016).
Long-term changes in the large-scale circulation were investigated using a subset of the Japanese 55-year Reanalysis dataset (JRA-55; Kobayashi et al., 2015) produced by the Japan Meteorological Agency, namely the JRA-55 Conventional (JRA-55C; Kobayashi et al., 2014). The JRA-55C dataset is more homogeneous over a long period and unaffected by changes in historical satellite observing systems. Therefore, this dataset is suitable for studies of long-term climate variabilities. In the JRA-55C dataset, the daily data of zonal and meridional components of wind (u, v), specific humidity, air temperature, and geopotential height at multiple pressure levels were considered. To examine the long-term changes of TCs associated with the rainfall trends, the TC best track data provided by the Joint Typhoon Warning Center (JTWC) were used. The monthly data of Hadley Centre Sea Ice and SST version 1.1 (HadISST v1.1; Rayner et al., 2003) with 0.5-degree grid resolution were used to study the SST change in the VES region. Additionally, the ocean heat flux and evaporation
9
products were provided by the Woods Hole Oceanographic Institution Objectively Analyzed air–sea Fluxes (OAFlux) project (http://oaflux.whoi.edu). The National Oceanic and Atmospheric Administration daily outgoing longwave radiation (OLR), with a 2.5-degree grid resolution (Lee, 2014), were obtained for the period 1974–2012 from https://www.esrl.noaa.gov/psd/. According to the Japan Meteorological Agency, Niño-West indicates the strength of the warming/cooling in the west outside of the Niño3.4 region, therefore it can be used as an indicator for strength of El Niño or La Niña events (Kuriyama et al., 2012; Turkington et al., 2018). The regional mean of SOND SST in Niño-West (0–
15oN, 130–150oE) from http://www.data.jma.go.jp/gmd/cpd/data/elnino/index/datta were obtained.
2.2.2 Methodology
In this study, the trends of SOND rainfall (Pav) and extreme precipitation indices (PIs) (Table 2.1) including the number of rainy days (RR01), number of heavy rainfall days (R50 mm), and Rx1day, were investigated using the Kendall–Theil robust line method (Sen, 1968; Granato, 2006). Further, the trends of SST, winds, vertically integrated moisture flux convergence (VIMFC), and other meteorological variables were computed using the same method. To examine the statistical significance at the 5% level of the trend, we applied the non-parametric Mann–Kendall trend test (MK test; Kendall, 1975).
Moisture dynamics were computed using equations 1, 2, and 3. Equations 1 and 2 show the calculation for the vertically integrated moisture transport (VIMT) in the zonal (𝑄𝑢 ; units = kg m−1 s−1) and meridional (𝑄𝑣) directions, respectively.
𝑄𝑢 = 1
𝑔∫𝑝𝑝𝑠𝑓𝑐𝑢𝑞𝑑𝑝
𝑡𝑜𝑝 , (1)
𝑄𝑣 = 1
𝑔∫𝑝𝑝𝑠𝑓𝑐𝑣𝑞𝑑𝑝
𝑡𝑜𝑝 , (2)
10
where u and v are the zonal and meridional components of the wind, respectively, g is the acceleration owing to gravity (9.8 m s−2); q is the specific humidity (kg kg−1); p is the pressure; 𝑝𝑡𝑜𝑝 and 𝑝𝑠𝑓𝑐 are the pressures at the top and surface layers, respectively. The vertically integrated moisture flux convergence was calculated using equation 3 (VIMFC;
units = kg kg−1s−1).
𝑉𝐼𝑀𝐹𝐶 = −1
𝑔 [𝑑𝑦 ∫ (𝑞𝜕𝑢
𝜕𝑥+ 𝑢𝜕𝑞
𝜕𝑥) 𝑑𝑝 +
𝑝𝑠𝑓𝑐
𝑝𝑡𝑜𝑝 𝑑𝑥 ∫ (𝑞𝜕𝑣
𝜕𝑦+ 𝑣𝜕𝑞
𝜕𝑦) 𝑑𝑝
𝑝𝑠𝑓𝑐
𝑝𝑡𝑜𝑝 ], (3)
where VIMFC (Banacos and Schultz, 2005) was computed for the vertical column of atmosphere from 1000 to 300 hPa.
2.3 Observed trends in rainfall during boreal autumn
The distribution of climatological SOND rainfall is represented using the rain gauge stations over Vietnam (Fig. 2.1b). As shown, along the coastal line between 12°N to 19°N, the SOND rainfall accumulation is generally greater than 1000 mm. In addition, the major autumn rainfall in central Vietnam is primarily produced by heavy rainfall associated with flood events (Chen et al., 2012a). One of the record breaking heavy rainfall spells in Vietnam occurred in the beginning of November 1999, which caused a heavy flooding in the east coastal area in central Vietnam, expanding from 15.6°N to 16.7°N. In this event, the observed daily rainfall amount at the Hue station (Fig. 2.1a) was more than 1800 mm within 48 h (Yokoi and Matsumoto, 2008).
The spatial distributions of PIs trends were plotted based on the station calculations (Fig. 2.2). In general, the opposite trends of PIs in NR and SR are clearly seen. In the NR, significant decreasing trends in Pav are observed at 15 stations, with changing rates greater than 5% per decade. Meanwhile, over the SR, increasing trends are pronounced at 22 stations. It is noteworthy that in the coastal region from 11°N to 17°N, most stations exhibit increasing rates larger than 5% per decade and 5 stations demonstrate a significant increase.
11
Regarding the trends of PIs, in the northern region, the decreasing rates of RR01 and Rx1day are primarily less than 5% per decade. Meanwhile, R50mm's rate is greater than 5% at 14 stations. In contrast, R50mm in the SR tends to increase noticeably at 15 stations, with the rate exceeding 5%. Eight out of these 15 stations demonstrate a significant increase. The number of stations with significant increase in RR01 and Rx1day is less than those that demonstrate the same signal change in R50mm. The boundary of the contrasting rainfall trends between the northern and southern regions can be depicted around 17°N. This corresponds well with the results reported by Villafuerte and Matsumoto (2015), who found a significant increase in Rx1day over south–central Vietnam in the October to December season. To reveal the epochal difference, the latitudinal mean of SOND rainfall was displayed based on five-year running mean GPCC dataset for Vietnam land only (Fig. 2.3).
It is clear that the location of the region of maximum rainfall remains around 15–17°N before 1986. After 1990, maximum rainfall tends to be intensified and its center occurs approximately 1o to 2o southward in latitude.
Figure 2.4 represents the inter-annual variations of SOND rainfall anomaly calculated by all of station’s values in the NR and SR respectively. Both the average values and year-to-year variations of SOND rainfall in the SR (average=1176 mm) are relatively large compared to those in the NR (average=650 mm). As illustrated in Fig. 2.4a, the long- term trends of rainfall between the north and the south of Vietnam are noticeably different.
In the NR, it is obvious that the rainfall amount has decreased since the late 1980s.
Meanwhile, it tends to increase significantly (19.6 mm decade-1) in the SR. In particular, the SR shows 10.6% increase in rainfall in the period 1987–2012 (Epoch 2; E2) compared with 1961–1986 (Epoch 1; E1).
To consider the rainfall owing to synoptic scale systems, we computed the contribution of TCs (hereinafter, TC rainfall) and non-TC rainfall to SOND rainfall trends.
12
This TC rainfall computation was based on Nguyen-Thi et al. (2012a), who assigned rainfall induced by TC if the TC center is located within 600 km from the station. In regional scales, TC rainfall contributed approximately 6.2% and 10.3% to the total SOND rainfall in the NR and SR, respectively. Figure 2.4b shows that the SOND TC rainfall in the SR has increased during the period 1961–2012, which is consistent with the findings of Nguyen-Thi et al.
(2012b), who also indicated the significant increasing trends of TC rainfall amounts as well as TC heavy rainfall days. Simultaneously, non-TC rainfall in the SR, which might be due to ITCZ, the northeast monsoon, or local convective systems, also shows an increasing trend (Fig. 2.4c). It is noteworthy that TC rainfall in E2 is ~55% larger than that in E1 over the SR.
This analysis confirms that not only TC rainfall but also non-TC rainfall have increased significantly (7.9 mm decade-1 and 11.7 mm decade-1 respectively) over the SR.
2.4 Rainfall change associated with dynamics and thermodynamics of large-scale circulation features
The 52 year climatology of 850 hPa winds for SOND (Fig. 2.5a) shows northeasterlies associated with northeast monsoon over SR and easterlies over NR of Vietnam. These strong northeasterlies strike the windward side of the Truong Son Mountain Range (Fig. 2.1a) over central Vietnam, and therefore create a higher potential for an orographic-forced mechanism towards the windward side. In the windward side of the Truong Son Mountain Range, strong convergence and continuum of wind velocity are prominent. The amount of kinetic energy accumulations over the region would be high enough to force the orographic mechanism, which could contribute to precipitation in the presence of higher moisture transport and moisture flux convergence, and accumulation over the region owing to northeasterlies, as shown in Fig. 2.5b. The climatology of wind and moisture dynamics clearly shows that most of the moisture for the precipitation over the central and SR is contributed by northeasterlies.
13
Figure 2.6 shows the 52-year SOND trend of wind, SST, evaporation, specific humidity at 2 m, VIMFC, and OLR. The long-term trend of SOND wind field at 850 hPa (Fig. 2.6a) shows the significant enhancement in northeasterly winds over the VES predominantly over the south of the VES (11–16°N; 109–115°E; SVES), with westerly winds strengthened over the SR. The northeasterly wind trend is significant on the eastern coast of central Vietnam reflecting the strengthening of the northeast monsoon. In the SR, westerly/southwesterly wind trends are dominant. The strengthening of these two prominent wind patterns over SVES would be an important factor for the increasing trends of Pav and R50mm rainfall over the central and SR.
Figure 2.6a shows the SOND SST trend over the VES for the period from 1961–
2012. The SST over the SVES exhibits a significant warming of 0.8–1.2 °C for the 52-year period. Meanwhile, the SST increasing trend is rather small and not significant over the NVES. The warming over the SVES is a part of the western Pacific warming, which induces changes in large-scale circulations, thus might affect the northeast monsoon by the strengthening of northeasterly winds. Over the NVES, as SST and 850 hPa winds do not show any significant trend, the NVES region is excluded from the analysis. A correlation exists between the 52-year SOND rainfall amount over Vietnam and the SST over the SVES, indicating a positive and negative relationship with rainfall over the SR and NR rainfall, respectively. As a consequence, the rainfall increase over the SR is associated to the warming over the SVES.
Further investigation was performed to assess the VES warming and its association with the rainfall increase over the SR by considering the dynamics and thermodynamics of large-scale circulation features. Figure 2.6b shows a significant increasing trend of evaporation over the SVES. According to the Clausius–Clapeyron rate, approximately 1 °C warming of the VES should be able to hold ~7% more specific humidity (Trenberth et al.,
14
2003). Therefore, a significantly higher evaporation of approximately 10–20 mm over the VES results in more availability of moisture, especially over the SVES, as confirmed from the significant increasing trend of specific humidity over most parts of the VES in the last 52 years (Fig. 2.6c). Increase in humidity, along with strengthening of northeasterlies over the VES caused more moisture over the SR. Additionally, the increasing trend of VIMFC and the transport of VIMT support the increase in moisture convergence accumulation, that enhance heavy rainfall over the eastern coast of central Vietnam and the SR (Fig. 2.6d).
The primary moisture transport over SVES is due to the northeast monsoon flow.
Yokoi and Matsumoto (2008) demonstrated that northerly and southerly wind anomalies play a very important role in the heavy rainfall over the SR. The long-term trends of wind anomalies in the lower atmosphere, of the VIMFC and VIMT confirm the strengthening of northeasterly winds and moisture transport. Consequently, the VES warming (particularly over the SVES) has increased the moisture availability and strengthened the southwestward VIMT transport, thus resulting in a deeper convection over the SR and its adjacent SVES.
To demonstrate deep convection, we used the OLR (Fig. 2.6e), where its negative trend (1974–2012) indicates the further deepening of convection and precipitating systems.
Li et al. (2015) and Nguyen-Le et al. (2015) reported that after the 1990s, tropical western Pacific warming and eastern Pacific cooling modulated the Walker circulation with grand La Niña-like pattern (Xiang and Wang, 2013) In addition, a high correlation coefficient (0.63) between SOND SR rainfall and regional mean of SST in Niño-West region confirmed the liner dependent of SOND SR rainfall to strength of La Niña events.
Consequently, the La Niña-like pattern appears to control the background mean states of the SST and the circulation over the VES and western North Pacific. Such a change in the large- scale circulation, along with the warming of the SVES, wind circulation and northeast
15
monsoon have been significantly intensified and strengthened. The warming of the SVES and the circulation changes consequently affect the rainfall amount and the PIs over the SR.
2.5. Conclusions
In this study, the long-term changes of SOND rainfall over Vietnam for the period 1961–2012 were investigated. The 52-year rainfall trend indicated an obvious decrease/increase contrast to the north/south of 17°N in the coastal area of Vietnam. We also found that the increase in TC rainfall and non-TC rainfall contributed to the increase in rainfall amount over the SR. Moreover, similar rainfall trends were found in the PIs such as Rx1day and R50mm.
The increasing trend of SOND rainfall in the last 52 years was found to have a linkage with the changes in the SST over the SVES. This type of inter-annual autumn rainfall variations could be associated with the dominant La Niña-like pattern, which might alter large-scale circulations. The warming of the SVES resulted in the increase in the evaporation and 2-m specific humidity over the SVES. The added availability of moisture along with the strengthening of the northeasterly contributed to the moisture convergence over the SR, resulting in an increase in the deep convection over the SR. Our findings and analysis indicated that the inter-annual variation of SOND rainfall over Vietnam were associated with the local VES SST variations along with the La Niña-like pattern. Therefore, a proper representation of the SST as the lower boundary condition in the regional climate models could clarify the inter-annual variation of SOND rainfall over Vietnam. Thus, the relationship sensitivity between the SOND rainfall of Vietnam and the SST over the VES should be considered in a future study.
16
Chapter 3. Evaluation of Satellite Precipitation Products over Central Vietnam
3.1 Introduction
Rainfall is extremely important for human life, agriculture, and the global water cycle.
In recent years, satellite precipitation products have rapidly and significantly developed and thus, satellite precipitation estimation has emerged as a valuable source of data and information, especially for developing countries such as Vietnam, which do not have an extensive ground observation station’s network (Nguyen-Xuan et al., 2016). Satellites precipitation estimation products, with high temporal resolutions, can determine the spatial distribution of precipitation with great spatial and temporal accuracy. They have also proven to be capable of detecting and providing data over areas inaccessible for ground radar or other in situ instruments. However, despite these enormous advantages, they are still poor performance for several reasons.
According to Dinku et al. (2008), and Gao and Liu (2013), two types of radiometric observations are popularly used to create satellite precipitation products: (1) infrared imagery, which is known to have a high sampling frequency and produce precipitation estimates based on an indirect relationship with cloud-top temperature (i.e., the use of infrared algorithms usually faces challenges during estimations involving warm orographic rain) and (2) microwave imagery, which has fewer temporal sampling intervals but can provide precipitation estimates with higher accuracy due to the direct connection of the data with precipitation hydrometers. Owing to significant advancements in sensor technology development and new methods for combining data sources, temporal and spatial resolutions and measurement accuracies have increased tremendously. Recently, the combination of
17
microwave and infrared data has generated precipitation products with higher resolution, allowing for the use of various emerging algorithms for hydrological purposes (Tapiador et al., 2012).
To date, many studies have been conducted to evaluate satellite precipitation products for different areas around the world. Dinku et al. (2008, 2010) showed that some satellite precipitation products perform reasonably well on 10-day to monthly time scales, with a resolution of 2.5º over the complex topography of East Africa, but give poor estimation of the daily rainfall amount in Colombia. Thiemig et al. (2012) indicated that the Climate Prediction Center Morphing (CMORPH) algorithm, in particular, has proven its ability to replicate rainfall even with sparsely available ground data in African river basins.
Some studies agreed that satellite observation could not sufficiently reproduce precipitation in high mountain areas such as the Tibetan Plateau (Yin et al., 2008), subtropical Andes (Hobouchian et al., 2017), river basins in Southeast Asia (Ngo-Duc et al., 2013) and African coastal areas (Toté et al., 2015). In addition, the performance of satellite precipitation products has been reported to vary among different regions. Shen et al. (2010) showed that CMORPH performed better for spatial and temporal patterns of precipitation over China compared to the Tropical Rainfall Measuring Mission (TRMM) precipitation 3B42 version 6. In contrast, according to Vernimmen et al. (2012), and Jamandre and Narisma (2013), CMORPH had lower verification scores than TRMM over Indonesia and the Philippines, respectively. These results are also backed by Shige et al. (2013), who reported that the accuracy of the satellite estimations varied for different regions or countries as well as topographic profiles.
Very few studies have evaluated satellite precipitation products (SPDs) for Vietnam, especially in complex topographic regions and for heavy rainfall events. The Vietnam Gridded Precipitation Dataset (VnGP), a high-resolution grid dataset based on high density
18
surface rain gauge observations that was released in 2016 (Nguyen-Xuan et al., 2016), is thought to have the potential for comparative evaluations of satellite precipitation data, which is the most objective and comprehensive step towards data validation. Over the recent decades, the Vietnam Meteorology and Hydrology Administration (VNMHA) has recorded frequent severe floods in the Vietnam Central Coast (VCC). Heavy rainfall events over a region with horizontal extent can cause water-related disasters such as flooding and/or landslide. Thus it is necessary to assess the performance of the three SPDs in detecting heavy rainfall on widespread heavy rainfall (WHR) events. A number of studies have shown that the heavy rainfall events were related to either the tropical cyclones (TCs; Nguyen-Thi et al., 2012a), the inter-tropical convergence zone (ITCZ), the northeast monsoon (NM), or sometimes the combination of two or more factors interacting with topography (Yokoi and Matsumoto, 2008; Chen et al., 2012a, 2012b). The aim of this work was to evaluate SPDs using VnGP over the Vietnam Central Highlands (VCH) from May to August (MJJA), and the Vietnam Central Coast (VCC), where complex topography and different rainfall regimes were found, from September to December (SOND) (Nguyen-Le et al., 2015; Ngo-Thanh et al., 2018). Moreover, rivers in the VCC are fairly short and flowing steep creating high probabilities of flooding during WHR events. Therefore, WHRs caused by both TCs and ITCZ (hereafter called TI), and by NM were specifically taken into consideration in this study to provide useful information for hydrological applications, such as water management and flood warning, in the VCC.
3.2 Methods
3.2.1 Satellite precipitation datasets
The SPDs used in this study include (1) the CMORPH Version 1.0, (2) the Global Satellite Mapping of Precipitation (GSMaP) Reanalysis data Version 6.5133.0, and (3) the TRMM multi-satellite precipitation analysis 3B42 Version 7 (Table 3.1).
19
The CMORPH is a precipitation dataset with a high spatial and temporal resolution, which uses microwave observation data from several satellites combined with geostationary infrared satellite data (Joyce et al., 2004). In the CMORPH, the motion of cloud systems with propagation vectors was estimated using infrared data generated by geostationary satellites. Different bias correction methods were applied to the algorithm depending on its location, that is, either over land or ocean. The satellite estimates were adjusted against the Climate Prediction Center (CPC) daily rain gauge analysis for over-land data, and merged with the Global Precipitation Climatology Program pentad data for over-ocean data (Xie et al., 2007, 2017). In the current study, data from the CMORPH Version 1.0 (hereafter simply called CMORPH) with a 3-hourly bias-correction at a spatial resolution of 0.25ºwere used.
The GSMaP integrates passive microwave radiometer data with infrared radiometer data to provide precipitation estimates with high temporal (hourly) and spatial (0.1º) resolution. The product version MVK was produced based on a Kalman filter model that refines the precipitation rate propagation based on the atmospheric moving vector derived from two successive infrared images (Ushio et al., 2009). The reanalysis version of the GSMaP used the MVK algorithm with Japanese 55-year reanalysis 6-hourly data (Kobayashi et al., 2015) as ancillary data. This study used the latest updated GSMaP, Version 6.5133.0 (hereafter simply called GSMaP), since some noticeable improvements in the algorithm were implemented compared to Version 5, such as an orographic rainfall correction method for warm rainfall in coastal areas (Yamamoto and Shige, 2015).
Additionally, with combined estimations from multiple satellites based on both passive microwave and geostationary infrared data, the TRMM was computed for real-time monitoring and post real-time research (referred to as 3B42). In the TRMM 3B42 algorithm, the calibration and combination of microwave precipitation estimates were followed by the generation of infrared precipitation estimates based on the calibrated microwave data.
20
Infrared and microwave data were then combined before being rescaled on a monthly basis using the Global Precipitation Climatology Centre (GPCC) precipitation data. Further detailed information on the TRMM 3B42 Version 7 dataset can be found in Huffman and Bolvin (2013). In this study, data from the latest version of the TRMM 3B42 Version 7 (hereafter simply called TRMM) at 3-hour intervals were analyzed.
It should be noted that prior to this analysis, the CMORPH and TRMM were already bias-adjusted using the CPC dataset (Xie et al., 2007) and the GPCC dataset (Schneider et al., 2014), respectively, while the GSMaP was only based on satellite products. Thus, the monthly values from the CMORPH and TRMM were expected to be closer to the observed rainfall values at the area where rainfall stations are available.
3.2.2 Gauge precipitation data
To compare and evaluate the SPDs, the VnGP dataset (Nguyen-Xuan et al., 2016) and observational data obtained from rain gauge stations operated by VNMHA (Table 3.2), were used. VnGP is a daily gridded precipitation dataset that was produced from data collected by 481 rain gauges in Vietnam using the Spheremap interpolation method (Willmott et al., 1985). The VnGP dataset has two versions with spatial resolutions of 0.1º and 0.25º, covering the period from 1980 to 2010. In this study, the dataset at the resolution of 0.25º from 2001 to 2010 was used. In Vietnam, both daily rain gauge and VnGP data were collected and designated as 24-hour rainfall amounts that accumulated from 1200 UTC (1900 local time) of the previous day to 1200 UTC of the current day. For this reason, the daily-accumulated rainfall for the SPDs was computed for each grid on a particular day by summing the 1-hour or 3-hour rainfall data values for the same time span mentioned above before evaluations were processed.
To investigate the relationship between monsoonal wind speed and elevation that influences satellite precipitation estimations, the 925-hPa zonal wind from ERA-Interim
21
reanalysis data (Dee et al., 2011) with spatial resolution of 0.25o from European Centre for Medium-Range Weather Forecasts (ECMWF) and the topography data from the Global 30 Arc-Second Elevation (GTOPO30) dataset were used.
3.2.3 Widespread heavy rainfall (WHR) days
According to VNMHA, a WHR day over a region is defined when the total rainfall amount recorded exceeded 50 mm day-1 in at least half of available observed stations in that region. The synoptic features causing WHRs were also listed based on associated weather maps (VNMHA, 2018). To evaluate WHRs in the VCC, daily rainfall data collected during 2001–2010 at seven rain gauge stations from VNMHA were used (Fig. 3.1 and Table 3.2).
The quality of the rain gauge station data was checked using the 5-sigma rule as adopted by Nguyen-Xuan et al. (2016). In this study, a WHR in the VCC is a day on which the rainfall amount recorded exceeded 50 mm day-1 in at least four out of the seven stations. Thus the number of WHR days estimated in this study is slightly different from that reported by VNMHA because of the difference in the number of stations used. During 2001–2010, 154 WHR days caused by TI and 164 WHR days caused by NM (Table 3.3) were identified for the VCC in this study whereas 163 TI and 169 NM WHR days were reported by VNMHA, respectively.
3.2.4 Study area
Central Vietnam, in the Indochina Peninsula region, is divided into two typical climatic sub-regions by the Truong Son Mountains (Fig. 3.1). In the east side, the VCC has a long coastal line that opens to the east, meaning the rainfall regime is mainly dominated by the influences of the TI and monsoon systems (Matsumoto, 1997; Phan et al., 2009; Yen et al., 2011). Occasionally, WHR events occur as combinations of the above influences with the interaction with topography (Yokoi and Matsumoto, 2008; Chen et al., 2012a, 2012b).
On the other hand, located on the west side of the Truong Son Mountains, the VCH is