Original Article
Submitting author: Mitsuru Ida, Department of Anaesthesiology, Nara Medical
University, Kashihara, Japan
Factors associated with functional disability or mortality after elective noncardiac
surgery: A prospective cohort study
Mitsuru Ida, M.D.', Yusuke Naito, M.D.', Yuu Tanaka, M.D.', Satoki Inoue, MD;,
Masahiko Kawaguchi, M.D.'
Short title: Factors of postoperative functional disability
1 Assistant Professor, 2 ,3 Senior Lecturer, 4 Associate Professor, 5 Professor:
Department of Anaesthesiology, Nara Medical University, Kashihara, Japan
Correspondence to:
Mitsuru Ida
Mailing address: Department of Anaesthesiology , Nara Medical University, 840 Shijo- cho, Kashihara, Nara 634-8522, Japan
Tel: +81-(0)-744-29-8902 Fax: +81-(0)-744-23-9741 E-mail: [email protected]
Keywords: nutrition assessment; patient reported outcome measures; patient safety;
perioperative medicine; perioperative period
Trial Registration: University Hospital Medical Information Network,
UMIN000021671 (URL: https:/ /upload.urnin.ac.jp/cgi-open-
bin/ctr/ctr view .cgi ?recptno=R000023679).
Funding source
This study was funded by Nara Prefecture. The grant name is "Nara Medical University
Grant-in-Aid for a large-scale prospective cohort study on healthy life expectancy."
Role of the funding source
The funder had no role in the design and conduct of the study; collection, management,
analysis , and interpretation of the data; preparation, review, or approval of the
manuscript; and decision to submit the manuscript for publication.
Competing Interests: The authors declare no competing interests.
Tweetable Summary
Within one year after surgery, one in ten patients experienced postoperative functional
disability and one in twenty died. We identified potentially modifiable factors (obesity ,
poor nutritional status) associated with these adverse outcomes.
Abstract
Purpose:
Preoperative prediction of functional status after surgery is essential when practicing
patient-centred medicine. We aimed to evaluate the incidence and factors associated
with postoperative functional disability or all-cause mortality . Secondarily, we
described the trajectory of disability in this population.
Methods
Adults aged :2:55 years who underwent elective noncardiac surgery under general
anesthesia in a tertiary-care hospital were followed up 1 year after surgery. Pre- and
intraoperative factors associated with a composite outcome of postoperative functional
disability or all-cause mortality were assessed using a multiple logistic regression. The
sequential changes in the 12-item WHODAS2.0 score were described overall and
stratified by surgical invasiveness.
Results
Of the 2921 patients included , 293 experienced postoperative functional disability
(10.0%, 95% CI 8.9-11.1) and 124 died (4.2%, 95% CI 3.5-5 .0). In a multiple
regression model , potentially modifiable risk factors body mass index :2:30 kg/m• and
poor preoperative nutritional status were significantly associated with the primary
composite outcome, as well as non-modifiable factors such as age, preoperative co-
morbidities and blood loss volume. The changes of the 12-item WHODAS2.0 disability
score were large variability by surgical invasion and type of surgery such as arthroplasty.
Conclusion
Within one year after surgery, one in ten patients experienced postoperative functional
disability and one in twenty died. We identified potentially modifiable factors (obesity,
poor nutritional status) associated with these adverse outcomes.
Introduction
Several clinical and observational studies have demonstrated the impact of surgery and
anaesthetics on long-term mortalityu. However, relatively few studies have evaluated
long-term functional disability after surgery. A previous randomized control trial
including 2983 patients and a prospective cohort study with 702 patients revealed a high
prevalence of postoperative functional disability (POFD) and mortality 1 year after
surgery, with a range of 17.7-18.1 %•·· Several studies have reported that the patient' s
physical status -as defined according to the American Society of Anesthesiologists- and
the presence of frailty had different effects on the development of POFD•-'. However ,
these studies focused on specific conditions (e.g. frailty).
Preoperative prediction of POFD is essential when practicing patient-centred medicine.
Currently, no previous studies have comprehensively investigated factors associated
with POFD. Moreover , in addition to preoperative factors, surgical and anesthesia-
related factors such as blood loss volume and anaesthetic drugs may influence the
incidence of POFD and mortality.
We aimed to evaluate the incidence of POFD and all-cause mortality 1 year after
surgery and associated factors. Secondarily, we described the sequential changes in the
12-item World Health Organization Disability Assessment Schedule 2.0 (WHODAS
2 .0) score in the overall population and in subpopulations stratified by surgical
invasiveness.
Methods
Ethics Approval and Registration (December 31, 2015 University Hospital Medical
Information Network, UMIN000021671 (URL: https://upload.umin.ac.jp/cgi-open-
binlctr/ctr view.cgi?recptno=R000023679)
This prospective observational study was approved by the Nara Medical University
Institutional Review Board, Kashihara, Nara, Japan (Chairperson: Prof. M Yoshizumi,
Approval No. 1141 on December 25, 2015). All participants provided informed consent .
Inclusion and Exclusion Criteria
Individuals aged ~55 years who were scheduled for inpatient noncardiac surgery under
general anesthesia between April 1, 2016 and December 28,2018 in our hospital were
eligible for inclusion in our study. Patients were excluded if they had previously been
enrolled in this study (i.e., reoperation), had diseases requiring psychiatric treatment, or
required emergent surgery. Participating patients subsequently completed the
WHODAS 2.0 questionnaire, and those who were unable to complete the questionnaire
without assistance were excluded . Our hospital is a 992-bed academic medical center
with 15 operation rooms, including one hybrid operation room. All patients undergoing
elective surgery are evaluated twice in our preoperative assessment clinics. At the first
visit when surgery is confirmed, additional investigations such as cardiac
ultrasonography are petformed as needed, and instructions for medications prior to
surgery are provided. The second visit occurs a weekday before surgery, when both
patient and medication status are re-evaluated.•Research staff recruited patients from the
preoperative anesthetic clinic during the patients' second visit.
Data Collection
Before surgery, the patients' age, sex , body mass index (BMI), comorbidities
(symptomatic cerebral vascular disease, hypertension , ischemic heart disease, atrial
fibrillation , peripheral arterial disease, pacemaker or defibrillator implantation status,
asthma, respiratory function, diabetes, and malignant disease), serum albumin and
creatinine levels, and nutritional status were assessed. Their nutritional status was
assessed using the Mini Nutritional Assessment-short form (MNA-SF), with the total
score ranging from 0 to 14 points. The patients' nutritional statuses were defined as
follows: normal= 12-14 points, at risk= 8-11 points, and malnourished= 0-7 points' .
In addition, commonly used drugs (beta blockers, corticosteroids, and statins) were
checked because these drugs may have an important impact on postoperative mortality···.
We also collected data regarding anesthetic technique (inhalation agents or propofol),
the surgical procedure, duration of surgery, and intraoperative blood loss. Surgical
procedures were categorized using a previously reported operative stress score (OSS) as
follows: OSS 1, very low stress; OSS 2, low stress; OSS 3, moderate stress; OSS 4, high
stress; OSS 5, very high stress••. Additionally, any reoperation related to the primary
surgery and severe postoperative complications, including cerebral stroke, acute
myocardial infarction, prolonged mechanical ventilation, sepsis, pulmonary embolism,
and cardiac arrest, were assessed up to 30 days after surgery. Details of the included
variables are provided in Supporting Information Table S 1.
Primary and Secondary Outcomes
The primary outcome was a composite of the presence of POFD at one year after
surgery and all-cause mortality within one year after surgery. A recent consensus
guideline for patient-reported outcomes and a systematic review strongly recommend
that functional status should be assessed using the 12-item WHODAS 2.0 as a standard
clinical endpoint following hospital discharge")'. Functional disability was assessed
using the 12-item WHODAS2.0 questionnaire before surgery , at 3 months, and at 1 year
after surgery. The 12-item WHODAS 2.0, which is a disability assessment tool , consists
of six domains (cognition, mobility , self-care, interacting with other people , life
activities, and participation) with a total of 12 items scored. The patient is given five
choices per item and the score, depending on the choice, ranges f rom 1 (no diffic ulty) to
5 (extreme diffic ulty). According to the WHO guidelines, the total score ranges from
0% to 100% (where 0 =no disability; 100 =full disability)ll. At the time of initiating
this study, POFD was defined as follow s in accordance with previous studies: 1) A 12-
item WHODAS2.0 score ~25% at follow-up for patients with a preoperative 12-item
WHODAS2.0 score of <25%, and 2) an increase of 8% if the baseline disability score
was ~25%"·" . In 2020, "New onset clinically significant disability" was newly-defined
as "increase in WHODAS score of at least 5% to a final WHODAS score of at least
35%"•• therefore we used this definition for our study analysis . We provided the 12-item
WHODAS2.0 questionnaire and a stamped envelope to study patients three months and
one year postoperatively. If there was no response, research staff contacted patients or
their family by telephone. If there was no response after two telephone calls, the case
was classified as no response. Death was ascertained at 3 months and at 1 year after
surgery using medical records and responses from bereaved family. Our primary
outcome was a composite of POFD and all-cause mortality one year after surgery. Our
secondary outcome was the 12-item WHODAS2 .0 score.
Statistical Analysis
Continuous data regarding patient demographics are presented as mean (standard
deviation (SD)), median (interquartile range (IQR)) and categorical variables as number
(%).The incidence of POFD and mortality is presented as a 95% confidential interval
(CI), calculated with the Clapper-Pearson exact test. The score of the 12-item
WHODAS2.0 are presented as median with 25th to 75th percentiles. The logistic
regression models were developed to evaluate factors associated with POFD and death
using all variables evaluated in the pre- and intraoperative periods, except for the
preoperative 12-item WHODAS2.0 score. The bootstrap procedure repeated 1000 times
was employed for internal validation, which estimated the mean odds ratio and mean
area under the receiver operating characteristic curve. The 12-item WHODAS2.0 score
(median, IQR) was described over the study period overall, as well as stratified by
surgical invasiveness (OSS). In a post-hoc analysis, we described the WHODAS2.0
scores over the study period in a subgroup analysis of patients who had undergone joint
replacement surge1y. All data were analyzed using R (Statistical Environment Package),
version 4.0.3. The null hypothesis was rejected ifp < 0.05 except for the multiple
logistic regression for the primary outcome, where a p < 0.005 was used to account for
comparisons of multiple independent variables of interest.
Sample Size
When this study was planned, little evidence was available regarding the prevalence of
POFD and its related factors, however we assumed that the incidence of POFD was
approximately 10% based on a prior study•. When there were 32 covariates in multiple
logistic analysis, based on the minimal criterion of ten events per predictors we would
need at least 3200 patients with an event rate of 10% to have 320 cases of POFD and
mortality one year after surgery. Considering the dropout rate of 20% by 1 year follow-
up , the required minimum number of cases is 4000 in this study.
Missing Data
Regarding preoperative data, we excluded all patients with missing laboratory data from
the final analysis. Although the manual for the WHODAS provides guidelines on how
to handle missing data, we excluded these patients from the final analysis because
almost all patients lacked data on three or more items . In addition, during the follow-up
process, we contact subjects twice by phone to minimize missing data.
Results
During this study period, we identified 7117 patients over 55-years of age who were
scheduled to undergo elective surgery under general anesthesia. Of the 6,060 patients
who met our study criteria, 4402 patients answered the questionnaire without assistance
before surgery . Surgery was postponed or cancelled in 226 cases and preoperative data
were missing in 156 cases . Of the 4020 patients with complete preoperative data, 3799
patients proceeded with their scheduled surgery. The follow-up rate was 76.8 %
(2921/3799) and 119 patients provided insufficient data regarding the questions on the
12-item WHODAS2.0 (119/3799) (Figure 1). Multiple imputation was not petformed
and patients with missing data were excluded from the analysis. Finally , 878 patients
were excluded for missing data (759 did not respond and 119lacked at least one item of
the 12-item WHODAS2 .0) and 2921 patients (2797 survivors and 124 deceased) were
included in the analysis.
Patient characteristics are presented in Table 1. The prevalence of preoperative
malnutrition and risk for malnutrition was 4.6% and 31.2%, respectively (Table 1) . We
explored the characteristics of those who were lost to follow up vs those who were not
(Supporting Information Table S2). Several factors including young age, restrictive lung
disorders, nutritional disorders, and higher surgical invasiveness score were associated
with loss to follow -up.
Reoperation was petformed in 2.8% (82/2921) of cases, and severe postoperative
complications occurred in 1.7% (52/2921) of the cases (stroke n=15 , acute myocardial
infarction n=l, prolonged artificial respiration n=27, cardiac arrest n=5, sepsis n=6,
pulmonary embolism n=4, some patients have multiple complications.). Thirty day
mortality was 0.06% (2/2921).
One year after surgery, 293/2921 (10.0%, 95% CI 8.9-11.1) patients experienced
POFD and 124/2921 (4.2%, 95% CI 3.5-5.0) patients died. The incidence of our
primary outcome was 14.3% (Cl: 13.0-15 .6). Of these, there were 390/2921 (13.3%,
95% CI 12.1-14.6) and 20/2921 (0.6% , 95% CI 0.4-1.0) patients with POFD and who
died, respectively, at 3 months, with a total incidence of 14.0% (95% CI 12.8-15.3).
Age, BMI ~30 kg.rn-t, symptomatic cerebral vascular disease, restrictive lung disease,
steroid, serum albumin, nutritional status, and blood loss volume were statistically
significant factors associated with POFD at 1 year (Table 3). The mean area under the
receiver operating characteristic curve for the model was 0.73 (95% CI 0.70 to 0.75).
The results of changes in the WHODAS2.0 disability score after surgery, stratified by
surgical invasiveness are shown in Figure 2 and Supporting Information Table S3.
Patients who underwent surgeries with an OSS of 4-5 reported higher rates of disability
at the 12-items WHODSA2.0 one year after surgery in contrast with those who
underwent surgeries with an OSS of 1-3. (Figure 2 and Supporting Information Table
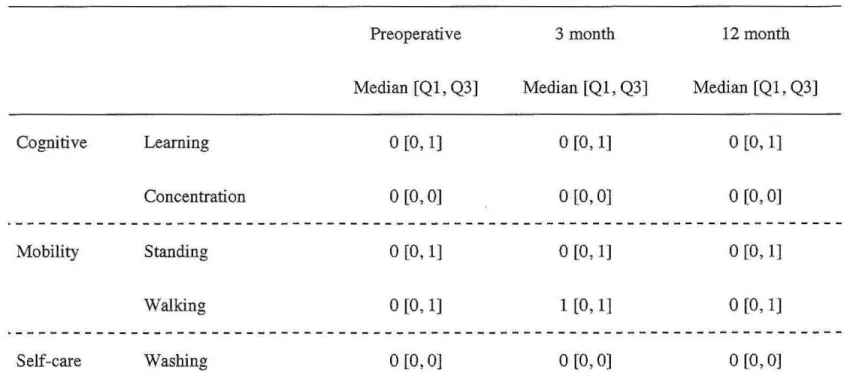
S3 and Figure 1). The sequential changes in the 12-item WHODAS-2.0 score overall
and in specific domains are shown in Table 2 and Supporting Information Figure 2, as
well as for those who underwent joint arthroplasty (n=156) and we observed similar
self-reported disability scores within each domain.
Discussion
Evaluating long-term POFD and mortality is important to achieve health and longevity,
especially in an increasingly aging population. One in seven older adults who
underwent noncardiac surgery with general anesthesia experienced either POFD or
mortality 1 year after surgery. Our data provided some factors related to POFD and
mortality, including both potentially modifiable and non-modifiable factors. In this
prospective observational study of 2921 patients, we observed that the 12-item
WHODAS 2.0 score changed at different time points, and the majority of patients
recovered to their preoperative score one year after surgery. These observations require
further study about the trajectory of disability after surgery.
In our cohort, 14.3% participants experienced POFD or died 1 year after surgery.
Although the prevalence of POFD and death 1 year after surgery varies among studies,
given the high prevalence observed in this study and the increasing number of surgeries
worldwide, POFD is an issue that needs to be resolved. Our study revealed surgical
factors associated with POFD and death included blood loss as well as patient-specific
characteristics . Among preoperative patient characteristics, age, and appropriately
managed co-morbidities are fixed factors that require careful perioperative management
but are difficult to change. In contrast, potentially modifiable factors for a poor outcome
included preoperative nutritional status and obesity. Although preoperative malnutrition
has been previously associated with postoperative complications, the relationship with
longer term POFD is less well understoodl7·" . In this study, we found that preoperative
nutritional status was independently associated with POFD and mortality. In recent
years, frailty-especially physical frailty-has been focused on potentially modifiable
factors, and its association with short-term and long-term outcomes after surgery has
been reported'·'·"·u. In this study , frailty was not assessed; however, the MNA-SF
assessment includes the evaluation of psychological stress and neuropsychological
factors, which play a role in the assessment of physical and cognitive frailty ... .
Moreover, the benefit of preoperative nutritional support on postoperative outcomes has
been widely recognized; however, there are many discrepancies in the duration of
intervention and the types of nutrients"·'"'. Future studies are needed to identify strategies
to improve preoperative malnutrition, and whether these interventions improve patient-
reported outcomes, including POFD, without worsening disease prognosis.
We assessed the sequential score of the 12-item WHODAS2.0; however , the median
shown in this study were not able to capture the presence of different trajectories of
functional recovery after surgery - with some cases being associated with improved
function and others with decreased function. In fact, there were different postoperative
courses between patients underwent joint surgery and entire patients . In the future, a
large study is needed to understand functional disability after specific surgeries .
In our cohort, the incidence of complications and mortality after surgery were
relatively low. This may have resulted from several factors: i) we evaluated only serious
postoperative complications, such as diseases requiring intensive care or reoperation
classified as IIIb or IV according to the Clavien- Dindo classification", ii) 76.5% of the
surgeries were of lower invasiveness (OSS 1- 3), and iii) all patients undergoing elective
surgery were evaluated twice in our preoperative assessment clinics. The impact of our
institution's unique preoperative system on the low complication rate has not been
investigated and the exact reason has been unclear; however, it may be explained by the
change of surgical procedures to minor ones and the preoperative patients' optimization
based on information provided in our preoperative assessment clinics.
Our study has several limitations . First, this study included only patients who
underwent surgery and were able to fill in the questionnaire by themselves.
Furthermore, patients who lacked complete data were excluded from the analysis. Our
results need to be interpreted with caution because we were more likely to exclude
patients who were more vulnerable or cognitively impaired and who may be more likely
to die or develop a new disability after surgery. Moreover, as a post hoc analysis,
background of patients who lost contact during 1 year is shown in Supporting
Information Table S2, which includes factors such as younger age, restrictive lung
disorders, poor nutritional status, and higher surgical invasiveness. The exact reason
why younger age was a significant factor has been unclear; however, the incidence of
14.3% may be underestimated because some covariates were also associated with
POFD. These facts explain that missing data may not have occurred at random and may
have introduced bias. Second, we only examined the predictive pelformance our model
and the external validity was not assessed. Third, postoperative functional status is
affected by factors other than those evaluated in this study. Finally, the generalisability
of our findings may be limited due to the nature of a single-centre study.
In conclusion, in a large-scale prospective observational study, we found that one in
seven patients aged ~55 years who underwent elective noncardiac surgery with general
anesthesia experienced POFD or mortality 1 year postoperatively, and potentially
modifiable factors, including nutritional status and obesity, were related to these adverse
outcomes. As the number of surgeries increases in an aging population , preoperative
risk assessment and provision of postoperative outcomes should be included in shared
surgical decision-making and informed consent to achieve health and longevity. Future
intervention trials are needed to evaluate whether preoperative patient optimization ,
including nutritional intervention, can improve long-term functional status.
Trial Registration: University Hospital Medical Information Network,
UMIN000021671 (URL: https://upload.umin.ac.jp/cgi-open-
bin/ctr/ctr view .cgi ?recptno=R000023679).
Funding source
This study was funded by a grant from Nara Prefecture: "Nara Medical University
Grant-in-Aid for a large-scale prospective cohort study on healthy life expectancy."
Role of the funding source
The funder had no role in the design and conduct of the study; collection, management,
analysis, and interpretation of the data; preparation, review, or approval of the
manuscript; and decision to submit the manuscript for publication.
Acknowledgements
We would like to thank Editage (www .editage.com) for English language editing.
Hisako Yoshida (Department of Medical Statistics, Osaka City University Graduate
School of Medicine, Osaka , Japan), Kanae Takahashi (Department of Medical
Statistics, Osaka City University Graduate School of Medicine, Osaka, Japan) advised
and assisted in statistical planning and analysis.
Competing Interests: The authors declare no competing interests .
References
1. Yoo S, Lee HB, Han W, et al. Total intravenous anesthesia versus inhalation
anesthesia for breast cancer surgery: A retrospective cohort study. Anesthesiology 2019;
130: 31-40.
2. Mcisaac Dl, Wong CA, Huang A, Moloo H, van Walraven C. Derivation and
validation of a generalizable preoperative frailty index using population-based health
administrative data . Ann Surg 2019; 270: 102-8.
3. Myles PS, Bellomo R, Corcoran T, et al. Restrictive versus liberal fluid therapy for
major abdominal surgery. N Engl J Med 2018; 378: 2263- 74.
4. Mcisaac D/, Taljaard M, Bryson GL, et al. Frailty and long-term postoperative
disability trajectories: a prospective multi centre cohort study. Br J Anaesth 2020; 125:
704--11.
5. Shulman MA, Myles PS, Chan MTV, et al. Measurement of disability-free survival
after surgery. Anesthesiology 2015; 122: 524-36.
6. Sato M, Ida M, Naito Y, Kawaguchi M. The incidence and reasons for canceled
surgical cases in an academic medical center: a retrospective analysis before and after
the development of a preoperative anesthesia clinic. J Anesth. 2020; 34:892-7.
7. Kaiser MJ, Bauer JM, Ramsch C, et al. Validation of the Mini Nutritional
Assessment short-form (MNASF): a practical tool for identification of nutritional status.
J Nutr Health Aging 2009; 13: 782-8.
8. Xiong X, Wu Z, Qin X, Huang Q, Wang X, Qin J, LuX. Statins reduce mortality
after abdominal aortic aneurysm repair: A systematic review and meta-analysis. J Vase
Surg. 202l:S0741-5214(21)01027-2.
9. Mohammad Ismail A, AhJ R, Forssten MP, et al. Beta-Blocker Therapy Is Associated
With Increased 1-Year Survival After Hip Fracture Surgery: A Retrospective Cohort
Study. Anesth Analg. 2021 Jul 14. doi: 10.1213/ANE.0000000000005659.
10. Shinall MC Jr, Arya S, Youk A, et al. Association of preoperative patient frailty and
operative stress with postoperative mortality. JAMA Surg 2020; 155: e194620.
11. Ahola RE, Bennett-Guerrero E, Kent ML, et al. American Society for Enhanced
Recovery and Perioperative Quality Initiative joint consensus statement on patient-
reported outcomes in an enhanced recovery pathway. Anesth Analg 2018; 126: 1874-
82.
12. Moonesinghe SR, Jackson AIR, Boney 0, et al. Systematic review and consensus
definitions for the standardised endpoints in perioperative medicine initiative: patient-
centred outcomes. Br J Anaesth 2019; 123: 664-70.
13. World Health Organization. Measuring Health and Disability: Manual for WHO
Disability Assessment Schedule (WHODAS 2.0). Geneva. 2010.
https://apps.who.int/iris/bitstream/handle/10665/43974/9789241547598 eng.pdf?seque
nce==1&isAllowed=y (accessed 10/12/2020).
14. Andrews G, Kemp A, Sunderland M, Von Korff M, Ustun TB. Normative data for the
12 item WHO Disability Assessment Schedule 2 .0. PLoS One 2009; 4: e8343.
15. Mcisaac DI, Taljaard M, Bryson GL, et al. Frailty as a predictor of death or new
disability after surgery: A prospective cohort study. Ann Sur 2020; 271: 283-9.
16. Shulman MA, Kasza J, Myles PS. Defining the minimal clinically important
difference and patient-acceptable symptom state score for disability assessment in
surgical patients. Anesthesiology 2020; 132: 1362- 70.
17. Levett DZH, Edwards M, Grocott M, Mythen M. Preparing the patient for surgery to
improve outcomes. Best Pract Res Clin Anesthesiol 2016; 30: 145-57.
18. Weimann A, Braga M, Carli F, et al. ESPEN guideline: Clinical nutrition in surgery.
Clin Nutr 2017; 36: 623-50 .
19. Daniels SL, Lee MJ, George J, et al. Prehabilitation in elective abdominal cancer
surgery in older patients: Systematic review and meta-analysis. BJS Open 2020; 4:
1022-41.
20. Lee B, Han HS, Yoon YS, Cho JY, Lee JS. Impact of preoperative malnutrition,
based on albumin level and body mass index, on operative outcomes in patients with
pancreatic head cancer. J Hepatobiliary Pancreat Sci 2020 31 October; doi:
10.1002/jhbp.858.
21. McKechnie T, Bao T, Fabbro M, Ruo L, Serrano PE. Frailty as a predictor of
postoperative morbidity and mortality following liver resection. Am Surg 2020; 87:
648-54 .
22. Tjeertes EKM, van Fessem JMK, Mattace-Raso FUS, et al. Influence of frailty on
outcome in older patients undergoing non-cardiac surgery - A systematic review and
meta-analysis. Aging Dis 2020; 11: 1276-90.
23. Soysal P, Veronese N, Arik F, et al. Mini nutritional assessment scale-short form
can be useful for frailty screening in older adults. Clinical Interv Aging 2019; 14: 693-
9.
24. Gillis C, Buhler K, Bresee L, et al. Effects of Nutritional Prehabilitation, With and
Without Exercise, on Outcomes of Patients Who Undergo Colorectal Surgery: A
Systematic Review and Meta-analysis. Gastroenterology. 2018; 155:391-410.e4.
25. Cao Y, HanD, Zhou X, et al. Effects of preoperative nutrition on postoperative
outcomes in esophageal cancer: a systematic review and meta-analysis . Dis Esophagus .
2021 May 10:doab028. doi: 10.1093/dote/doab028.
26. Dindo D, Demartines N, Clavien PA. Classification of surgical complications: A
new proposal with evaluation in a cohort of 6336 patients and results of a survey. Ann
Surg 2004; 240: 205-13.
Tables
Table 1 Demographics of patients who underwent noncardiac surgery with general anesthesia with and without postoperative functional
disability or mortality. The values are represented as mean (SD) or number(%) .
Presence of Mean difference
Absence of
postoperative (95% confidence
postoperative functional
Characteristic Total functional interval) P value
disability or mortality disability or
(-) mortality ( +)
N = 2921 N =417 N =2504
Age(yr) , mean (SD) 69.6 (7 .5) 72.6 (7 .4) 69.1(7 .4) (7 .4) 3.4 (2.7 to 4.2) <0 .001
Male, nltotal N (%) 1631(55.8%) 249(59.7%) 1122(44.8%) 0.09
Body mass index(kg/m'), mean(SD) 23.3 (3.6) 232(3.8) 23.4 (3.5) -1.9 (-5.7 to 0.1) 0.3
categorical data 0.002
< 18.5, nltotal N (%) 189(6.4%) 39(9.3%) 150(5.9%)
18.5~, < 25, n/total N (%) 1879(64.3%) 264(63.3%) 1615(64.5%)
25~ , < 30, nltotal N (%) 738(252%) 89(21.3 %) 649(25.9%)
30~ , nltotal N (%) 115(3.9%) 25(6 .0%) 90(3.6%)
Comorbidity
Symptomatic cerebral vascular disease,
nltotal N (%) 273(9.3 %) 65(15/5%) 208(8.3 %) <0.001
Hypertension, nltotal N (%) 1566(53 .6%) 248(59.5 %) 1318(52.6%) 0.01
Ischemic heart disease, nltotal N (%) 208(7.1%) 45(10.8%) 163(65%) 0 .002
Atrial fibrillation , nltotal N (%) 84(2.8%) 17(4.1 %) 67(2.7%) 0.15
Peripheral arterial disease, n/total N (%) 35(12%) 7 (1.7%) 28(1.1 %) 0.46
Pacemaker or defibrillator, n/total N (%) 15(05%) 5(1.2%) 10(0.4%) 0.08
Asthma, n/total N (%) 127(4.3%) 17(4 .1 %) 110(4.4%) 0.87
Diabetes, n/total N (%) 548(18.7%) 109(26.1 %) 439(17 .5%) <0.001
Malignant disease, n/total N (%) 1834(47 .3 %) 229(54.9%) 1154(46.0%) <0.001
Respiratory function <0.001
Normal, n/total N (%) 2107(72.1 %) 258(6 1.8%) 1814(72.4%)
Obstructive lung disease, n/total N (%) 675(23.1 %) 109(26.1 %) 566(22.6%)
Restrictive lung disease, n/total N (%) 174(059%) 50(12.0%) 124(5.0%)
Medication
B-blocker, n/total N (%) 186(6.3%) 37(8.9%) 149(6.0) 0.03
Steroid, n/total N (%) 94(32%) 30(7.2%) 64(2.6%) <0.001
Statin, n/total N (%) 536(18.3%) 75(18.0) 461(18.4%) 0.88
Laboratory data
Serum albumin (g/dL) , mean (SD) 42(0.3) 4.0(0.4) 42(0.3) -0.1 ( -0.2 to -0.1) <0.001
Serum creatinine (mg/dL) , mean (SD) 0.92(0.92) 1.11(1.20) 0.90(0.86) 0.2(0.1 to 0.3) <0.001
Nutritional status <0.001
Normal , n/total N (%) 1873(66.9%) 213(51.0%) 1660(66.2%)
At risk of malnutrition , n/total N (%) 912(31.2%) 166(39.8%) 746(29.8%)
Malnutrition , n/total N (%) 136(4 .6%) 38(9.1 %) 98(3.9%)
Preoperative the 12-items WHODAS2.0 10 .9(9 .I to 12.6)
score, mean (SD) 14.5(17 .5) 23.9(18 .8) 13.0(16.8) <0.001
Anesthetic drug <0.001
Propofol, n/total N (%) 827(28.3%) 89(21.3%) 738(29.4%)
Inhalation agents, n/total N (%) 2094(71.6%) 328((78.6%) 1766(70.4%)
Duration of surgery(min), mean (SD) 203(142) 224 (167) 199(137) 25(10 to 39) 0.001
Blood loss volume(mL), mean (SD) 146(480) 235 (816) 133 (397) 101(51 to 150) <0 .001
categorical data <0 .001
0~ , < 99 , n/total N (%) 2080(71.2%) 252(60.4%) 1828(73 .0%)
100~, < 499 , n/total N (%) 629(21.5%) 120(28.8%) 509(20.3%)
500~, n/total N (%) 212(7 .2%) 45(10 .8%) 167(6.7%)
Operative stress score 0.003
1, n/total N (%) 204(6.9%) 27(65%) 177(7.1 %)
2, n/total N (%) 822(28.1 %) 98(23.5%) 724(28.9)
3, n/total N (%) 1214(415 %) 168(40.3%) 1046(41.8%)
4, n/total N (%) 530(18.1 %) 90(21.6) 440(17.6%)
5 , n/total N (%) 151(5.1 %) 34(8.2%) 117(4.7%)
WHODAS 2.0 =World Health Organization Disability Assessment Schedule 2.0; SD = standard deviation
Table 2. Sequential changes in the 12-item World Health Organization Disability Assessment Schedule 2.0 score on the specific
domains in total patients and patients who had arthroplasty (knee and hip)
Total patients (N = 2797)
Cognitive Learning
Concentration
Mobility Standing
Walking
Self-care Washing
Preoperative
Median [Q1, Q3]
0 [0, 1]
0 [0 , 0]
0 [0, 1]
0 [0 , 1]
0 [0, 0]
3 month
Median [Q1 , Q3]
0 [0 , 1]
0 [0, OJ
0 [0 , 1]
1 [0 , 1]
0 [0 , 0]
12month
Median [Ql , Q3]
0 [0, 1]
0 [0, 0]
0 [0, 1]
0 [0 , 1]
0 [0 , 0]
Dressing
Getting along Dealing with people
Maintaining friendship
Life activities Day to day work
Household
responsibilities
Participation Community activities
Emotional impact
Total(%)
Q 1, first quartile; Q3, third quartile
0 [0, 0]
0 [0, 0]
0 [0, 0]
0 [0 , 0]
0 [0, 1]
0 [0, 1]
1 [0, 2]
8.3 [2.7, 19.4]
0 [0 , 0]
0 [0, 0]
0 [0, 0]
0 [0, 0]
0 [0, 1]
0 [0, 1]
1 [0, 1]
11.1 [2.7, 25.0]
0 [0, 0]
0 [0 , 0]
0 [0, 0]
0 [0, 1]
0 [0, 1]
0 [0, 1]
1 [0, 1]
8.3 [0.0 , 25.0]
Each item has the score 0 to 4. Total score is changed to percentage using following formula, (sum score I 48)* 100.
Arthroplasty (knee and hip) (N = 156)
Cognitive Learning
Concentration
Mobility Standing
Walking
Self-care Washing
Dressing
Getting along Dealing with people
Preoperative
Median [Q1, Q3]
1 [0, 2]
0 [0, 02]
2 [1 , 3]
3 [1, 3]
0 [0, 1]
1 [0, 1]
0 [0, 0]
3 month
Median [Q1, Q3]
1 [0 , 2]
0 [0, 1]
1 [0, 2]
1 [1' 2]
05 [0 , 1]
0 [0, 1]
0 [0, 0]
12 month
Median [Q1, Q3]
0 [0, 1]
1 [0, 1]
1 [0, 2]
1 [0 , 2]
0 [0, 1]
0 [0, 1]
0 [0, 0]
Maintaining friendship
Life activities Day to day work
Household
responsibilities
Participation Community activities
Emotional impact
Total(%)
Q1, first quartile; Q3, third quartile
1 [0, 0]
1 [0, 1]
1 [1, 1]
1 [0, 2]
1 [0, 2]
29.1 [19.4, 44.4]
0 [0, 1]
1 [0, 1]
1 [1 , 1]
1[1, 1]
1 [0, 2]
22.2 [13.8, 36.1]
0 [0, 0]
0 [0, 1]
1 [0, 1]
1 [0 , 1]
1 [0 , 1]
19.4 [8.3 , 33.3]
Each item has the score 0 to 4. Total score is changed to percentage using following formula, (sum score I 48)*100.
Table 3 Multiple logistic regression analysis for predicting patients with postoperative functional disability or mortality at 1 year after
surgery
Odds ratio (99.5% Confidence
p value interval)
Age(yr) 1.06 (1.03 to 1.08) <0.001
Female 1.06 (0.68 to 1.55) 0.63
Body mass index(kg/m2)
< 18.5 1.00 (0.51 to 1.83) 0.99
18.5 <, <25 1
25 < , < 30 0.92 (0.60 to 1.41) 0.52
30< 2.56 (1.05 to 5.1 9) 0.001
Comorbidity
Symptomatic cerebral vascular disease 1.94 (1.02 to 3.22) <0.001
Hypertension 0.95 (0.70 to 1.41) 0.71
Ischemic heart disease 1.37 (0.72 to 2.39) 0.14
Atrial fibrillation 1.07 (0.43 to 2.46) 0.79
Peripheral arterial disease 0.76 (0.06 to 2.77) 0.57
Pacemaker or defibrillator 2.27 (0.00 to 20.7) 0. 17
Asthma 0.80 (0.30 to 2.03) 0.43
Diabetes 1.36 (0.9 1 to 2.1 0) 0.02
Malignant disease 1.27 (0.92 to 1.74) 0.04
Respiratory function
Normal 1
Obstructive lung disease 1.07 (0.72 to 1.55) 0.65
Restrictive lung disease 1.80 (1.03 to 3.07) 0.003
Medication
~-blocker 0.98 (0.50 to 1. 78) 0.95
Steroid 2.77 (1.21 to 5.28) <0.001
Statin 0.85 (0.50 to 1.26) 0.27
Laboratory data
Serum albumin (g/dL) 0.55 (0.35 to 0.85) <0.001
Serum creatinine (mg/dL) 1.14 (0.97 to 1.33) 0.008
Nutritional status
Normal 1
At risk of malnutrition 1.55 (1.06 to 2.15) 0.001
Malnutrition 2.30 (1.09 to 4.73) 0.002
Anesthetic drug
Propofol 1
Inhalation agents 1.20 (0.79 to 1.91) 0.21
Duration of surgery( min) 1.00 (0.99 to 1.00) 0.62
Blood loss volume(mL)
o<, < 99 1
100 <, <499 1.56 (1.01 to 2.36) 0.001
5oo< 1.67 (0.84 to 3.30) 0.02
Operative stress score
1 1
2 1.07 (0.50 to 2.53) 0.80
3 0.98 (0.45 to 2.38) 0.95
4 1. 12 (0.55 to 2. 72) 0.69
5 1.14 (0.97 to 1.33) 0.71
NA, Not available
Figure Legends
Figure 1 Flowchart of patient selection for noncardiac surgery with general anesthesia .
Figure 2 The sequential changes in the 12-item WHODAS2.0 score according to the
Operative Stress Score in patients who underwent noncardiac surgery with general
anesthesia.
WHODAS, World Health Organization Disability Assessment Schedule.
The 12-item WHODAS2.0 score in patient underwent surgeries with OSS2 and in
overall patients followed the same trajectory; therefore , the graph shows the overall
trend.
~
6060 eligible patients I
53 were not explained the study (isolation for infectious disease n=4,
,.. absence of researchers n=49)
6007 were explained the study I
495 did not fill in the questionnaire independently 1091 refused to participate in the study
19 did not have clear reasons for refusal
...
4402 patients included I
,.. 1226 did not have surgery I
4176 patients included I
91 did not undergo respiratory function test 65 patients with incomplete data
-The 12-item WHODAS 2.0 n= 16
-Mini Nutritional Assessment-Short Form n=46 - Serum albumin n=23
... ,..
4020 patients included
(non-cardiac surgery n=3881 [general anesthesia n=3799, spinal anesthesia n=82], cardiac surgery n= 139)
I 3 799 patients undergoing non cardiac surgery with general anesthesia Three months after surgery
4 77 did not provide postoperative data 73 had incomplete postoperative data
,..
13249 patients including 20 who died within three months after surgery I
One year after surgery
282 did not provide postoperative data 46 had incomplete postoperative data
...
,.
2921 patients including 124 who died from 3 months to 1 year after surgery
(survival n=2797; death n= 124)
ZI
i3
(])1
4--1
0
(]) 0 10
~
8
r/Jz 8
'"de/) (])~
.E Q 6
.~ 0
(]) ~
~ ~ 4
a
02
.,...
'"d
s 0
,..q
(])~
Preoperative 3 months 12 months
oss 1 oss 2 oss 3 oss 4
Total
oss 5
Hypertension
Ischemic heart disease Atrial fibrillation
Peripheral arterial disease Asthma
Respiratory function
Obstructive respiratory dysfunction Restrictive respiratory dysfunction Dialysis
Diabetes
Pacemaker or defibrillator Commonly used drugs P-Blocker
Corticosteroid Statin
Patients taking medication
Patients with a history of or scheduled CABG or PCI
Patients diagnosed chronic atrial fibrillation as per electrocardiogram fmdings Patients diagnosed or scheduled for surgery
Patients taking medications
Patients with< 70% forced expiratory volume 1.0 (s)%
Patients with < 80% vital capacity
Patients on hemodialysis or peritoneal dialysis
Patients taking oral diabetes drugs or injecting insulin Patients with an implantable pacemaker or defibrillator
Patients receiving oral or intravenous beta blockers Patients receiving oral or intravenous corticosteroids Patients receiving statins
CABG coronary artery bypass graft, PCI percutaneous coronary intervention
Age(yr) Female
Body mass index(kg/m2)
Comorbidity
< 18.5 18.5;§;, < 25 25 ;§; ,
<
30 30;§;Symptomatic cerebral vascular disease Hypertension Ischemic heart disease Atrial fibrillation Peripheral arterial disease Pacemaker or defibrillator Asthma
Odds ratio (95% Confidence interval) 0.98 (0.97 to 0.99)
1.04 (0.87 to 1.23)
0. 71 (0.50 to 1.00) 1
0.98 (0.81 to 1.19) 1.57 (1.11 to 2.22)
1.26 (0.98 to 1.61) 0.95 (0.81 to 1.13) 1.20 (0.88 to 1.62) 1.21 (0.78 to 1.88) 1.18 (0.59 to 2.33) 1.53 (0.65 to 3.63) 0.89 (0.60 to 1.31)
p value 0.02 0.64
0.05
0.88 0.01
0.06 0.61 0.23 0.37 0.63 0.32 0.56
Normal 1
Obstructive lung disease 1.05 (0.87 to 1.28) 0.55
Restrictive lung disease 1.53 (1.15 to 2.03) 0.003 Medication
~-blocker 0.94 (0.67 to 1.30) 0.71
Steroid 0. 70 (0.44 to 1.12) 0.14
Statin 0.98 (0.80 to 1.22) 0.91
Laboratory data
Serum albumin (g/dL) 0.68 (0.55 to 0.85) 0.001
Serum creatinine (mg/dL) 1.01 (0.93 to 1.09) 0.79
Nutritional status
Normal 1
At risk of malnutrition 1.52 (1.06 to 2.18) 0.02
Malnutrition 1.21 (1.00 to1.45) 0.04
Preoperative WHODAS2.0 weighted score 1.01 (1.00 to 1.01) <0.001
Anesthetic drug
Propofol 1
Inhalation agents 1.04 (0.86 to 1.25) 0.68
100~, < 499 0.95 (0.77to 1.19)
500~ 0.93 (0.65 to 1.33) Operative stress score
1 1
2 0.70 (0.52 to 0.95) 3 0.60 (0.44 to 0.82) 4 0.75 (0.53 to 1.04) 5 0.49 (0.30 to 0.80)
WHODAS 2.0; World Health Organization Disability Assessment Schedule 2.0
0.7 0.69
0.02 0.002
0.09 0.005
Operative stress score Median [Q1 , Q3] Median [Q1 , Q3] Median [Ql , Q3]
1 (n = 204) 8.33 [2.77, 13.8] 8.33 [2.77, 19.4] 5.55 [0.0, 22.2]
2 (n = 822) 8.33 [2.77, 22.2] 11.1 [2.77, 25.0] 8.33 [0.0, 22.2]
3 (n = 1214) 8.33 [2.77, 25.0] 13.8 [2.77, 27 .7] 8.33 [0.0, 25.0]
4 (n = 530) 5.55 [0.0, 14.5] 11.1 [2. 77' 22.2] 8.33 [0.0, 25.0]
5 (n = 151) 5.55 [2.77, 16.6] 13.8 [5.55, 27.7] 8.33 [0.0, 27.7]
Total (n = 2921) 8.33 [2.77, 19.4] 11.1 [2.77, 25.0] 8.33 [0.0, 25.0]
WHODAS 2.0, World Health Organization Disability Assessment Schedule 2.0; Q1 , first quartile; Q3, third quartile
80 0 0 0 0 0 0 0 0 0 0 80 0 0 0 0 0 0
Q.) 0 0 0 Q.) 0 Q.) 0
;....; 0 0 0 0 0 0 ~ 80 0 0 ;....; 0 0 0 0
0 0 0 0 0 0 0 0 0 0 0
() 0 0 0 ( ) 0 0 0 (.) 0 0 0
60 0 0 0 80 0 0 0
1::/.l 0 0 1::/.l ----.--- 1::/.l 0 0 0
0 0 0 ----.--- 0
0
0 0 00
40 00
-.---0 ' ----.---·-
- . - - - '·-
0·-
' '-
'-
0-
' '...
40·-
0·-
40 ' '{i
~ro
- . - - -0 ' ' ' ~ro
1::/.l
B
1::/.l ' 1::/.l 'g
·- g ·-
20g ~ ·- g
Q
20g Q Q
20B
0 0 ~ 0
0 3 12 0 3 12 0 3 12
Months after surgery Months after surgery Months after surgery D: Operative stress score 3 E: Operative stress score 4 F: Operative stress score 5
100 100
0 0 0 0 0 0 0
0 0 0
0 0
0 0 0 0 0 0
0 0 0 80 0
0 0 0 0 0
(j,) 80 0 0 0 0 0 0 Q.) 80 0 0 0 0 (j,) 0
;....; 0 0 0 ;....; ;....; 0
0 0 0 0 0 0 0 0 0 0 0 0 0 0 ----.---
( ) 0 0 0 () 0 0 () 0
0 0 0 0 0 80 0 '
1::/.l 1::/.l 1::/.l ----.---
80 0 - . - - - 80 0 0 0
' '
0
00
0 0 0 0 0 0 - . - - -0 00
0 0 0 ' ' '·- - ·- -
0 0 '·- -
0 ' '·- {i
40 ' '...
~ro
40 0 0 0 0 ' '·- {i
40 - . - - -0 0 ' ' ' '1::/.l 1::/.l - . - - - '
1::/.l '
B
' ' '8 Q
·- Q
20... .
... 'Q g Q
20I B B Q
200
0 0 0
0 3 12 0 3 12 0 3 12
Months after surgery Months after surgery Months after surgery
0 0
30
Q) 60
;...
Cl) 25
0
() ;...
<Zl () 0
c
<Zl 20... c
...
...
40.
....D ,...
ro
...
<Zl .D 15
...
ro~
...
<Zl~
20 10
5
0 0
0 3 12
0 3 12
Months after surgery Months after surgery