A pathological clarification of sepsis-associated disseminated intravascular coagulation based on comprehensive coagulation and fibrinolysis function
Tomoko Onishi,1 Keiji Nogami,1 Takashi Ishihara,1 Satoki Inoue,2 Masahiko Kawaguchi,2 Kenji Nishio,3 Hidetada Fukushima, 4 Hiroshi Kobayashi,5 Itsuto Amano,6 Toshiya Nishikubo,7
Masaharu Yamasaki,8 Masato Kasahara,9 Midori Shima1
Department of 1Pediatrics, 2 Anesthesiology, 3General Medicine, 4Emergency and Critical Care Medicine, 50bstetrics and Gynecology, 6Second Department of Internal Medicine, 'Neonatal Intensive Care Unit, 8Division of Clinical Laboratory, 9 Clinical Research Center, Nara Medical University, Kashihara, Nara, Japan
Running title: Coagulation and fibrinolysis in sepsis-associated DIC Types of article: Original Article
Word counts: Abstract: 249, Text: 4,302, Figures: 5, Tables 4, References: 40
Corresponding Author:
Keiji Nogami, M.D., Ph.D.
Department of Pediatrics, Nara Medical University, 840 Shijo-cho, Kashihara, Nara 634-8522, Japan.
Tel.: +81-744-29-8881; Fax.: +81-744-24-9222 E-mail: [email protected]
Abstract
Introduction: The functional dynamics of coagulation and fibrinolysis in patients with disseminated intravascular coagulation (DIC) vary due to the pathology and severity of various underlying diseases. Conventional measurements of hemostasis such as thrombin-antithrombin complex, plasmin-u2-plasmin-inhibitor complex, and fibrinogen-fibrin degradation products may not always reflect critical pathophysiologic mechanisms in DIC. Aim: To clarify the pathology of sepsis- associated DIC using assessment of comprehensive coagulation and fibrinolysis. Method: Plasma samples were obtained from 57 patients with sepsis-associated DIC at the time of initial diagnosis.
Hemostasis parameters were quantified by clot-fibrinolysis waveform analysis (CFWA) and thrombin/plasmin generation assays (TIP-GA). The results were expressed as ratios relative to normal plasma. Results: CFWA demonstrated that the maximum coagulation velocity ([minl [)ratio modestly increased to median 1.40 [min-max; 0.10-2.60] but the maximum fibrinolytic velocity ([FL-minl[) ratio decreased to 0.61 [0-1.19]. TIP-GA indicated that the peak thrombin (Th-Peak) ratio moderately decreased to 0. 71 [0.22-1.20], whereas the peak plasmin (Pim-Peak) ratio substantially decreased to 0.35 [0.02-1.43]. Statistical comparisons identified a correlation between [mini[ and Th-Peak ratios (p=0.55, P<0.001), together with a strong correlation between [FL-minl[
and Pim-Peak ratios (p=0.71, P<0.001), suggesting that CFWA reflected the balance between thrombin and plasmin generation. With [minl[ and [FL-minl[ ratios, DIC was classified as follows;
coagulation-predominant, coagulation/fibrinolysis-balanced, fibrinolysis-predominant, and consumption-impaired coagulation. The majority of patients in our cohort (80.7%) were coagulation-predominant. Conclusion: A pathological clarification of sepsis-associated DIC based on the assessment of coagulation and fibrinolysis dynamics may be useful for the hemostatic monitoring and management of optimal treatment in these individuals.
Keywords: disseminated intravascular coagulation, sepsis, coagulation, fibrinolysis, monitoring
What is known on this topic?
• The functional dynamics of coagulation and fibrinolysis in patients with disseminated intravascular coagulation (DIC) vary due to the pathology and severity of underlying disease.
• Conventional measurements of hemostasis may not always reflect the precise pathogenesis of DIC.
What this paper adds?
• Comprehensive, functional coagulation and fibrinolysis was assessed in patients with sepsis- associated DIC using clot-fibrinolysis waveform analyses and thrombin/plasmin generation assays.
• Coagulation and fibrinolysis potentials correlated with both assays in patients with sepsis- associated DIC at onset.
• Most patients exhibited a coagulation-predominant state.
• A pathological clarification of sepsis-DIC based on comprehensive assessment of coagulation and fibrinolysis may be useful as a clinical aid in the clinical practice.
Introduction
Disseminated intravascular coagulation (DIC) is a grave acquired coagulopathy characterized by systemic and persistent activation of coagulation together with varying degrees of fibrinolytic activation induced by the primary coagulopathy. The pathogenesis of DIC is governed by underlying clinical disorders including sepsis, malignancy, aortic aneurysm, and acute pancreatitis. 1 The persistent activation of coagulation promotes the development of microthrombi in the systemic microvasculature, resulting in disordered hemodynamics, and if left unchecked can lead to multiple organ failure.2,3 DIC is characterized by a consumption coagulopathy and progressive clinical deterioration, mediated by an acute loss of circulating hemostatic components including platelets and clotting factors.4 The overall prognosis of DIC is poor. Mortality rates of 42.4% and 35.6% have been reported in prospective clinical studies utilizing the diagnostic criteria defined by the Japanese Ministry of Health and Labor and Welfare (JMHLW) and Japanese Association for Acute Medicine (JAAM), respectively.5 Early diagnosis and therapeutic intervention are essential, therefore, but the variable rates and intensities of acceleration and deceleration of both coagulation and fibrinolytic mechanisms hamper the reliable assessment of coagulation profiles using conventionally available laboratory methods.
Sepsis is the most common underlying disease associated with DIC. Sepsis-associated DIC is characterized by fibrinolytic suppression and decreased solubility of microthrombi in the vasculature potentiating the development of multiple organ failure.2,3 The persistent activation of coagulation is promoted by an aberrant expression of tissue factor (TF) synthesized and released by monocytes and damaged endothelial cells. 6-8 Simultaneously, the fibrinolytic inhibitory factor, plasminogen activator inhibitor-I (PAI-1), is excessively produced by cytokine-activated endothelial cells, and consequently, fibrinolysis is profoundly suppressed.9 However, the degree of fibrinolysis can vary, depending on the progression and/or complications associated with the underlying conditions including malignancy or aortic aneurysm. Moreover, this balance between coagulation and fibrinolysis is critical for preventing excessive thrombosis or hemorrhage, and an accurate and comprehensive assessment of coagulation and fibrinolytic potential is required to enable a clear understanding of the heterogeneity and variability that contributes to the pathogenesis of DIC. The selection of supportive anticoagulation or antifibrinolytic treatment could depend critically on the balance in each individual patient.1,1°-12 Current techniques used to examine these inter-dependent mechanisms are likely to be inadequate, especially those based on specific measurements of the thrombin-antithrombin complex (TAT) or the plasmin-a2_plasmin inhibitor complex (PIC) levels
that reflect only a part of the entire spectrum of coagulation and fibrinolysis.13•15
We have recently established two global hemostatic assays that facilitate the simultaneous assessment of coagulation and fibrinolytic potential. The clot-fibrinolysis waveform analysis (CFWA) is a novel assay designed to concurrently monitor the potential for both clot formation and fibrinolysis.16 The principle of this assay is modified from the original clot waveform analysis (CWA) technique, and centers on the use of a mixture of an activated partial thromboplastin time (APTT) reagent along with an optimal concentration of recombinant tissue-type plasminogen activator (r-tPA) to initiate a series of reactions that are completed in <500 sec ( <8.33 min). Similarly, the thrombin/plasmin generation assay (T/P-GA) evaluates of both coagulation and fibrinolysis in patient plasma with a reagent that contains a specific mixture of TF at low concentration and r-tPA.17 Thrombin and plasmin are end-product enzymes of the coagulation and fibrinolysis cascades, respectively, and an increase in thrombin levels indicates a hypercoagulable state, whereas an increase in plasmin levels reflects enhanced fibrinolysis. Consequently, physiologic homeostasis is achieved by an appropriate balance of thrombin and plasmin generation within the peripheral circulation. Both CFWA and TIP-GA provide relevant data for determining this critical balance of coagulation and fibrinolysis, although there are advantages and/or disadvantages with respect to clinical applicability with each technique. CFWA is an easy-to-use assay and is based on the widely used APTT, whereas TIP-GA requires technical expertise and is typically performed in specialized laboratories.16•17 ln addition, compared with the TIP-GA, the results ofCFWA, may depend more on plasma fibrinogen concentrations.16-18 The present study was designed, therefore, to assess these methods for measuring global coagulation and fibrinolysis in clinical practice, and to clarify the pathology of sepsis-associated DIC at initial diagnosis using these two hemostatic assays.
Materials and Methods
The study was approved by the Medical Research Ethics Committee of Nara Medical University (No.1359-2).
Reagents -Thrombocheck APTT-SLA ® (Sysmex Corporation, Kobe, Japan), recombinant human TF (rTF; Innovin®, Dade, Marburg, Gennany), r-tPA (Activacin®, American Diagnostica Inc., Stamford, CT), thrombin-specific fluorogenic substrate (Z-Gly-Gly-Arg-AMC; Bachem, Bubendorf, Switzerland), and plasm in-specific fluorogenic substrate (Boc-Glu-Lys-Lys-MAC; Peptide Institute Inc., Osaka, Japan) were purchased, and phospholipid (PL) vesicles containing 10 %
phosphatidylserine, 60 % phosphatidylcholine, and 30 % phosphatidylethanolamine (Sigma-Aldrich, St Louis, MO) were prepared as previously described.19
Patient selection - Patients included in the present study were initially diagnosed with sepsis- associated DIC at Nara Medical University Hospital in Japan between September 2016 and July 2019. The diagnosis of DIC was based on the JAAM, JMHLW and JSTH (Japanese Society on Thrombosis and Hemostasis) criteria.20 Patients with non-sepsis-associated DIC (including DIC secondary to leukemia or aneurysm) were excluded from the present study. Since there was no study of DIC using CFW A or TIP-GA, it was difficult to calculate the required number of samples before the present study. The sample size of the present study was determined by the number of all patients who met the criteria from 2016 to 2019.
Blood samples - Blood samples were obtained after written informed consent from the patient or patient's family. Blood was obtained by venipuncture at the time of initial diagnosis and before the start of treatment. Whole blood samples were taken into plastic tubes containing 3.2 % sodium citrate at a 9:1 ratio, and platelet-poor plasma was recovered after centrifugation for 15 min at 1,500 xg. Pooled normal plasma was prepared using samples from 20 healthy volunteers. All plasma samples were stored at -80 °C and thawed at 3 7 °C immediately prior to use.
Conventional laboratory parameters for DIC-related coagulation and fibrinolysis - The plasma levels of fibrinogen, plasminogen, u2-plasminogen inhibitor (u2PI), fibrinogen degradation products (PDP), D-dimer, thrombin-antithrombin complex (TAT; HISCLTM™ TAT Assay Kit;
Sysmex); plasmin-u2_plasmin inhibitor complex (PIC; HISCLTM™ PIC Assay Kit; Sysmex) and plasminogen activator inhibitor (PAI-1; Nanopia® PAI-1 Kit; Sekisui Medical, Tokyo, Japan) were measured using commercially available reagents.
Simultaneous clot-fibrinolysis waveform analysis (CFWA) - CFWA was performed on a CS- 2000i™ instrument (Sysmex Corporation), to monitor the dynamic processes of fibrin formation and clot lysis as previously described.16 Briefly, plasma samples (50 µL) were mixed with the APTT- systemic lupus anticoagulant reagent (APTT-SLA; 50 µL) and activated with 50 µL of a solution containing CaCh together with optimized concentrations of r-tPA [final concentration (f.c.) 0.63 µg/mL]. A representative clot-fibrinolysis waveform is shown in Figure lA-a. The waveform was computer-analyzed using a commercial kinetic algorithm. The reaction time (sec) is illustrated on
the horizontal axis, and the transmittance (T), which is defined as the percent (%) light intensity transmitted from the pre- to post-coagulation states is shown on the vertical axis. The clot time (CT) was determined as the time to the point at which T was reduced to a predefined level. The first derivative of transmittance (dT/dt) reflected the coagulation and fibrinolysis velocities (Figure lA- b). The minimum value of the first derivative (mini) was used to indicate the maximum velocity of coagulation. Because minl was derived from negative values, the data were expressed as absolute values lminll. The fibrinolysis time (FLT) was recorded as the interval between CT and the start of fibrinolysis. In this later phase (Figure lA-b ), the data generated an inverted curve, and the maximum velocity of fibrinolysis (IFL-minll) was determined from this curve (Figure lA-c).
Calculations were performed using Excel software.
Simultaneous thrombin and plasmin generation assay (TIP-GA) - TIP-GA was performed using our previously established protocol.17 Briefly, the trigger reagent (20 µL; 1 pM rTF, 4 µM PL vesicles, and 3.3 nM r-tPA) was mixed with plasma samples (80 µL) and transferred into 96-well plates (Nunc; Thermo Scientific, Waltham, MA). Thrombin generation (TG) and plasmin generation (PG) were detennined with two specific tluorometric substrates, Z-Gly-Gly-Arg-AMC and Boc-Glu-Lys- Lys-MCA, respectively. Assays were perfonned using a Fluoroskan AscentTM™ microplate reader (Thermo Electron Co., Waltham, MA) with excitation at 390 nm and emission at 460 nm. Standard curves were prepared using serial dilutions of purified a.-thromb.in and plasmin as previously described.2 1 Data analyses were performed using Excel software. Representative TG and PG curves obtained with control plasma are shown in Figure 2A and 2B. Thrombin and plasmin lag time (Th- LT and Pim-LT, respectively), which reflect the time until initiation, were determined from the first derivatives of TG and PG, respectively. Peak thrombin (Th-Peak) and peak plasm in (Pim-Peak), which reflect the maximum levels of each parameter, were also recorded.
Statistical analyses - All results were expressed as median [min- max). Statistical analyses were performed using JMP 10.0.2 (SAS Institute Inc.; Cary, NC). The correlations between parameters were analyzed using the Spearman correlation coefficient (p ).
Two-tailed tests were performed for all analyses and P-values of <0.05 were considered as statistically significant. A logistic-regression model was developed to explore parameters associated with the outcome (defined as the mortality rate after 28 days of diagnosis).
Results
Patient demographics-A total of 84 patients were initially screened. Of these, 27 patients with non- sepsis related DIC (for example, leukemia, aneurysm, and liver failure) were excluded from the present study. Overall therefore, 57 patients with sepsis-associated DIC (36 males, 21 females) were enrolled in this study. Clinical characteristics of the patients are summarized in Table 1. The age at onset ranged from 0 to 91 (median 74) years. The median [min-max] of DIC scores determined using the JAAM, JMWLW, and Japanese Society on Thrombosis and Hemostasis (JSTH) criteria were 5 [4-8], 6 [2-12], and 6 [3-10] points, respectively, and the mean Sequential Organ Failure Assessment (SOFA) score22 was 9 [2-17] points. Laboratory findings revealed decreased platelet counts and markedly elevated levels of PDP, D-dimer, TAT, and PIC as well as fibrinogen and total PAI-1.
Dynamics of coagulation and fibrinolysis evaluated using CFWA and TIP-GA in sepsis-associated DIC - The global effects of coagulation and fibrinolytic mechanisms in patients with sepsis- associated DIC were first assessed using CFWA. Representative clot-fibrinolysis waveforms in patient plasma samples are shown in Figure lB. Case 1, illustrates that the initiation of clot formation was slightly delayed and the percent light transmitted was markedly diminished compared with the normal control; and that this curve approached but did not return to baseline (Figure lB- a ). The calculated lmin 1 I value was increased (Figure lB-b) and IFL-min
11
value was markedly decreased (Figure lB-c) compared with the values obtained with control samples. In Case 2, the initiation of clot formation was significantly delayed and the clot-fibrinolysis waveform indicated no recovery to baseline (Figure lB-a ). Both lmin11
and IFL-min11
values were substantially impaired compared with those of the control samples (Figure lB-b and -c, respectively).Next, TIP-GA was utilized to further evaluate this pivotal balance between coagulation and fibrinolysis in these patients. Representative TG and PG curves from two cases are presented in Figure 2B. In Case 1, Th-Peak was comparable to that determined in plasma from healthy controls (Figure 2B-a), and simultaneous measurements of PG revealed a prolonged Pim-LT and a moderately decreased Pim-Peak compared with those in the control samples (Figure 2B-b ). In Case 2, both Th-Peak and Plm-Peak were markedly diminished compared with those observed in the control samples, and Phn-LT was substantially prolonged (Figure 2B-a and -b, respectively).
Table 2 illustrates these parameters as ratios relative to those obtained from normal plasma samples.
In most cases the CFWA lminll ratio was modestly elevated (median 1.40 [min-max; 0.10-2.60]),
the IFL-minll ratio was moderately diminished (0.61 [0-1.19]), and the IFL-TI ratio was prolonged (1. 75 [l.04- 4.20)). These fmdings indicated that the fibrinolytic potential was diminished and coagulation capacity was slightly elevated at an early stage of sepsis-associated DIC. The TIP-GA results in all cases demonstrated that both Th-Peak and Pim-Peak ratios were decreased to 0.71 [0.22-1.20] and 0.35 [0.02-1.43), respectively, and that the Pim-LT ratio was prolonged (2.46 [0.83- 17.78)). These findings suggested that the coagulation and fibrinolysis potentials were decreased, indicating that thrombin levels in patients with sepsis-associated DIC were not always elevated compared with these levels in controls. Further statistical analysis demonstrated a high correlation between the different parameters (P < 0.001), suggesting that the CFWA patterns reflected the thrombin/plasmin relationship. These findings led to the conclusion that the overall hemostatic balance in these individuals could be described as representing a 'coagulation- predominant' phenotype (lminll ratio> IFL-minll ratio, Th-Peak ratio> Pim-Peak ratio).
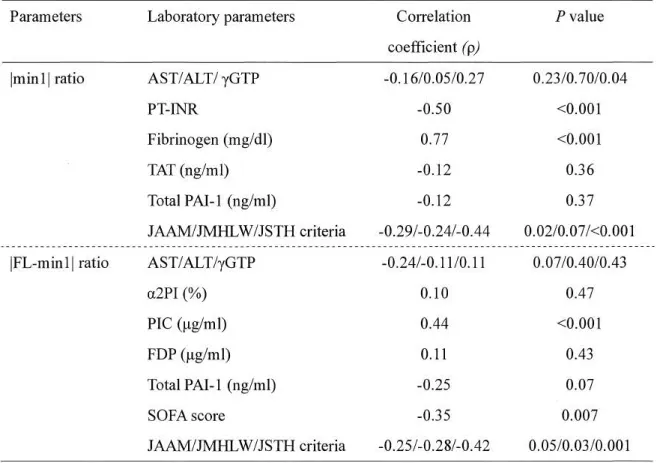
Relations/tip between CFWA parameters and DIC-related laboratory parameters - The CFWA technique is a straightforward procedure that provides a direct and comprehensive evaluation of fibrin clot fonnation and fibrinolytic potential. The method is being adopted on a wider scale, and we further focused, therefore, on a comparison between CFWA parameters and the commonly accepted and conventional laboratory parameters used to measure DIC-related coagulation and fibrinolysis. The correlations between CFWA parameters and routine laboratory and DIC score measurements are summarized in Table 3A. The lminl l ratio correlated with the prothrombin time- intemational normalized ratio (PT-INR) and with fibrinogen levels, but there was no correlation between lminll ratio and liver function (AST/ALT), TAT or total PAI-1 level. Moreover, IFL-minl l ratio significantly correlated with the PIC level and SOFA score but did not correlate with liver function, a.2-plasmin inhibitor (a.2PI), FDPs, and total PAI-1 level. These results confinned that the conventional laboratory parameters did not adequately reflect dynamic relationship between coagulation and fibrinolysis. While, both parameters of CFWA correlated with some DIC scores (JAAM, JMHLW, and JSTH scores), in particular well-correlated with JSTH.
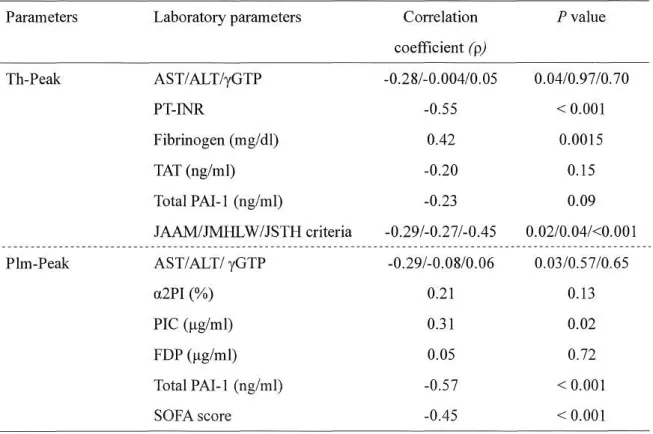
Regards the correlation with TIP-GA parameters, Th-Peak ratio correlated with PT-INR and fibrinogen levels, but did not correlate with liver function (ALT/yGTP), TAT, and total PAI-1 levels.
Pim-Peak ratio also correlated with PIC, total PAI-1, and SOFA score whilst did not correlate with liver function, a2PI, and FDP levels. Both parameters correlated with the DIC scores (JAAM and JSTH score) (Table 3B).
Assessment of DIC based on the dynamics of comprehensive coagulation and fibrinolysis - In contrast to the conventional assays discussed above, CFWA and TIP-GA appeared to provide data to determine the balance between coagulation and fibrinolysis in sepsis-associated DIC. The results of these findings in all patients are shown in Figures 3A and 3B, respectively. Increased values on the vertical axis indicated a tendency toward a hypercoagulable state, whereas similar increases along the horizontal axis indicated a tendency toward excessive fibrinolysis. The pattern observed at initial diagnosis clearly supported the presence of a coagulation-predominant state. Consequently, the CFWA parameters were utilized to categorize coagulation and fibrinolytic potential in sepsis- associated DIC into four classes, with Type
1
defined as a coagulation-predominant pattern (lmin11
ratio > IFL-min
11
ratio); Type 2 as a coagulation/fibrinolysis-balanced pattern (lmin11
ratio ;:::: IFL- min 1 I ratio); Type 3 as a fibrinolysis-predominant pattern (lminl I ratio< IFL-minl I ratio); and Type 4 as a consumption-impaired coagulation pattern or consumptive coagulopathy (lminl I and IFL- minl I ratios both< 0.5). This classification is schematically illustrated in Figure 4.Similar categories were identified using the TIP-GA data (Th-Peak and Pim-Peak ratios). A comparison between the CFWA and TIP-GA findings is illustrated in Figure 5. Most cases (80.7 %) assessed using CFWA were classified as having the Type 1 coagulation-predominant condition, and 69.6 % (n = 46) were similarly categorized using TIP-GA (Figure SA). Moreover, all cases classified as Type 3 (n = 2) or Type 4 (n = 5) using CFWA data were placed into the same categories with the TIP-GA results (Figure SC and SD). However, patients classified using Type 2 (n = 4) by CFWA were categorized differently by TIP-GA (Figure SB).
The CFWA-based findings in these patients were also compared with conventional laboratory diagnostic criteria (Table 4). The coagulation markers, platelet counts, PT-INR, and fibrinogen levels, were markedly decreased among individuals categorized as Type 4, suggesting that this classification represented an advanced stage of sepsis-associated DIC. In contrast, the TAT and total P AI-1 levels did not differentiate patients categorized as Type 4 from any of the other types.
Although the IFL-minl I ratio was comparatively high in the two Type 3 cases, the conventional fibrinolysis markers, FDP, D-dimer, PIC, and a2PI levels were not informative in these individuals.
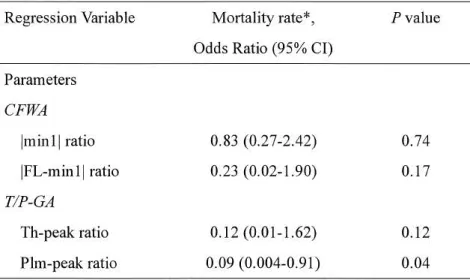
Association of patients' outcomes and parameters in CFWA and TIP-GA-We further investigated the relationship between patients' outcomes and parameters in CFWA and TIP-GA. In the present
study, we utilized the mortality rate after 28 days of diagnosis as the outcome of DIC. A logistic regression analysis demonstrated that Pim-peak ratio alone significantly conelated with patients' mortality rare (odds ratio: 0.09, P = 0.04), but the other parameters did not correlate at all (Table 5).
Discussion
Qua1ttitative assessment of coagulation and fibrinolysis pote1ttial at the time of diag11osis of sepsis-associated DIC - The typical biphasic CWA waveform has been studied extensively in association with the different causes of DIC, including sepsis,23-27 and has been considered a predictor of poor clinical outcome.26•27 Suzuki et al.28 reported that parameters of CWA was useful for the diagnosis of DIC and prediction of bleeding risk or outcome. The precise balance between coagulation and fibrinolysis may vary in relation to the underlying disease and associated complications, however, i ,1o-12 and quantifying this balance could be essential for the clarification DIC-related pathogenetic mechanisms and the selection of appropriate treatment protocols. Asakura et al. 1 were among the first to demonstrate the importance of the interactions between coagulation and fibrinolysis by analyzing a combination of DIC-related laboratory parameters. More modem studies regarding the analysis of global coagulation and fibrinolytic potential are lacking, however.
To the best of our knowledge, the present study is the first to examine simultaneous coagulation and fibrinolysis at the initial diagnosis of sepsis-associated DIC using the established parameters derived from CFWA and T/P-GA.16•17
The successful quantification of synchronized coagulation and fibrinolysis is described together with a classification system based on comparisons of specific parameters. We have previously presented similar comprehensive analyses of coagulation and fibrinolysis using these techniques in pediatric patients with DIC secondary to several types of acute leukemia29-31 and Kawasaki disease. 18
Use of CFWA and TIP-GA i11 for quantitative evaluation of sepsis-associated DIC - The principles of the two assays employed in the present study are clearly distinguishable from one another. CFWA depends on fibrin-mediated blood clotting, 16•32•33 whereas TIP-GA firstly monitors TG, an enzyme that ultimately modulates fibrin fonnation. 17•33•34 Analysis of coagulation potential using these alternative procedures demonstrated mild discrepancies, possibly related to the different stages of coagulation (TG vs. fibrin formation) or fibrinogen levels16•35 in our patients with sepsis-associated DIC. Notably, however, these parameters of global coagulation based on the kinetics of fibrin formation were higher than those determined in healthy controls, and in contrast, fibrinolysis
initiated by the formation of fibrin appeared to be diminished. Hence, both CFWA and TIP-GA suggested that an overall coagulation-predominant state was prevalent in these patients.
Results from CFWA and DIC-related laboratory parameters -The lminl I ratio, which was used to compare the relationship between patients with sepsis-associated DIC and healthy controls, is a principal coagulation parameter in APTT-based CFWA, and the results correlated with both the PT- INR and fibrinogen levels. Fibrinogen is universally known as the soluble precursor of fibrin, the fundamental component of clot formation and stability. In addition, elevated levels of fibrinogen are procoagulant36 and influence blood viscosity. Moreover, fibrinogen is synthesized and released in response to inflammatory cytokines and acute tissue destruction, and regulates pivotal aspects of inflammation, promoting endothelial cell activation, platelet aggregation/activation, and immune cell recruitment.37 Consequently, elevated fibrinogen levels are common in sepsis, and in view of these multi-functional roles for fibrinogen in hemostasis and systemic inflammation, the association between increased fibrinogen concentrations and high lmin
11
ratios was expected. Only a weak correlation was observed, however, between lminll ratios and TAT, another important conventional marker of DIC. Circulating TAT complexes are critically dependent on physiologic interactions between thrombin and antithrombin, and high TAT levels are known to be associated with a hypercoagulable state. Our data suggested that a tendency to enhanced coagulation should be considered even in the absence of elevated TAT assays.PIC is a similar molecular complex that is currently used as an important marker of fibrinolytic potential and classifying DIC. 1 PIC measurements are elevated in association with activated fibrinolysis, and although PIC alone provides only limited information on suppressed fibrinolysis, raised PIC levels are highly informative for the diagnosis and treatment of sepsis-associated DIC.
Normal PIC levels are typically near zero, however, (normal range < 0.8 µg/mL) and therefore measurements of PIC alone cannot distinguish between normal and suppressed fibrinolysis. In contrast, our data identified a correlation between PIC and the IFL-minl I ratio, indicating that this CFWA parameter of fibrinolysis could help to improve understanding of both activation and suppression of fibrinolysis in patients with sepsis-associated DIC. In addition, our IFL-minl I ratios correlated with SOFA scores that are believed to provide an index ofmicrothrombus formation often resulting in organ failure in patients with DIC. Our results were in keeping with a dynamic relationship between fibrinolytic status and fibrin clot formation, and clearly suggested that the IFL- min
11
ratio may be considered a predictor of the risk of organ failure.In addition, it was noteworthy that lmin 1 I and IFL-min l I in CFWA parameters correlated with the DIC scores (JAAM, JSTH score, and/or JMHLW), especially appeared to well correlate with JSTH score. These results may support that CFW A may be a good predictor of DIC and contribute to a diagnosis of DIC.
The JSTH criteria is the high sensitivity and specificity to diagnose the DIC compared to the other criteria used in the present study.38 We repeatedly analyzed the parameters of CFWA and TIP-GA for the subjects who met the JSTH criteria (~ 5 for infection type) and demonstrated a high correlation (P < 0.001) between parameters in both assays, supporting that the CFWA patterns well reflected the thrombin and plasmin relationship (Supplemental Table 1). Furthermore, the relationship between CFWA or TIP-GA parameters and DIC-related parameters were also analyzed.
The coITelation of JAAM, JMHLW, lminll ratio, and IFL-minll ratio became low, but other coITelation remained high (lmi.nl I ratio vs. PT-INR, fibrinogen, or JSTH criteria; IFL-minl I ratio vs.
PIC, SOFA score, or JSTH criteria) (Supplemental Table 2A and B, respectively).
By the way, regards as patients' outcomes, Plm-peak ratio alone in TIP-GA significantly coITelated with the mortality rate after 28 days of diagnosis in all patients enrolled. This result may support that this parameter provides some help on the management of sepsis-associated DIC in the clinical setting. However, since there was small sample size in this study, this limitation might have influenced on our results. Further investigation is required to clarify whether the comprehensive assays could assess the prognosis of septic-associated DIC.
Four types of sepsis-associated DIC, based on a balance between coagulation and fibrinolysis - Marked activation of coagulation is a major, common factor promoting DIC pathology and is dependent on disease stage.1•2 Moreover, the degree of fibrinolytic activation depends on the nature and extent of the underlying disease.1•11•39 Therefore, the critical balance between coagulation and fibrinolysis requires careful and individualized analysis. An earlier report classified DIC into three types based on the degree of fibrinolysis, 1 but that study included assays of PIC, PAI-I, and D-dimer that only partiaJly reflect existing fibrinolytic activity. Our results suggested that this classification may be inadequate for evaluating global fibrinolysis, and we devised a classification system, therefore, that could improve understanding of the pathogenesis of sepsis-associated DIC, and thereby aid the selection of appropriate treatment. In the present study, four distinct categories of
sepsis-associated DIC appeared to be distinguishable based on the CFWA parameters, lminl I ratio and IFL-minl I ratio, used to assess comprehensive coagulation and fibrinolysis.
• Type 1; Coagulation-predominant (lminll ratio> IFL-minll ratio) sepsis-associated DIC In previous studies, patients with non-DIC related bacterial infection demonstrated markedly higher CWA parameters compared with control individuals.40 These results supported our hypothesis that most patients with pre-DIC or early stage DIC have features consistent with a coagulation- predominant disorder. It was not surprising, therefore, that Type 1 characteristics were observed in most patients (80.7%) in the present study immediately on diagnosis. Among those patients in this group, PAI-1 was markedly elevated and fibrinolysis was substantially decreased. In these circumstances, microthrombi could become more resistant to dissolution and the microvascular circulation would be impaired. These events could lead to multiple organ dysfunctions, albeit without any significant risk of bleeding.
• Type 2; Coagulation/fibrinolysis-balanced (lminll ratio;:::; IFL-minll ratio)
A controlled balance between coagulation and fibrinolysis was evident in four (7%) of our patients with sepsis-associated DIC. These individuals were classed as having the Type 2 disorder. This type of DIC may be common among patients with sepsis related to solid tumors, particularly in those with prostate cancer. Hemorrhagic symptoms or vital organ dysfunction are thought to be relatively rare. Type 2 DIC might be diagnosed in patients from within another category during recovery from the consumption of clotting factors or active fibrinolysis.
• Type 3; Fibrinolysis-predominant (lminll ratio< IFL-minll ratio)
Patients with DIC in which fibrinolysis activation exceeds coagulation activation were grouped as Type 3 (fibrinolysis-predominant). Two (3%) of our patients were recorded in this category. This type is identified occasionally in sepsis with cancer or abdominal aortic aneurysm, and may be seen as complication of esophageal or liver cancer like our cases. Patients with Type 3 DIC tend to develop a bleeding tendency.
• Type 4; Consumption-impaired coagulation (lminll < 0.5 and IFL-minll < 0.5)
Severely impaired coagulation and fibrinolytic activation is frequently referred to as a consumptive coagulopathy, and is typically diagnosed in advanced DIC. In general, patients with Type 4 DIC present with severe bleeding and develop organ failure. Intensive treatment may be required for the
management of uncontrolled hemorrhage.
Advantages of CFWA in the clinical practice - Our classification focused on the principle that in clinical practice treatment of the underlying pathogenesis of DIC is critical. In acute circumstances it may be particularly important to have a clear understanding of the physiologic balance between coagulation and fibrinolysis in order to provide supportive therapy that addresses the precise nature of this relationship. The TIP-GA technique has been shown to provide an accurate reflection of the processes of coagulation and/or fibrinolysis. Reliable results are dependent on trained personnel and meticulous technical expertise, however, and this limits widespread clinical application. In contrast, CFWA is a straightforward modified version of the more widely used CWA, and does not require special training or techniques. This method offers an attractive option for routine diagnostic laboratories, especially when a rapid diagnosis is required at the challenging onset of DIC.
Limitation - There is limitation in the present study, however. The sample size was small. Fifty- seven patients were enrolled and the majority of them were the Type 1 pattern. Since only very few patients were included in the groups not being "Type l", we might not possibly capture the overall feature of them sufficiently. The increase of the number of samples could demonstrate the precious features of each type of sepsis-DIC. In addition, further investigation would be needed to achieve the classification of these types that reflects the clinical data.
Acknowledgements
We would like to thank to Dr. Tomoko Matsumoto, PhD, for expert support on CFWA and TIP-GA.
We also greatly appreciate the contributions of Drs. Noritaka Yada (Department of General Medicine), Kazuo Okuchi (Department of Emergency and Critical Care Medicine), Hiroshi Kimura (Second Department of Internal Medicine), Toshiyuki Sadou (Department of Obstetrics and Gynecology), Takashi Nakagawa (Neonatal Intensive Care Unit), and Mai Watakabe (Pediatrics) who provided outstanding clinical support for the patients in this study.
Disclosures
Author contributions: TO designed the research, collected the samples, performed experiments, interpreted the data, and drafted the manuscript; KN designed the research, interpreted the data, drafted the manuscript, edited the manuscript, and approved the final version for publication; TI designed the research, interpreted the data, and supported the experimental studies; MK, KN, HF,
HK, IA, and NT all provided clinical support for this study; MY performed the laboratory examinations; and MK and MS supervised the study.
Support: This work was supported in part by a Grant-in-Aid for Scientific Research (KAKENHI) from the Ministry of Education, Culture, Sports, Science and Technology (MEXT) provided to TO (Grant No. 18Kl 5726) and KN (Grant No. l 8K07885) and a Special Project Grant at Nara Medical University.
Conflicts of interest: All authors have no conflicts of interest to disclose.
References
1. Asakura H. Classifying types of disseminated intravascular coagulation: clinical and animal models. J Intensive Care. 2014. 6;2:20.
2. Levi M, Ten Cate H. Disseminated intravascular coagulation. N Engl J Med 1999;341 :586-592.
3. Gando S. Microvascular thrombosis and multiple organ dysfunction syndrome. Crit Care Med 2010;38(Suppl 2):S35-42.
4. Wada H, Asakura H, Okamoto K, et al. Expert consensus for the treatment of disseminated intravascular coagulation in Japan. Thromb Res 201O;125 :6-11.
5. Gando S, Iba T, Eguchi Y, et al. A multicenter, prospective validation of disseminated intravascular coagulation diagnostic criteria for critically ill patients: comparing current criteria.
Crit Care Med 2006;34:625-631.
6. Levi M, van der Poll T, Schultz M, et al. New insights into pathways that determine the link between infection and thrombosis. Neth J Med 2012;70:114-120.
7. van Gorp EC, Suharti C, ten Cate H, et al. Review: infectious diseases and coagulation disorders.
J Infect Dis 1999; 180: 176-186.
8. Levi M, Schultz M, van der Poll T. Disseminated intravascular coagulation in infectious disease.
Semin Thromb Hemost 2010;36:367-377.
9. Voss R, Matthias FR, Borkowski G, et al. Activation and inhibition of fibrinolysis in septic patients in an intensive care unit. Br JHaematol 1990;75:99-105.
10. Asakura H, Jokaji H, Saito M, et al. Study of the balance between coagulation and fibrinolysis in disseminated intravascular coagulation using molecular markers. Blood Coagul Fibrinolysis
1994;5:829-832.
11. Takahashi H, Tatewaki W, Wada K, et al. Thrombin vs plasmin generation in disseminated intravascular coagulation associated with various underlying disorders. Am J Hematol 1990;33:90-95.
12. Kario K, Matsuo T, Kodama K, et al. Imbalance between thrombin and plasmin activity in disseminated intravascular coagulation. Assessment by the thrombin-antithrombin-III complex/plasmin-alpha-2-antiplasmin complex ratio. Haemostasis 1992;22: 179-186.
13. Ilich A, Bokarev I, Key NS. Global assays of fibrinolysis. Int J Lab Hematol 2017;39:441-447.
14. Lance MD. A general review of major global coagulation assays: thrombelastography, thrombin generation test and clot waveform analysis. Thromb J 2015; 13: 1.
15. Ito T, Thachil J, Asakura H, et al. Thrombomodulin in disseminated intravascular coagulation and other critical conditions - a multi-faceted anticoagulant protein with therapeutic potential.
Crit Care 2019;23:280.
16. Nogami K, Matsumoto T, Sasai K, et al. A novel simultaneous clot-fibrinolysis waveform analysis for assessing fibrin formation and clot lysis in haemorrhagic disorders. Br J Haematol 2019: 187;518-529.
17. Matsumoto T, Nogami K, Shima, M. Simultaneous measurement of thrombin and plasmin generation to assess the interplay between coagulation and fibrinolysis. Thromb Haemost 2013; 110:761-768.
18. Yoshizawa H, Nogami K, Matsumoto T, et al. Dynamic evaluation of hemostasis in the acute phase of Kawasaki disease using comprehensive coagulation functional assays. Thromb Res 2019;174:76-83.
19. Mimms LT, Zampighi G, Nozaki Y, et al. Phospholipid vesicle formation and transmembrane protein incorporation using octyl glucoside. Biochemistry 1981;20:833-840.
20. Asakura H, Takahashi H, Uchiyama T, et al. Diagnostic criteria for DIC by the Japanese Society on Thrombosis and Hemostasis-2017 edition- (in Japanese). Jpn J Thromb Hemost 2017;28:369-392.
21. Hemker HC, Willems GM, Beguin S. A computer assisted method to obtain the prothrombin activation velocity in whole plasma independent of thrombin decay processes. Thromb Haemost 1986;56:9-l 7.
22. Vincent JL, Moreno R, Takala J, et al. Working Group on Sepsis-Related Problems of the European Society of Intensive Care Medicine. The SOFA (Sepsis-related Organ Failure Assessment) score to describe organ dysfunction/failure. Intensive Care Med l 996;22:707-710.
23. Samis JA, Stewart KA, Toh CH, et al. Temporal changes in factors associated with neutrophil elastase and coagulation in intensive care patients with a biphasic waveform and disseminated intravascular coagulation. J Thromb Haemost 2004;2: 1535-1544.
24. Toh CH, Samis J, Downey C, et al. Biphasic transmittance waveform in the APTT coagulation assay is due to the formation of a Ca(++ )-dependent complex of C-reactive protein with very- low-density lipoprotein and is a novel marker of impending disseminated intravascular coagulation. Blood 2002;100: 2522-2529.
25. Smith EY, Charles LA, Van Cott EM. Biphasic activated partial thromboplastin time waveform and adverse events in non-intensive care unit patients. Am J Clin Pathol 2004;121:138-141.
26. Hussain N, Hodson D, Marcus R, et al. The biphasic transmittance waveform: an early marker of sepsis in patients with neutropenia. Thromb Haemost 2008;100:146-148.
27. Mair G, Dunhill S, Tiplady C. Prognostic implications of a biphasic waveform for APTT analysis in a district general hospital. Int J Lab Hematol 2008;30:467-472.
28. Suzuki K, Wada H, Matsumoto T, et al. Usefulness of the APTT waveform for the diagnosis of DIC and prediction of the outcome or bleeding risk. Thromb J 2019;17:12.
29. Ishihara T, Nogami K, Onishi T, et al. Hemostatic function in hyperfibrinolytic disseminated intravascular coagulation. Pediatr Int 2019;61 :872-881.
30. Ishihara T, Nogami K, Ochi S, et al. Disordered hemostasis associated with severely depressed fibrinolysis demonstrated using a simultaneous thrombin and plasmin generation assay during L - asparaginase induction therapy in pediatric acute lymphoblastic leukemia. Pediatr Blood Cancer 2020; 67: e28016.
31. Ishihara T, Nogami K, Matsumoto T, et al. Potentially life-threatening coagulopathy associated with simultaneous reduction in coagulation and fibrinolytic function in pediatric acute leukemia after hematopoietic stem-cell transplantation. Int J Hematol 2017;106:126-34.
32. Shima M, Matsumoto T, Fukuda K, et al. The utility of activated partial thromboplastin time (aPTT) clot waveform analysis in the investigation of hemophilia A patients with very low levels of factor VIII activity (FVIII:C). Thromb Haemost 2002;87:436-441.
33. Matsumoto T, Shima M, Takeyama M, et al. The measurement of low levels of factor VIII or factor IX in hemophilia A and hemophilia B plasma by clot waveform analysis and thrombin generation assay, J Thromb Haemost 2006;4:377-384.
34. Hemker HC, Giesen P, Al Dieri R, et al. Calibrated automated thrombin generation measurement in clotting plasma. Pathophysiol Haemost Thromb 2003 ;3 3 :4-15.
35. Suzuki A, Suzuki N, Kanematsu T, et al. Clot waveform analysis in Clauss fibrinogen assay
contributes to classification of fibrinogen disorders. Thromb Res 2019;174:98-103.
36. Rea CJ, Sorensen B, Ingerslev J, et al. Fibrinogen: A Procoagulant and An Anticoagulant.
Blood 2011;118:384.
37. Davalos D, Akassoglou K. Fibrinogen as a key regulator of inflammation in disease. Semin Immunopathol 2012;34:43-62.
38. Aota T, Wada H, Yamashita Y, et al. An Evaluation of the Modified Diagnostic Criteria for DIC Established by the Japanese Society of Thrombosis and Hemostasis. Clin Appl Thromb Hemost 2017;23:579-584.
39. Asakura H, Ontachi Y, Mizutani T, et al. An enhanced fibrinolysis prevents the development of multiple organ failure in disseminated intravascular coagulation in spite of much activation of blood coagulation. Crit Care Med 2001;29:1164-1168.
40. Lawrence Ng CK, Tan CW, Mcvin Cheen HH, et al. APTT-based clot waveform analysis in various infections. EHA Library. 2018; 215813, PS1530.
Figure Legends
Figure 1. Simultaneous clot-fibrinolysis waveform analysis (CFWA)
(A) Clot-fibrinolysis waveforms and parameters in normal plasma: Normal plasma was incubated with the APTT reagent followed by the addition of CaCb with or without r-tPA (0.63 µg/mL) as described in Methods. Panel (a) documents the changes in light transmittance (%T) observed over time during the performance of the APTT. Panel (b) shows the curves from first derivative over time (dT/dt) of the waveform in (a). Panel (c) shows the inverted curve during the fibrinolysis phase (enclosed by the dotted circle) in (b ). APTT, activated partial thromboplastin time; CT, clot time;
lminll, maximum coagulation velocity; FLT, fibrinolysis time; IFL-minll, maximal fibrinolysis velocity; r-tPA, recombinant tissue-type plasminogen activator
(B) Representative waveforms of CFWA in sepsis-associated DIC: Clot formation and fibrinolysis waveforms in plasma samples from patients with sepsis-associated DIC are illustrated. Panel (a) shows the clot waveform (% T) observed during APTT. Panel (b) shows the curves from first derivative (dT/dt) over time of the waveforms in (a). Panel (c) includes the inverted curve observed during the fibrinolysis phase in (b ). Case 1, solid gray line; Case 2, dotted line; control, solid black line. DIC, disseminated intravascular coagulation
Figure 2. Simultaneous thrombin/plasmin generation assay (TIP-GA)
(A) Thrombin and plasmin generation curves and their parameters in normal plasma: TF, tPA, and PL (final concentrations, 1 pM, 3.2 nM, and 4 µM, respectively) were added to control plasma as described in the Methods. Panel (a) illustrates thrombin generation (TG) and the associated parameters. Panel (b) illustrates plasmin generation (PG) and the associated parameters. Th-LT and Plm-LT indicate the lag time of TG and PG, respectively. Th-Peak and Plm-Peak identify maximum TG and PG, respectively.
(B) A representative curves ofTG and PG in patients with sepsis-associated DIC: Values of TG and PG in plasma samples from patients with sepsis-associated DIC are shown. Case 1, solid gray line;
Case 2, dotted line; control plasma, solid black line. DIC, disseminated intravascular coagulation
Figure 3. Distribution of coagulation and fibrinolytic potentials from parameters obtained using CFWA and TIP-GA in sepsis-associated DIC cases
(A) The vertical axis shows the values calculated for lminl I ratio. The horizontal axis shows the analogous values for IFL-min
11
ratio. The diagonal line depicting unity (Im in11
ratio = IFL-min11
ratio) is shown (dashed line). (B) Th-peak ratio is on the vertical axis and, and Plm-Peak ratio is on the horizontal axis. The dotted line denotes Th-Peak ratio= Plm-Peak ratio.
Figure 4. A classification of sepsis-associated DIC based on the balance of coagulation/fibrinolysis dynamics as determined using CFWA and TIP-GA
Type 1, coagulation-predominant pattern; Type 2, coagulation/fibrinolysis-balanced pattern; Type 3, fibrinolysis-predominant pattern; Type 4, Consumption-impaired coagulation. Relationships among the four categories and factors contributing to differential diagnosis are as described in the text.
Figure 5. Comparison of the classifications based on CFWA with those predicted using TIP- GA in patients with sepsis-associated DIC
The coagulation and fibrinolysis parameters obtained by CFWA and used to generate the four categories were compared with those generated using TIP-GA (A) Type 1, (B) Type 2, (C) Type 3, and (D) Type 4.
Table 1. Clinical characteristics at diagnosis of patients with sepsis-associated DIC Patient (n
=
57) Nonnal rangeMale I Female (n) 36 / 21
Age (years) 74 [0-91)
DIC score (defined as DIC)
JAAM criteria(~ 4) 5 [4-8) JMHL W criteria (~ 7) 6 [2- 12) JSTH criteria (~ 5 for 6 [3- 10)
infection type)
SOFA score 9 [2-17)
Laboratory data
PLT (x 104/µL) 8.9 [0.40- 24.6) 13.1- 36.5
PT-INR 1.38 [0.95-3.44) 0.85- 1.15
Fibrinogen (mg/dL) 413 [117- 755) 150-400 Plasminogen (%) 43.6 [24.9-110.5) 75- 125
a2PI (%) 77.4 [30.6-112.6) 85- 115
FDP (µg/mL) 29.3 [4.8- 211.6] < 4.0 D-dimer (µg/mL) 13.3 [l.6-79.6) < 1.0 TAT(ng/mL) 16.3 [3.7- 149.3) <3.0 PIC (µg/mL) 1.1 [0.4- 30.0) < 0.8 Total PAI-1 (ng/mL) 83 [25-2,961] < 50
Values are presented as median [min- max). JAAM, Japanese Association for Acute Medicine;
JMHLW, Japanese Ministry of Health, Labor and Welfare; JSTH, Japanese Society on Thrombosis and Hemostasis; PLT, platelet; PT-INR, prothrombin time-international normalized ratio; a2PI, a2 plasminogen inhibitor; FDP, fibrinogen/fibrin degradation products; TAT, thrombin-antithrombin complex; PIC, plasmin-Ui-Plasmin inhibitor complex; PAI-1, plasminogen activator inhibitor
Table 2. Comprehensive coagulation and fibrinolysis assays in patients with sepsis-associated DIC
CFWA TIP-GA Correlation P value 1
lmin11 IFL-minll IFL-TI
Ratio•
1.40 [0.10- 2.60) Th-Peak 0.61 [0-1.19) Pim-Peak 1.75 [l.04-4.20) Pim-LT
*;The value shows the ratio relative to control.
t ;
Speannan's rank-order correlation coefficientRatio*
0.71 [0.22- 1.20) 0.35 [0.02- 1.43) 2.46 [0.83- 17.78]
coefficient (p) t
0.55 0.71 0.39
t ;
The correlations between parameters were analyzed using Spearman correlation coefficient.Values are presented as median [min- max]. Significant differences were expressed as P < 0.05.
< 0.001
< 0.001 0.007
Table 3A. Comparison between CFWA parameters and DIC-related parameters Parameters
lminl l ratio
lfL-minl l ratio
Laboratory parameters
AST/ALT/ rGTP PT-INR
Fibrinogen (mg/di) TAT(ng/ml) Total PAI-1 (ng/ml)
JAAM/JMHLW/JSTH criteria AST/ALT/yGTP
a.2PI (%) PTC (µg/ml) FDP (µg/ml) Total PAI-1 (ng/ml) SOFA score
JAAM/JMHLW/JSTH criteria
Correlation coefficient (p) -0.16/0.05/0.27
-0.50 0.77 -0.12 -0.12 -0.29/-0.24/-0.44
-0.24/-0.11/0.11 0.10 0.44 0.11 -0.25 -0.35 -0.25/-0.28/-0.42
P value
0.23/0.70/0.04
<0.001
<0.001 0.36 0.37 0.02/0.07/<0.001
0.07/0.40/0.43 0.47
<0.001 0.43 0.07 0.007 0.05/0.03/0.001
Table 3B. Comparison between TIP-GA parameters and DIC-related parameters Parameters
Th-Peak
Plm-Peak
Laboratory parameters
AST/ALT/yGTP PT-INR
Fibrinogen (mg/di) TAT(ng/ml) Total PAI-I (ng/ml)
JAAM/JMHLW/JSTH criteria AST/ ALT/ yGTP
a2PI (%) PIC (µg/ml) FOP (µg/ml) Total PAJ-1 (ng/ml) SOFA score
Correlation P value coefficient (p)
-0.28/-0.004/0.05 0.04/0.97/0.70
-0.55 < 0.001
0.42 0.0015
-0.20 0.15
-0.23 0.09
-0.29/-0.27/-0.45 0.02/0.04/<0.001 -0.29/-0.08/0.06 0.03/0.57/0.65
0.21 0.13
0.31 0.02
0.05 0.72
-0.57 < 0.001
-0.45 < 0.001
JAAM/JMHLW/JSTH criteria -0.30/-0.2 l/-0.33 0.02/0. J J/O.Ol
Significant differences were expressed as P < 0.05. PT-TNR, prothrombin time-international normalized ratio; AST, aspartate aminotransferase; ALT, alanine aminotransferase; yGTP, y- glutamyl transpeptidase; n2PI, n2-plasminogen inhibitor; FDP, fibrinogen/fibrin degradation products; TAT, thrombin- antithrombin complex; PIC, plasmin-n;_plasmin inhibitor complex; PAI- i , plasminogen activator inhibitor; SOFA, sequential organ fai lure assessment; JAAM, Japanese Association for Acute Medicine; JMHLW, Japanese Ministry of Health, Labor and Welfare; JSTH, Japanese Society on Thrombosis and Hemostasis
Table 4. DIC-related laboratory data related to CFWA in sepsis-associated DIC
Type I Type2 Type3 Type4
Coagulation Both Fibrinolysis Consumptive
Potential predominant Balanced predominant impaired coagulation
(n = 46) (n = 4) (n = 2) (n
=
5)Laboratory
PLT(xl04/µl) 9.1 [0.4-24.6] I 0.1 [9.7- 10.3] 6.5, 3.0 4.6[0.5- 10.6]
PT-INR 1.32 [0.95-1.80] 1.33 [l.3- 2.02] 1.3, 2.7 1.93 [ 1.41- 3.44]
Fibrinogen (mg/dl) 464 (250- 755] 220 [ 117-330] 269, 139 154 (120-237]
FDP (µg/ml) 23.5 [4.8-211] 35.3 [15- 47.5] 12.3, 32.4 32.5 [ 11.5- 78.5]
D-dimer (µg/ml) 10.2 (1.6-79.6] 20.1 (6.5-23.8] 4.7, ND 16 (6.5-33.1]
TAT(ng/ml) 13.3 [3.7-41] 25.l [8.6-41.5] 5.5, 36.5 21.5 [10.2-149.3]
PIC (µg/ml) LI (0.4- 30.0] 1.6 [ 1.1- 2.0] 1.5, l.8 LO (0.6- 1.8]
a2PI (%) 86.9 (56.1-112.6] 55.8 [47.4-64.2] 65.4, 57.6 47.8 (30.6-68.8]
Plasminogen (%) 44.8 [26.8- 110.5] 40.6 [37.2- 44] 58.2, 51.3 28.2 [24.9- 36.0]
Total PAI-I (ng/ml) 77. l (24.5-296] 147.2 [39.3-255] 15.5, 260 142.7 (44.8-2960) CFWA
lminll ratio 1.5 [0.61- 2.60] 0.95 [0.56- 1.l] 0.89, 0.25 0.34 (0.10- 0.46]
IFL-minll ratio 0.64 [0.12- 1.19] 0.96 [0.62- 1.1] 1.22, 0.52 0.37 [0- 0.45]
IFL-TI ratio 1.79 (1.18-4.2] 1.28 [ 1.05-1.44] 1.18. 0.96 1.45 [ 1.04-2.82]
PLT, platelet; a.2PI, a.2 plasminogen inhibitor; FOP, fibrinogen/fibrin degradation products; TAT, thrombin- antithrombin complex; PIC, plasmin-Cli-Plasmin inhibitor complex; PAI-1, plasminogen activator inhibitor- I. Values are presented as median [min-max].
Table 5. Association of parameters in CFWA and TIP-GA with patients' outcomes Regression Variable Mortality rate*, P value
Parameters CFWA
lmin 11 ratio IFL-min ll ratio TIP-GA
Th-peak ratio Plm-peak ratio
Odds Ratio (95% Cl)
0.83 (0.27-2.42) 0.23 (0.02-1.90)
0.12 (0.01-1.62) 0.09 (0.004-0.91)
0.74 0.17
0.12 0.04
*Mortality rate was evaluated after 28 days of diagnosis of DIC.
Significant differences were expressed as P < 0.05.
S upplemental Table 1. Comprehensive coagulation and fibrinolysis assays in patients with sepsis-associated DIC for patients who met the JSTH criteria
CFWA TIP-GA Correlation
coefficient (p) t
Ratio• Ratio•
lminl l 1.20 [0.10- 2.60) Th-Peak 0. 67 [0.22- 1.17) 0.53 IFL-minll 0.59 [0- 1.10) Pim-Peak 0.3 5 [0.02- 1.43) 0.73 IFL-TI 1.75 [1.04-4.201 Pim-LT 2.46 (0.83- 17. 78) 0.32
*; The value shows the ratio relative to control.
t ;
Spearman 's rank-order correlation coefficientP value1
< 0.001
< 0.001 0.06
t ;
The correlations between parameters were analyzed using Spearman conelation coefficient.Values are presented as median [min-max]. Significant differences were expressed as P < 0.05.
Supplemental Table 2. Comparison between CFWA or TIP-GA parameters and DIC-related parameters for patients who met the JSTH criteria
(A) CFWA
Parameters Laboratory parameters Correlation P value
coefficient (p)
lmin I I ratio AST/ALT/ yGTP 0.07/0.17/0.30 0.6310.2310.04
PT-INR -0.45 0.001
Fibrinogen (mg/di) 0.72 <0.001
TAT (ng/ml) -0.09 0.53
Total PAI-I (ng/ml) -0.08 0.60
JAAM/JMHLW/JSTH criteria -0.11/-0.02/-0.29 0.45/0.88/0.04 ... ---···--- ···--- ---
IFL-min I I ratio
(B) TIP-GA Parameters Th-Peak
Pim-Peak
AST/ALT/yGTP a2PI (%) PIC (µg/ml) FDP (µg/ml) Total PAI-I (ng/ml) SOFA score
J AAM/JMfil W /JSTH criteria
Laboratory parameters
AST/ALT/yGTP PT-INR
Fibrinogen (mg/dl) TAT (ng/ml) Total PAI-I (ng/ml)
JAAM/JMHLW /JSTH criteria AST/ALT/ yGTP
a.2PI (%) P[C (µg/ml) FDP (µg/ml)
-O. I 7/-0.06/0. I4 0.10 0.42 0.13 -0.24 -0.44 -0.20/-0.25/-0.45
Correlation coefficient (p) -0.17/-0.05/0.07
-0.58 0.36 -0.17 -0.18 -0.20/-0. 17/-0.3 8
-0.34/-0.09/0.02 0.18 0.21 -0.02
0.25/0.67 /0.33 0.49 0.003 0.36 0.11 0.002 0.16/0.07/0.001
P value
0.24/0. 70/0.64
< 0.001 0.02 0.26 0.23 0.1 7/0.26/0.007
0.0210.5110.90 0.23 0.16 0.9 1
Total PAI-1 (ng/ml) SOFA score
JAAM/JMHLW/JSTH criteria
-0.54 -0.47 -0.33/-0.25/-0.3 8
< 0.001
< 0.001 0.02/0.09/0.01
Significant differences were expressed as P < 0.05. PT-INR, prothrombin time-international nonnalized ratio; AST, aspartate aminotransferase; ALT, alanine aminotransferase; yGTP, y- glutamyl transpeptidase; a2PI, a2-plasminogen inhibitor; FDP, fibrinogen/fibrin degradation products; TAT, thrombin- antithrombin complex; PIC, plasmin-a2_plasmin inhibitor complex; PAI-
i, plasminogen activator inhibitor; SOFA, sequential organ failure assessment; JAAM, Japanese Association for Acute Medicine; JMHLW, Japanese Ministry of Health, Labor and Welfare; JSTH, Japanese Society on Thrombosis and Hemostasis
(A) (a)
120i .. ~ T
100 80 60·a
40 § 201 /
-tPA(-) -tPA(+) 0 +-___,__,,___,___,__..___,___,.--___,--.-___,__,(B)
120 100 80 60·g
40 200 100 200 300 400 500 Time (sec)
(a) '~- --- · L--- _- --
Normal --Case 1 ----Case 2 o-i---~--~-~--~-~ 0 1001
200 300 Time (sec) 400 500
(b)
, FLT i:
~:. 11
3.5 i ....J~
... ; ... Imm 2.5=2
E-< '"O 1.5 0.5 .. ~········'""'"'•··············'·., -0.5 100\J ...
2003oO .... ./
400riffie .. (se~)·
500(b)
5 4 --Nonnal --Case 1 3 ----Case 2 ... ~~
2 0r'~ .--- 1~0 ~ ~
400 500 -1 Time (sec)... '"O
f:::;
'"O-0.3 -0.2 -0.1
(c)
500 O 19' I ~ " -,..._ e I 0.1 -0.3 -0.2 ... ~ E-< -0. l '"OTime (sec)
(c)
--Nonnal --Case 1 ----Case 2 O I :\I I f _,, . . " ~tll ... -.. -qar: 0.1 Time (sec)(A) (B) e 2
(a)
150 ,TG
-- -, - ~
100 "-" Th-Peak 0 :Ea
0.El
50 f-o ·-Th-EP 0l_!
~ '\~.-.Aaa.ar.
aa. j 0Th-LT 40 80 150 , ,.-..~
100 ,,__., 0 :E8
0.El
f-o 50 011 J
0Time (rnin)
(a) TG
--Normal --Case I ----Case 2 40 Time (min) 80I I
,.-..~
'-' 0·9
en"'
~- ~
,,__., 0·a
en"' -
0....(b)
10 1PG I
Pim- 5I I
' I~ ----" Pim-
I I.. EP
0 oPlm-LT 40 80 Time (min)(b)
10 ,PG
--Normal --Case I ----Case 2 5 0 1~-«•• -= =- ;---=+- ....,
0 40 Time (min) 80(A) CFWA 3.0 • •
: ...
I .' ! ...•• i _/
; / ! / I / ! ,/ ! ,,. .. / i / I ./2.5 2 0 • • • ,/ .9 . • , ~ ! ... ,./
~ r I /-
' , ~.
/ .. ! / '"""'4l. 5 • • •• i • ",./ 0 •• // . s 1. 0 ···-~ ···-···· ·-·· ··· .... [,!.~:: ... -... -... ... ... ... . .
• • •• i • • -/ i.
-,. ' I' !Y .•
I0.5 I •/ • ! e .
I .. I./ •• ! 0. 0 ... ! 0.0 0.5 1.0 1.5 2.0 2.5 3.0 IFL-minl l ratio gu re 3
3.0 2.5 _g 2.0 ~
H~ 1.5
a,) ~•
(B) T/P-GA
.. ... // _,.. .. / ... ... ... /,.,.,./
..../ ... ....
.··"' ,, ...
.... I
~ 1.0 ~~~ :f ' ~:. ~· ••••••••• m••••••••m•••mmmmmm
m•0 5 ,., • ... • I
. ,_... • _,.... i.rr ..-•
l •. • i0.0 , ... ··· l 0.0 0.5 1.0 1.5 2.0 2.5 3. 0 Plm-Peak ratio
4
3.0 ....--- - - ---- ---.... .-.. ~ § 2.5
0 0 0 -+-> 02.0 ·- ~ b ~ 5 ·- 1. d
~ -+-> 0~ 1.0
0 0·~ "3 0.5
00 crj 0u
Type 1 Type4
~~ «..,~~ Type3 0 ,__ _____ ______________ _ -" 0 0.5 1.0 1.5 2.0 2.5 3.0 Fibrinolysis potential (ratio to normal)
(A ) (B) C FWA -
/ //.
/.
/,.,.l ,, \ .... ,// .. .
/. ·-' .
//. . .
/ ill' ,. ./.
/. _,.., /
IY // ,,,,.,'
/ / 0.0 0.5 1.0 1.5 2.0 2.5 3.0 IFL-min 11 ratioTI P- GA
3.0 2.5 I / ,/,/ .2 2.0 ,' / (ii /...
/ ~ 1.5 /•
/ Q) / ii. / I... ~. :
..::: f-' 1.0•• ••
0.5 J: •. , •• / 0.0 0.0 0.5 1.0 J.5 2.0 2.5 Pim-Peak ratio
_,/'/
I 3.0 I I 2.5 I . 0 2.0
'·- ... •e
; ;::;-1.5 ·c ~ '§ •-l.O I 0.5CFWA
///' ,,•'/////
/ ,• /,.,;',• ,/"' ,,.
/o.oL
I 3.0 ; 0.0 0.5 1.0 1.5 2.0 2.5 3.0 IFL-min l I ratioTI P- GA
ll / 2.S.g
2.0e
~ l.5 Q) ~t:
l.O / /,, ,• ,. / / / •' / / / / ,/,/
/.-;' .
,/.
/ 0.5 ~ /. / ,,//' 0.0 +'"---.--...---~--r---.----l 0.0 0.5 l .0 l .5 2.0 2.5 3.0 Pim-Peak ratio ·-·-·-·-·-·-·-·-·-·-·-·-·-·-·-·-·-·-·-·-·-·-·-·-·-·-·-·-·-·-·-·L·-·-·-·-·-·-·-·-·-·-·-·-·-·-·-·-·-·-·-·-·-·-·-·-·-·-·-·-·-·-·-·-·-·· 0 5 0CF WA
,,...'1////// ,,,,·/
,/·,/' /.
/,// ,/'. /(C )
3.0 2.5 0 2.0 ·~...
~ 1.5 Q) O; ~ 1.0 0.5 ,,.,, / /~·TIP-G A
,,// /,// // ,// //// //_,/ .
// 0.0 +·-/_' --.---.--.---..---r----.,I
(D) CFWA
3.0 2.5 I 0 2.0 ;·~ ... ! ::::::-1.5 IC ,//// o.s I • 9d3
i-1.0 /...
/ 0.0,/,/
,/"/. /,///' ,/
3.0 2.5 0 2.0 -~ ~ 1.5 Q) 0..
~
1.0 o.5 I~ ,,.~··
TI P-GA ,.,·''
/,./,/ ,• / /..
/'/ / ,•',// ,•