1
Associations of glucose and blood pressure variability with cardiac diastolic function in patients with type 2 diabetes mellitus and hypertension: a retrospective observational study
Satoshi Goto, Makoto Ohara
*, Naoya Osaka, Tomoki Fujikawa, Yo Kohata, Hiroe Nagaike, Ayako Fukase, Hideki Kushima, Munenori Hiromura, Takeshi Yamamoto, Toshiyuki Hayashi, Tomoyasu Fukui, Tsutomu Hirano
Department of Medicine, Division of Diabetes, Metabolism, and Endocrinology, Showa University School of Medicine, Tokyo, Japan
*
Corresponding author: Makoto Ohara, MD, PhD
1-5-8 Hatanodai, Shinagawa-ku, Tokyo 142-8666, Japan Tel: +81-3-3784-8000
Fax: +81-3-3784-8948 Email: [email protected]
(Running Head: BP variability and cardiac function in T2DM)
2
Abstract
Purpose: We evaluated the effects of glucose metabolism and blood
pressure (BP) variability on cardiac diastolic function in patients with type 2 diabetes mellitus (T2DM) and hypertension.
Methods: A total of 23 inpatients with T2DM underwent ambulatory BP monitoring (ABPM) and echocardiography. BP variability was assessed by measuring the mean BP and the standard deviation (SD) of systolic and diastolic BP over 24 hours, as well as daytime and nighttime ABPM.
Cardiac diastolic function was assessed using the echocardiography E/eʹ ratio.
Findings: Participants had a mean age of 69.0 ± 10.6 years, disease duration of 11.0 ± 10.5 years, glycated hemoglobin (HbA1c) of 8.2% ± 1.3%, and glycated albumin (GA) of 22.0% ± 4.2%. Univariate analysis showed that the nighttime systolic BP, nighttime SDs of systolic and diastolic BP, urinary albumin, estimated glomerular filtration rate, and GA/HbA1c ratio were all significantly correlated with the E/eʹ ratio.
Moreover, stepwise multiple regression analysis identified nighttime SD of
diastolic BP, urinary albumin, and GA/HbA1c ratio as independent
3
contributors to the E/eʹ ratio.
Conclusions: In patients with T2DM and hypertension, cardiac diastolic function was associated with nighttime diastolic BP variability and the GA/HbA1c ratio.
Key words: blood pressure variability, cardiac diastolic function, glycated
albumin/glycated hemoglobin ratio, ambulatory blood pressure monitoring,
type 2 diabetes mellitus
4
Introduction
The coexistence of diabetes and hypertension is common and associated with an increased risk of death and cardiovascular events as well as the progression of microvascular complications, such as nephropathy and retinopathy
1,2). Type 2 diabetes mellitus (T2DM) is also a major cause of heart failure, with reduced or preserved ejection fraction
3). The
Framingham Heart Study demonstrated that the frequency of heart failure is five times higher in women with diabetes and two times greater in men with diabetes compared with age-matched controls
4). It was recently reported that the most frequent heart alteration in T2DM is heart failure with preserved ejection fraction
5). It was also reported that around 50% of patients with hypertension suffer heart failure with preserved ejection fraction
6).
The short and long-term variability of glucose and blood pressure (BP) levels have been studied. Recently, long-term variability in visit-to-visit glucose levels, as well as BP, was shown to be related to macrovascular and microvascular complications in patients with T2DM
7,8). Advances in
medical technology, such as continuous glucose monitoring (CGM) and
5
24-hr ambulatory BP monitoring (ABPM), have enabled short-term glucose and BP variability to be detected in greater detail. The mean amplitude of glycemic excursions (MAGE) is a short-term glucose variability index that has been associated with oxidative stress
9), vascular endothelial
dysfunction
10), and narrowing of the coronary artery
11). Nighttime BP variability, a short-term BP variability index, is also reported to be a strong predictor for cardiovascular disease in patients with T2DM and
hypertension
12). However, few studies have investigated the relationship between glucose variability, BP variability, and heart failure.
Therefore, the present study aimed to determine whether glucose and BP variability, measured using the glycated albumin (GA)/glycated
hemoglobin (HbA1c) ratio and ABPM, respectively, are associated with the early diastolic (E)/spectral pulsed-wave Doppler-derived lateral early
diastolic velocity (eʹ) ratio, an index of heart failure with preserved ejection
fraction in patients with T2DM and hypertension.
6
Patients and methods Participants
This retrospective, observational study included 23 inpatients with T2DM and hypertension recruited from patients treated at Showa
University Hospital from May 2017 to October 2018. The patients were admitted to the hospital to achieve glycemic control due to poor current control. The inclusion criteria were as follows: a diagnosis of T2DM and hypertension, age over 20 years, and stable diabetes and hypertension treatment for ≥ 3 months prior to the study. T2DM was defined according to the Japan Diabetes Society. Hypertension was defined as a systolic BP (SBP) ≥ 140 mmHg and/or diastolic BP (DBP) ≥ 90 mmHg on at least two occasions according to the current guidelines, or a previous diagnosis of hypertension and treatment with antihypertensive medication. The
exclusion criteria for patients were: (1) ejection fraction < 50%; (2) shift to a different medicine within the last month; (3) use of steroid
anti-inflammatory drugs; (4) secondary diabetes; (5) malignancy; (6) liver disease; (7) valvular heart disease; (8) myocardial infarction with asynergy;
and (9) estimated glomerular filtration rate (eGFR) < 30 ml/min/1.73 m
2.
7
Study design
Figure 1 shows a summary of the study protocol. This was a
retrospective observational analysis of patients with T2DM who underwent a 24-hr period of ABPM and echocardiography monitoring. Clinical and laboratory parameters, including body mass index (BMI), fasting plasma glucose, HbA1c, GA, eGFR, low-density lipoprotein cholesterol,
high-density lipoprotein cholesterol, and triglycerides were measured before breakfast on day 2. We used the GA/HbA1c ratio as a marker of glucose variability. Clinical data (age, sex, smoking status, duration of diabetes, diabetes therapy, and the use of antihypertensive and
lipid-lowering drugs) were retrieved from medicals records. Parameters of BP variability, such as mean and standard deviation (SD) of BP, and
percentage coefficient of variation for BP (%CV) were measured for 24 hr, starting on day 2. All patients continued their usual treatment during ABPM.
Echocardiography was performed on day 3. E/eʹ was used as a parameter of
cardiac diastolic function. The study protocol was approved by the School
of Medicine, Showa University Ethical Committee (Permit Number: 2465)
8
and was designed in compliance with the Declaration of Helsinki. Informed consent was obtained from all participants after receiving an explanation of the study protocol.
Procedures and measurements
Venous blood samples were taken for laboratory analysis on day 2 before breakfast. All patients received a weight-maintaining diet (25–30 kcal/kg of ideal body weight) with salt restriction (< 6 g/day). After attaching the ABPM device (Mobil-O-graph; I.E.M. GmbH, Stolberg, Germany) on day 2, BP was measured in the left upper extremity using the oscillometric method and pulse rate at 30 min intervals for 24 hr. Daytime and nighttime were defined based on the patients' written diaries recorded during ABPM.
BP variability was estimated using the SD of SBP and DBP during the daytime and nighttime. The %CV was calculated using the coefficient of variation obtained by dividing the SD by the mean BP and multiplying by 100. Mean SBP and DBP during the daytime and nighttime were also determined.
Echocardiography was performed using commercially available
9
ultrasound systems (iE33; Philips, Amsterdam, Netherlands; Vivid E9; GE Healthcare UK Ltd, Amersham, England, UK). Standard echocardiographic measurements were obtained in accordance with the current guidelines of the American Society of Echocardiography/European Association of Cardiovascular Imaging
13). Specifically, the early diastolic (E) velocities and the E-wave deceleration time were measured using the pulsed-wave Doppler recording from the apical four chamber view. Spectral
pulsed-wave Doppler-derived lateral early diastolic velocity (eʹ) was
considered as the lateral mitral annulus, and the E/eʹ ratio was calculated to estimate the left ventricular filling pressure.
Laboratory measurements
The serum total cholesterol, low-density lipoprotein cholesterol, high-density lipoprotein cholesterol, triglycerides and creatinine levels were measured using an automated analyzer (BM6070; Japan Electron Optics Laboratory, Tokyo, Japan). Plasma glucose was measured using the glucose oxidase method, whereas HbA1c was measured using
high-performance liquid chromatography
14)while GA was detected using
10
the bromocresol purple method.
Statistical analysis
Data are expressed as mean ± SD. Spearman's rank correlation
coefficient was used to determine univariate analysis. Multiple stepwise regression analysis (forward–backward stepwise selection method) was used to assess independent contributors to the E/eʹ ratio. Analyses were performed using IBM SPSS, version 22, for Windows (IBM Corp; Armonk, NY, USA) with p-values < 0.05 indicating statistical significance.
Results
Clinical characteristics
Table 1 shows the clinical and laboratory characteristics of the 23
participants. Participants had a mean age of 69.0 ± 10.6 years, diabetes
duration of 11.0 ± 10.5 years, and HbA1c level of 8.2% ± 1.3%. The study
group included more men (n = 14) than women (n = 9), and participants
were slightly overweight (BMI = 24.2 ± 4.7 kg/m
2). The left ventricular
11
ejection fraction was 63.6% ± 6.1% and the E/eʹ ratio was 7.1 ± 2.0. At baseline, 56.5% of the patients were on diet therapy, 39.1% were taking angiotensin 2 receptor blockers, 30.4% were taking calcium channel blockers for hypertension treatment, 47.8% were taking dipeptidyl peptidase 4 inhibitors, and 43.5% were on insulin therapy for diabetes treatment.
Relationship between E/eʹ ratio, E, and eʹ and markers of BP variability glucose metabolism, and non-glycemic clinical and laboratory variables
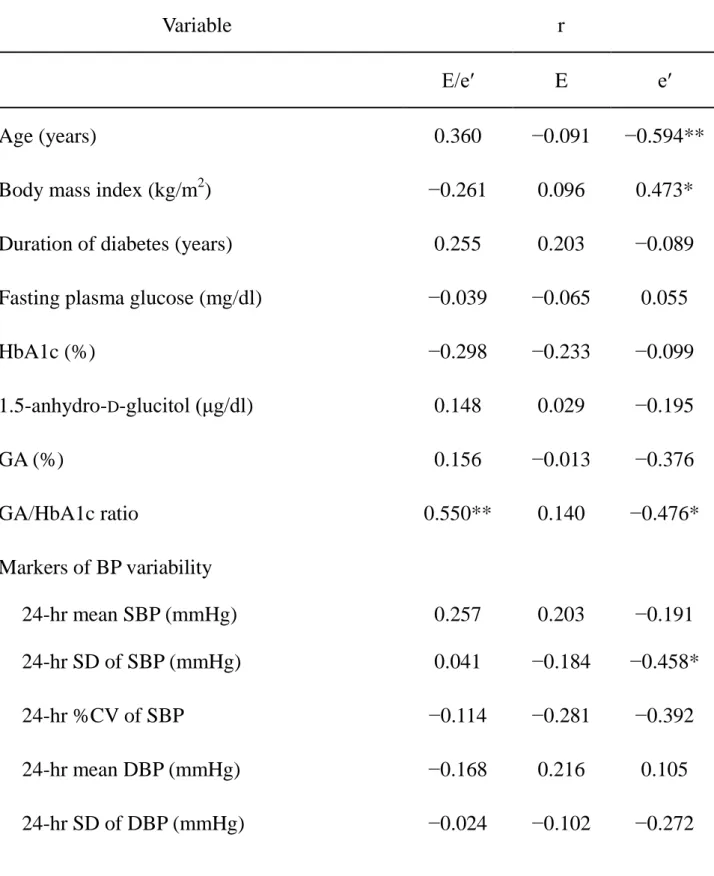
Table 2 shows the correlations between the E/eʹ ratio, E, and eʹ and the
markers of BP variability, glucose metabolism, and non-glycemic clinical
and laboratory variables. Significant correlations were observed between
the E/eʹ ratio and ejection fraction (p = 0.047), nighttime mean SBP (p =
0.031), nighttime SD of SBP (p = 0.019), nighttime SD of DBP (p = 0.023),
GA/HbA1c ratio (p = 0.007), 24-hr pulse pressure (p = 0.017), daytime
pulse pressure (p = 0.026), nighttime pulse pressure (p = 0.009), urinary
albumin-to-creatinine ratio (p = 0.037), and eGFR (p = 0.043). However,
no significant correlation was observed between the E/eʹ ratio and fasting
12
plasma glucose, HbA1c, and non-glycemic variables.
E/eʹ showed a positive correlation with the GA/HbA1c ratio, as depicted in Table 2. In addition, the E/eʹ ratio in patients with a GA/HbA1c ratio ≥ 2.8 was more than that in patients with a GA/HbA1c ratio < 2.8 (Fig. 2).
Significant correlations were also observed between E and daytime %CV of SBP (p = 0.034), and between eʹ and 24-hr SD of SBP (p = 0.032),
daytime SD of SBP (p = 0.003), daytime %CV of SBP (p = 0.001), 24-hr pulse pressure (p = 0.046), nighttime pulse pressure (p = 0.040), age (p = 0.004), BMI (p = 0.026), and GA/HbA1c ratio (p = 0.025; Table 2).
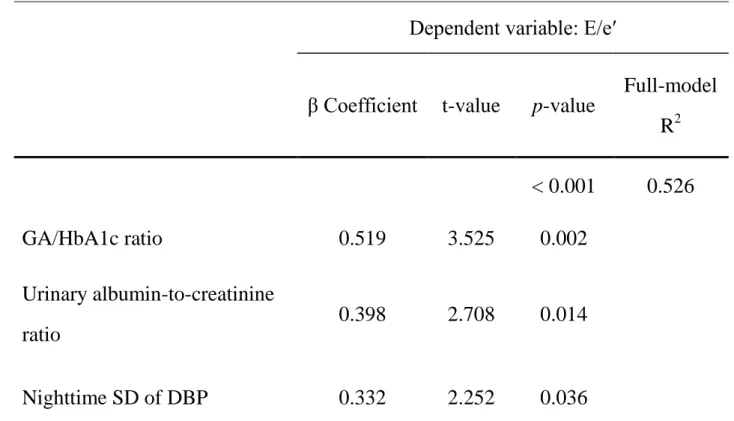
Multivariate analysis identified the GA/HbA1c ratio, urinary
albumin-to-creatinine ratio, and nighttime SD of DBP as independent and significant determinants of the E/eʹ ratio (adjusted multiple R
2= 0.526;
Table 3).
Discussion
To the best of our knowledge, no previous studies have investigated the
relationship between cardiac diastolic function, glucose, and BP variability
13
in patients with T2DM with hypertension. Our findings are pertinent to the clinical management of T2DM with hypertension and highlight the
importance of GA and BP variability, in addition to glucose and BP levels.
Hypertension induces endothelial dysfunction via oxidative stress
15). In cardiomyocytes, hypertension-induced oxidative stress causes
S-glutathionylation of the myofibrillar protein, cardiac myosin binding protein C, leading to diastolic dysfunction
16). Previous studies have reported that T2DM and hypertension are closely associated with heart failure with preserved ejection fraction
17,18). T2DM and hypertension increases oxidative stress in the heart and blood vessels and leads to vascular endothelial dysfunction, left ventricular hypertrophy, and
interstitial fibrosis
19). The extent of microalbuminuria is correlated with the level of endothelial cell injury; hence, the urinary albumin-to-creatinine ratio is thought to be correlated with the E/eʹ ratio. Therefore, it is
speculated that increased oxidative stress ultimately leads to the onset of cardiac diastolic dysfunction.
Postprandial plasma glucose is reported to be more closely related to
cardiovascular disease than fasting plasma glucose. Furthermore, glucose
14
variability is important in patients with T2DM
11)as it induces endothelial dysfunction via oxidative stress, as well as the progression of
arteriosclerosis that causes cardiovascular disease
20). In clinical studies, MAGE calculated using CGM is used as a glucose variability index. Indeed, we previously reported a relationship between MAGE and oxidative stress
9). Recently, the GA/HbA1c ratio has been shown to be a reliable marker of glucose variability, regardless of the degree of glycemic control
21). Albumin is glycosylated much more easily than hemoglobin
22), and as blood glucose levels increase, the GA/HbA1c ratio also increases. Furthermore, patients with a GA/HbA1c ratio ≥ 2.8 show the highest SD
23). Our study
demonstrated that E/eʹ is associated with the GA/HbA1c ratio; furthermore, patients with a GA/HbA1c ratio ≥ 2.8 had a high E/eʹ ratio. Therefore, we propose that chronic hyperglycemia is not the cause, but that glucose variability leads to oxidative stress and, ultimately, cardiac dysfunction.
Studies have reported a relationship between cardiovascular disease and BP variability evaluated via ABPM. Accordingly, several studies have demonstrated that nighttime SBP variability is a risk factor for
cardiovascular disease
24). However, the present study showed that nighttime
15
DBP variability was associated with cardiac function. This mechanism is unknown, but could be explained by the following pathophysiological mechanism. Low DBP may compromise blood flow to target organs and impair coronary perfusion, causing cardiac ischemia
25). Therefore, a large DBP variability is considered to be related to cardiac function due to the impairment of coronary perfusion.
The present study has several limitations. First, this was a cross-sectional study, precluding the evaluation of any cause and effect relationship
between glucose and BP variability and cardiac diastolic function. Further studies are required to examine whether interventions to reduce glucose and BP variability are required. Second, we did not evaluate the
relationship between cardiac diastolic function and oxidative stress. Third, the sample size was relatively small and any subgroup comparison may lack statistical power. Significant correlations were observed between E/eʹ and nighttime mean SBP, nighttime SD of SBP, and nighttime SD of DBP.
Conversely, significant correlations were observed between eʹ and 24-hr SD
of SBP and daytime SD of SBP. The reason that the result differs between
E/eʹ and eʹ may be because eʹ is influenced by age. However, because the
16
sample size is small, we found it difficult to study this in detail. Fourth, we were unable to use CGM to evaluate glucose variability. Fifth, since the glycemic control of the patients was poor, hyperglycemia and glucose variability may have had a significant effect on the results of our study.
Future studies are required to examine patients with good glycemic control.
Sixth, sleep apnea, which causes sympathetic activation, may have been a factor in the present study. Seventh, few patients had poorly controlled hypertension in the study. Therefore, it is difficult to compare patients with poorly controlled hypertension with patients with well-controlled
hypertension. Eighth, there was no patient with an E/eʹ ratio > 14, which is the cut-off level of E/eʹ for diastolic dysfunction, according to the Japanese guidelines for Diagnosis and Treatment of Acute and Chronic Heart Failure.
Finally, it has been reported that %CV of BP is useful as a BP variability
index
26). However, there was no significant relationship between %CV of
BP and E/eʹ. Hence, the relationship between the SD of BP and E/eʹ is
probably important, but the SD of BP positively correlates with the mean
BP. In future, it is necessary to investigate an increased number of cases
with these relationships in order to draw a firm conclusion.
17
In conclusion, the present study demonstrates that cardiac diastolic function is associated with the GA/HbA1c ratio and nighttime DBP variability in patients with T2DM and hypertension. While further intervention studies are required to determine whether reducing glucose variability as well as BP variability is associated with improved cardiac diastolic function, our results imply that glucose and BP variability are important factors affecting cardiac diastolic function.
Conflicts of interest
The authors have no conflicts of interest to disclose.
Acknowledgments
We would like to thank Enago (www.enago.jp) for the English language
review.
18
References
[1] Chen G, McAlister FA, Walker RL, et al. Cardiovascular outcomes in Framingham participants with diabetes: the importance of blood pressure.
Hypertension. 2011;57:891-897.
[2] Adler AI, Stratton IM, Neil HA, et al. Association of systolic blood pressure with macrovascular and microvascular complications of type 2 diabetes (UKPDS 36): prospective observational study. BMJ.
2000;321:412-419.
[3] Vazquez-Benitez G, Desai JR, Xu S, et al. Preventable major
cardiovascular events associated with uncontrolled glucose, blood pressure, and lipids and active smoking in adults with diabetes with and without cardiovascular disease: a contemporary analysis. Diabetes Care.
2015;38:905-912.
[4] Kannel WB, McGee DL. Diabetes and cardiovascular disease. The Framingham study. JAMA. 1979;241:2035-2038.
[5] Boonman-de Winter LJ, Rutten FH, Cramer MJ, et al. High prevalence
of previously unknown heart failure and left ventricular dysfunction in
patients with type 2 diabetes. Diabetologia. 2012;55:2154-2162.
19
[6] Ginelli P, Bella JN. Treatment of diastolic dysfunction in hypertension.
Nutr Metab Cardiovasc Dis. 2012;22:613-618.
[7] Hirakawa Y, Arima H, Zoungas S, et al. Impact of visit-to-visit glycemic variability on the risks of macrovascular and microvascular events and all-cause mortality in type 2 diabetes: the ADVANCE trial.
Diabetes Care. 2014;37:2359-2365
[8] Hata J, Arima H, Rothwell PM, et al. Effects of visit-to-visit variability in systolic blood pressure on macrovascular and microvascular
complications in patients with type 2 diabetes mellitus: the ADVANCE trial.
Circulation. 2013;128:1325-1334.
[9] Ohara M, Fukui T, Ouchi M, et al. Relationship between daily and day-to-day glycemic variability and increased oxidative stress in type 2 diabetes. Diabetes Res Clin Pract. 2016;122:62-70.
[10] Torimoto K, Okada Y, Mori H, et al. Relationship between fluctuations in glucose levels measured by continuous glucose monitoring and vascular endothelial dysfunction in type 2 diabetes mellitus. Cardiovasc Diabetol.
2013;12:1.
[11] Su G, Mi S, Tao H, et al. Association of glycemic variability and the
20
presence and severity of coronary artery disease in patients with type 2 diabetes. Cardiovasc Diabetol. 2011;10:19.
[12] Eguchi K, Ishikawa J, Hoshide S, et al. Night time blood pressure variability is a strong predictor for cardiovascular events in patients with type 2 diabetes. Am J Hypertens. 2009;22:46-51.
[13] Lang RM, Badano LP, Mor-Avi V, et al. Recommendations for cardiac chamber quantification by echocardiography in adults: an update from the American Society of Echocardiography and the European Association of Cardiovascular Imaging. J Am Soc Echocardiogr. 2015;28:1-39.e14.
[14] Schnedl WJ, Lahousen T, Wallner SJ, et al. Silent hemoglobin variants and determination of HbA(1c) with the high-resolution program of the HPLC HA-8160 hemoglobin analyzer. Clin Biochem. 2005;38:88-91.
[15] Higashi Y, Sasaki S, Nakagawa K, et al. Endothelial function and oxidative stress in renovascular hypertension. N Engl J Med.
2002;346:1954-1962.
[16] Jeong EM, Monasky MM, Gu L, et al. Tetrahydrobiopterin improves
diastolic dysfunction by reversing changes in myofilament properties. J
Mol Cell Cardiol. 2013;56:44-54.
21
[17] Redfield MM, Jacobsen SJ, Burnett JC Jr, et al. Burden of systolic and diastolic ventricular dysfunction in the community: appreciating the scope of the heart failure epidemic. JAMA. 2003;289:194-202.
[18] Patil VC, Patil HV, Shah KB, et al. Diastolic dysfunction in
asymptomatic type 2 diabetes mellitus with normal systolic function. J Cardiovasc Dis Res. 2011;2:213-222.
[19] Paulus WJ, Tschöpe C. A novel paradigm for heart failure with preserved ejection fraction: comorbidities drive myocardial dysfunction and remodeling through coronary microvascular endothelial inflammation.
J Am Coll Cardiol. 2013;62:263-271.
[20] Ceriello A. The post-prandial state and cardiovascular disease:
relevance to diabetes mellitus. Diabetes Metab Res Rev. 2000;16:125-132.
[21] Tanaka C, Saisho Y, Tanaka K, et al. Factors associated with glycemic variability in Japanese patients with diabetes. Diabetol Int. 2014;5:36-42.
[22] Day JF, Ingebretsen CG, Ingebretsen WR Jr, et al. Nonenzymatic glucosylation of serum proteins and hemoglobin: response to changes in blood glucose levels in diabetic rats. Diabetes. 1980;29:524-527.
[23] Ogawa A, Hayashi A, Kishihara E, et al. New indices for predicting
22
glycaemic variability. PLoS One. 2012;7:e46517.
[24] Eguchi K, Ishikawa J, Hoshide S, et al. Night time blood pressure variability is a strong predictor for cardiovascular events in patients with type 2 diabetes. Am J Hypertens. 2009;22:46-51.
[25] Messerli FH, Mancia G, Conti CR, et al. Dogma disputed: can aggressively lowering blood pressure in hypertensive patients with
coronary artery disease be dangerous? Ann Intern Med. 2006;144:884-893.
[26] Kikuya M, Ohkubo T, Metoki H, et al. Day-by-day variability of blood pressure and heart rate at home as a novel predictor of prognosis: the
Ohasama study. Hypertension. 2008;52:1045-1050.
23
Tables
Table 1. Baseline clinical characteristics of the study participants
Clinical characteristics Mean ± SD, n (%)
Age (years) 69.0 ± 10.6
Sex (male) 14 (60.9)
Body mass index (kg/m
2) 24.2 ± 4.7
Smoking 4 (17.4)
Duration of diabetes (years) 11.0 ± 10.5
Dyslipidemia 22 (95.7)
Low-density lipoprotein cholesterol (mg/dl) 98.0 ± 30.5 High-density lipoprotein cholesterol (mg/dl) 46.1 ± 13.1
Triglycerides (mg/dl) 134.4 ± 60.3
Estimated glomerular filtration rate (ml/min/1.73 m
2) 69.2 ± 19.7 Urinary albumin-to-creatinine ratio (mg/g) 68.3 ± 188.6
Fasting plasma glucose (mg/dl) 132.4 ± 30.8
HbA1c (%) 8.2 ± 1.3
1.5-anhydro-
D-glucitol (μg/dl) 4.9 ± 8.2
GA (%) 22.0 ± 4.2
24
GA/HbA1c ratio 2.7 ± 0.4
Markers of BP variability
24-hr mean SBP (mmHg) 124.5 ± 12.2
24-hr SD of SBP (mmHg) 12.6 ± 3.6
24-hr %CV of SBP 10.0 ± 2.6
24-hr mean DBP (mmHg) 77.0 ± 7.6
24-hr SD of DBP (mmHg) 9.6 ± 2.4
24-hr %CV of DBP 12.6 ± 3.1
Daytime mean SBP (mmHg) 125.5 ± 12.0
Daytime SD of SBP (mmHg) 12.3 ± 3.9
Daytime %CV of SBP 9.7 ± 2.8
Daytime mean DBP (mmHg) 78.1 ± 7.7
Daytime SD of DBP (mmHg) 9.2 ± 2.6
Daytime %CV of DBP 11.8 ± 3.2
Nighttime mean SBP (mmHg) 119.1 ± 16.2
Nighttime SD of SBP (mmHg) 8.9 ± 4.3
Nighttime %CV of SBP 7.4 ± 3.2
Nighttime mean DBP (mmHg) 72.0 ± 9.3
25
Nighttime SD of DBP (mmHg) 7.8 ± 2.8
Nighttime %CV of DBP 11.1 ± 4.2
24-hr pulse pressure (mmHg) 47.5 ± 9.0
Daytime pulse pressure (mmHg) 47.3 ± 8.9
Nighttime pulse pressure (mmHg) 47.1 ± 10.4
Ejection fraction (%) 63.6 ± 6.1
E/eʹ 7.1 ± 2.0
Macroangiopathy 7 (23.3)
Nephropathy 5 (21.7)
Neuropathy 15 (65.2)
Retinopathy 2 (8.7)
Diabetes therapy
Diet alone 3 (13.0)
Metformin 6 (26.1)
Sulfonylurea 4 (17.4)
Glinide 0 (0.0)
α-Glucosidase inhibitor 3 (13.0)
Thiazolidine 1 (4.3)
26
Data represent mean ± SD, or n (%). SD, standard deviation; HbA1c, glycated hemoglobin; GA, glycated albumin; BP, blood pressure; SBP, systolic blood pressure; DBP, diastolic blood pressure; %CV, percentage coefficient of
variation; E/eʹ, early diastolic transmitral inflow velocity/lateral early diastolic mitral annular velocity.
Dipeptidyl peptidase 4 inhibitor 11 (47.8)
Sodium glucose cotransporter 2 inhibitors 5 (21.7) Glucose-like peptide 1 receptor agonist 0 (0.0)
Insulin 12 (52.2)
Antihypertensive drugs
Diet alone 13 (56.5)
Angiotensin II receptor blocker 9 (39.1)
Calcium channel blocker 7 (30.4)
Diuretic 1 (4.3)
α-blocker 0 (0.0)
β-blocker 3 (12.0)
Other treatments 0 (0.0)
Lipid-lowering drugs (statins) 13 (56.5)
27
Table 2. Correlations between E/eʹ, E, and eʹ and markers of BP control, glycemic control, and non-glycemic metabolic variables
Variable r
E/eʹ E eʹ
Age (years) 0.360 −0.091 −0.594**
Body mass index (kg/m
2) −0.261 0.096 0.473*
Duration of diabetes (years) 0.255 0.203 −0.089
Fasting plasma glucose (mg/dl) −0.039 −0.065 0.055
HbA1c (%) −0.298 −0.233 −0.099
1.5-anhydro-
D-glucitol (μg/dl) 0.148 0.029 −0.195
GA (%) 0.156 −0.013 −0.376
GA/HbA1c ratio 0.550** 0.140 −0.476*
Markers of BP variability
24-hr mean SBP (mmHg) 0.257 0.203 −0.191
24-hr SD of SBP (mmHg) 0.041 −0.184 −0.458*
24-hr %CV of SBP −0.114 −0.281 −0.392
24-hr mean DBP (mmHg) −0.168 0.216 0.105
24-hr SD of DBP (mmHg) −0.024 −0.102 −0.272
28
24-hr %CV of DBP −0.048 -0.143 −0.249
Daytime mean SBP (mmHg) 0.230 0.197 −0.173
Daytime SD of SBP (mmHg) 0.094 −0.343 −0.600**
Daytime %CV of SBP −0.029 −0.445* -0.639**
Daytime mean DBP (mmHg) −0.245 0.138 0.121
Daytime SD of DBP (mmHg) 0.001 −0.120 −0.357
Daytime %CV of DBP −0.010 −0.176 −0.393
Nighttime mean SBP (mmHg) 0.450* 0.150 −0.385
Nighttime SD of SBP (mmHg) 0.484* 0.183 −0.159
Nighttime %CV of SBP 0.266 0.177 0.055
Nighttime mean DBP (mmHg) 0.307 0.032 −0.302
Nighttime SD of DBP (mmHg) 0.473* 0.084 −0.237
Nighttime %CV of DBP 0.250 0.081 −0.020
24-hr pulse pressure (mmHg) 0.492* 0.117 −0.430*
Daytime pulse pressure (mmHg) 0.463* 0.112 −0.405 Nighttime pulse pressure (mmHg) 0.529** 0.099 −0.441*
Low-density lipoprotein cholesterol (mg/dl) 0.126 0.073 −0.045
High-density lipoprotein cholesterol (mg/dl) −0.359 −0.153 0.173
29
*p < 0.05, **p < 0.01. BP, blood pressure; E, early diastolic transmitral inflow velocity; eʹ, lateral early diastolic mitral annular velocity; HbA1c, glycated hemoglobin; GA, glycated albumin; SBP, systolic blood pressure;
SD, standard deviation; %CV, percentage coefficient of variation; DBP, diastolic blood pressure; GFR, glomerular filtration rate.
Triglycerides (mg/dl) −0.278 0.064 0.135
Estimated GFR (ml/min/1.73 m
2) −0.425* −0.040 0.236 Urinary albumin-to-creatinine ratio (mg/g) 0.438* 0.359 −0.043
Ejection fraction (%) −0.418* −0.123 0.100
30
Table 3. Linear multivariate analyses with E/eʹ as dependent variable
E/eʹ, early diastolic transmitral inflow velocity/lateral early diastolic mitral annular velocity; GA, glycated albumin; HbA1c, glycated hemoglobin; SD, standard deviation; DBP, diastolic blood pressure.
Dependent variable: E/eʹ
β Coefficient t-value p-value
Full-model R
2< 0.001 0.526
GA/HbA1c ratio 0.519 3.525 0.002
Urinary albumin-to-creatinine ratio
0.398 2.708 0.014
Nighttime SD of DBP 0.332 2.252 0.036
31
Figure legends
Figure 1. Study protocol. Laboratory parameters were measured before breakfast on day 2. Parameters of blood pressure variability were measured for 24 hours, starting on day 2. Echocardiography was performed on day 3.
ABPM, ambulatory blood pressure monitoring.
Figure 2. E/eʹ ratio in patients with GA/HbA1c ratio ≥ 2.8 or < 2.8. E/e′,
early diastolic transmitral inflow velocity/lateral early diastolic mitral
annular velocity; GA, glycated albumin; HbA1c, glycated hemoglobin.
32 0
2 4 6 8 10 12
Figures Figure 1
Figure 2
E/eʹ
n = 8
GA/HbA1c ≥ 2.8
n = 15
GA/HbA1c < 2.8