in Vietnam: Findings from the WHO STEPS Survey
学位名
修士(公衆衛生学)
学位授与機関
聖路加国際大学
学位授与年度
2020
学位授与番号
32633公修専第064
URL
http://hdl.handle.net/10285/00016414
Factors Associated with Overweight and Obesity in Vietnam:
Findings from the WHO STEPS Survey
Tomoka Funasaka1) Capstone Supervisors:
Prof. Huy Van Nguyen1),Prof. Hiroyoshi Endo1), Prof. Junko Yasuoka1)
2 Table of Contents Acknowledgement ... 4 Abstract ... 5 1. Introduction ... 7 2. Literature review ... 9
The pattern of adult overweight and obesity in Vietnam ... 9
Factors associated with overweight and obesity among Vietnamese adults... 9
3. Methods... 10
3.1 Design and Data Collection ... 10
3.2 Main outcomes, key predictors and covariates ... 10
3.3 Data analysis ... 12
3.4 Research Ethics ... 13
4. Results ... 13
4.1 Socio-economic Demographic Characteristics of the Respondents ... 13
4.2 Overweight and Obesity Patterns among the Respondents ... 15
4.2.1. Overweight and Obesity Patterns by Key Socio-economic and Demographic Characteristics ... 15
4.2.2. Overweight and Obesity Patterns by Risk Behaviors and Intervention Factors ... 17
4.3 Factors Associated with Overweight and Obesity ... 19
4.3.1. Bivariate Analysis of the Association between Overweight and Obesity and Different Factors ... 19
4.3.2. Multiple Logistic Regression Model of Factors Associated with Overweight and Obesity ... 24
5. Discussion ... 27
The pattern of overweight and obesity... 28
Factors associated with overweight ... 29
Factors associated with obesity ... 30
Limitations ... 31
3 References ... 34 Appendices ... 39 Appendix A ... 39 Appendix B ... 43 Appendix C ... 48
List of Tables and Figure Table 1 Selected Socio-economic Demographic Characteristics of the Respondents ... 14
Table 2 Overweight and Obesity Patterns by Socio-economic and Demographic Characteristics ... 15
Table 3 Overweight and Obesity Classified by Risk and Intervention Factors ... 18
Table 4 Bivariate Analysis of Selected Factors Associated with Overweight (Selected) .... 20
Table 5 Bivariate Analysis of Factors Associated with Obesity... 23
Table 6 Multiple Logistic Regression Model of Factors Associated with Overweight ... 24
Table 7 Multiple Logistic Regression Model of Factors Associated with Obesity ... 26
Table 3 (Full version) Overweight and Obesity Classified by Risk and Intervention Factors ... 39
Table 4 (Full version) Bivariate Analysis of Selected Factors Associated with Overweight43 Table 5 (Full version) Bivariate Analysis of Factors Associated with Obesity ... 48
4
Acknowledgement
First of all, I would like to express my deepest appreciation to my capstone supervisors, Professors Hiroyoshi Endo, Huy Van Nguyen and Junko Yasuoka for their consistent support and guidance during the running of this project. Professor Endo offered me the opportunities to work with the greatest faculties and provided me the clear map and direction of my final massive work of my masters’ course. Professor Huy patiently helped me all the time, even when I lost the way of this work and provided me the best guidance for the whole process of this study.
Professor Yasuoka always gave me kind and supportive advice and encouraged to keep working on this research. Without such great support from these excellent supervisors, I am quite sure that I would not have been able to complete this big project. Moreover, I would like to say a special thank you to Professor Minh Van Hoang for willingly offering this important national data and providing me valuable contribution to my study. I am also deeply grateful to my mentor, Professor Katharina da Silva Lopes for great attention to my student life and providing me kind support.
All my wonderful classmates gave me a positive stimulation and passions for the public health field. Thanks to their encouragement and support, my student life was very fulfilling and constituted very precious moments in my life. I also thank my colleagues for allowing me to continue my master’s study and giving me great support even during busy periods.
Lastly, I would like to show my deepest appreciation to my family for all their
encouragement and support. I am extremely happy to have experienced studying at St. Luke’s International University, Graduate School of Public Health.
5
Abstract
Background: Non-communicable diseases (NCDs) have emerged as a critical concern of
developing countries, including Vietnam, in recent decades. Among the contributors to NCDs, overweight and obesity are considered as major risk factors. Although some studies have reported overweight and obesity in Vietnamese before 2015, little study has provided an insight into this area, especially in the new context.
Objectives: This study examined the pattern of overweight and obesity, based on the WHO
STEPS survey data, in Vietnam and analyzed the factors associated with overweight and obesity among Vietnamese adults.
Methods: Using the WHO STEPS Vietnam 2015 survey data based on a representative large
sample, a secondary analysis was conducted. Both bivariate and multivariable analysis were performed to describe the overweight and obesity patterns and their associations with overweight and obesity.
Results: Both overweight (13.75%, 95%CI: [12.21 - 15.45%]) and obesity (1.69%, 95%CI: [1.20
-2.37%]) was more prevalent in comparison with prior data in Vietnam. When stratified by different variables, overweight and obesity was found to be higher among older ages, non-employed, less educated, urban residents and non-smoking groups. The multiple regression models identified that adjusted for other covariates, the odds of overweight increases 7% (AOR: 1.07, 95%CI: [1.02 - 1.11]) for respondents who reported fewer prepared home meals per week. Odds of obesity decreased 18% for increased vegetable consumption (AOR: 0.82, 95%CI: [0.68 -0.98]), but were 2.55 times higher among those experienced with measured cholesterol (AOR: 2.55, 95%CI: [1.16 - 5.58]). The important confounder of both overweight and obesity was
6 education level of respondents, with higher odds of those factors among respondents with less formal education.
Conclusions: Given that overweight and obesity are prevalent in Vietnam, NCD prevention is
important. A public health policy and practice that considers both short-term and long-term strategies can be anticipated. Future research using a longitudinal and/or intervention design should provide better evidence for further directions of overweight and obesity prevention and control in Vietnam. This study could provide a case study for consideration in similar Southeast Asian settings.
7
Introduction
It is believed that Non-communicable diseases (NCDs) is the major threat of high-income countries(Global Status Report on Noncommunicable Diseases 2010; Cuevas García-Dorado et al., 2019). However, recently it has emerged as another issue for low-and niddle-income
countries as well as the existing risk of communicable diseases (Abarca-Gómez et al., 2017; Bennett et al., 2020; NCD Risk Factor Collaboration, 2016). As evidence of the increase of NCD burden, the Sustainable Developing Goals (SDGs) includes a specific target for NCDs and several NCD-related targets. Unlike the Millennium Development Goals (MDGs), the SDG Target 3.4 is defined as a one third reduction in premature mortality from NCDs by 2030. (WHO | NCD & Sustainable Development Goals, n.d.)
According to the World Health Organization (WHO) report, overweight and obesity is a major risk factor for such NCDs as cardiovascular diseases (mainly heart disease and stroke), diabetes, musculoskeletal disorders (especially osteoarthritis), and some cancers. Increases in BMI increase the risk for those NCDs. (Di Angelantonio et al., 2016; WHO |Obesity and Overweight, n.d.) Worldwide obesity has increased three times since 1975. In 2016, more than 1.9 million adults (18 year older) were overweight and over 650 million of those were obese (WHO \ Obesity, n.d.). Many low- and middle-income countries are now facing the "double burden" of obesity and malnutrition (WHO | Double Burden of Malnutrition, n.d.). Vietnam is not exception. Importantly, some surveys have been conducted to demonstrate the prevalence and risk factors of NCDs (Cuong et al., 2007; Minh et al., 2007; Nguyen & Trevisan, 2020; Pham et al., 2009). STEPS is a wide surveillance approach introduced by the World Health Organization and it was implemented by the Ministry of Health General Preventive Medicine in Vietnam and reported in the National Survey on The Risk Factors of Non-Communicable
8 Diseases (STEPS) Viet Nam, 2015, (n.d.) (hereafter called STEPS Viet Nam 2015). In that summary of STEPS, they reported that for Vietnam, the prevalence of overweight and obesity was 15.6% and had significantly increased from 12.0%, 95%CI: [11.2 -12.8] in 2010 to 17.5%, 95%CI: [15.5 - 19.5] in 2015. Additionally, it was estimated that even though the 2015
prevalence of overweight and obesity was not so high compared to other countries, it was anticipated to continue to rapidly increase.
According to the fact sheet from WHO, the basic cause of obesity and overweight is an energy imbalance, which is the balance of calories consumption and calories expenditure. Those are led by intake of energy-dense foods and physical inactivity (WHO | Obesity and Overweight, n.d.). Researchers also indicated that an increase in prevalence of overweight can be attributed to significant alterations in eating habits and physical activity level caused by socioeconomic influences in developing countries (Bhurosy & Jeewon, 2014). Although some studies have reported overweight and obesity for Vietnamese before 2015 (Binh et al., 2014; Bui et al., 2016; Nguyen et al., 2012), little have given an insight into this area, especially in the new context of malnutrition and obesity. Also, most studies have targeted overweight and obesity in children rather than in adults. (Do et al., 2017; Hoang et al., 2018; Pham et al., 2019) The STEPS survey report clarified that overweight and obesity was significantly increasing (STEPS Viet Nam 2015, n.d.). However, the trends of overweight and obesity or what factors have been associated with them were not examined within the STEPS survey report or in any other studies. Therefore, an additional analysis of the 2015 Vietnamese STEPS survey should prove helpful for informing public health policy and for establishing preventive practices related to overweight and obesity. Given that little has been known about overweight and obesity in STEPS, the objectives of this study are:
9 1. To examine the pattern of overweight and obesity based on the 2015 WHO STEPS survey
data for Vietnam.
1. To analyze selected factors associated with overweight and obesity for Vietnamese adults.
Literature review
Patterns of Adult Overweight and Obesity in Vietnam
According to the summary report of STEPS, the prevalence of overweight and obesity was 15.6% and the increase was significant (STEPS Viet Nam 2015, n.d.). It increased from 12.0%, 95%CI: [11.2 - 12.8] in 2010 to 17.5%, 95%CI: [15.5 - 19.5] in 2015 among 25-64 years old. It is estimated that even though the current (2015) prevalence of overweight and obesity is not as high compared to other countries, it will continue to rapidly rise.(STEPS Viet Nam, 2015, n.d.). Nguyen & Trevisan (2020) also reported on the temporal trends among overweight and obesity in Vietnam. The prevalence indicated a 550% increase nationally between 1993 and 2015 (Nguyen & Trevisan, 2020). However, the details of the BMI status patterns were not reported in recent decades.
Factors Associated with Overweight and Obesity Among Vietnamese Adults
Although some studies have reported overweight and obesity for Vietnamese before 2015 (Binh et al., 2014; Bui et al., 2016; Nguyen et al., 2012), the factors associated with overweight and obesity are few. Even though the associated factors were well analyzed in several studies, most those recent studies have targeted Vietnamese children’s overweight and obesity status rather than Vietnamese adults’ overweight and obesity (Do et al., 2017; Hoang et al., 2018; Pham et al., 2019).
10
Methods
Design and Data Collection
This was a secondary data analysis study using WHO STEPS Vietnam 2015 which was a cross sectional quantitative survey applying methods and tools of the WHO STEPS wise
approach to NCD risk factor surveillance. It was conducted between June and October 2015 and the Ministry of Health (MOH) General Department of Preventive Medicine in Vietnam reported the results in 2016. All 63 provinces/cities of Viet Nam were surveyed. The participants were Vietnamese people who were residing in Vietnam, aged 18 through 69 years old. To enroll participants, the multi-stages complex sampling process was applied. Hence, 3,758 participants completed STEPS 1 (response rate for STEPS 1, 97.4%) then 678 cases dropped out for STEPS 2 and 3, leaving 3,080 participants who completed questionnaire for these all STEPS (79.8%). In the survey, height and weight were measured by staff of provincial preventive medicine centers under the supervision of the National and Regional Epidemiology/Pasteur Institutes at selected Commune Health Station. Standard stadiometer and constant tension tape were used for
measuring height and standard electronic scales recommended by WHO (330 HRS) were utilized for measuring weight (STEPS VIET NAM, 2015, n.d.).
Main Outcomes, Key Predictors and Covariates
Overweight and obesity were the main outcomes for this study. Overweight was defined as a Body Mass Index (BMI) of 25.0 - 29.9 and obesity was defined as BMI over 30 based on WHO definitions (WHO, Obesity and Overweight, n.d.).
Key predictors were determined with following process. First, we developed the theoretical framework driving adult overweight and obesity referring to the Sartorius et al. (2015) and Choi et al. (2017) studies (Figure 1) and then we compared the theoretical framework
11 with STEPS questionnaire. Last, we examined the variables, which we can apply to this study. (Sartorius et al., 2015; Choi et al., 2017) Key predictors were eating habits (alcohol drinking, the number of days of vegetable or fruit consumption per week, the number of vegetable or fruit servings per day, the amount of added salt, type of oil, and the number of meals [such as breakfast, lunch and dinner] not prepared at home per week), physical activities (vigorous-intensity and moderate-(vigorous-intensity activity at work or leisure time, walk or use bicycle at least 10 minutes, work outside, sitting or reclining time), lifestyle advice (quit using tobacco or don’t start, eat more fruit and/or vegetables each day, eat at least five servings of fruit and/or vegetables each day, reduce fat in your diet, start or do more physical activity, maintain a healthy body weight or lose weight) and NCD treatment and management (currently have NCDs, visits to health care facility in one month, experience of measuring blood pressure, experience of measuring blood sugar, experience of measuring cholesterol). Covariates are gender (male, female), age categories (18-29, 30-49, 50-69), employment (employee and self-employed or not),
education (no formal education, not having completed primary education, having completed
primary education, having completed basic secondary education, having completed secondary school, at least graduated university/college / specialized secondary education), marital status (unmarried, married, separated / divorced / widowed), living location (urban, rural), economic
12
Figure 1
Theoretical Framework Driving Adult Overweight and Obesity
Data Analysis
To begin, missing values were imputed using a multiple imputation technique supported with Stata 16.1 Software. Because two-stage sampling was used on this survey, the sampling probability was calculated for each primary sampling unit and household separately. All the results demonstrated in this study reflect the survey design and weights. To deal with sampling error, Tailor-linearized standard errors were used to estimate 95% confidence intervals. We applied the Stata svy command procedure to take into account the complex survey design.
To analyze data for the first objective, we used descriptive and bivariate analyses to examine the pattern of overweight and obesity, we calculated the unweighted observation numbers and weighted percentage and the 95%CI for each BMI status. We applied the Chi-squared test for comparing proportions and ANOVA-based F-test to compare means.
13 For the second objective, factors associated with overweight and obesity, first we
conducted unadjusted analysis (bivariable analysis) to identify potential confounders.
Multivariable analysis was then individually performed for overweight and obesity status. To detect the appropriate multivariable regression model, the backward selection procedures were applied to select the independent variables that were significant and/or reached the cutoff point of p <0.2.
Research Ethics
The Institutional Review Board of Hanoi University of Public Health approved the STEPS survey protocol. All participants in the study provided their written informed consent before data were collected, and all were informed they had the right to withdraw from the study at any time. (Hoang et al., 2019). Despite the use of secondary data for analysis, St. Luke’s International University approved our current study in June 2020 (reference number: 20-R049). The study adhered to ethical principles of research on human subjects.
Results
Socio-economic Demographic Characteristics of the Respondents
Table 1 shows the selected socio-economic demographic characteristics of the respondents. While the weighted proportion of men and women was quite balanced (51.46% versus 48.54%), most of the respondents were 30-49 years (42.11%), employed and self-employed (81.38%), married (74.59%), rural residents (60.13%), and non-smokers (73.61%). Regarding BMI status, the majority of respondents was normal weight (BMI 18.5 - 24.9) with the weighted proportion of 72.90%, 95%CI: [70.74 - 74.95] , followed by overweight (BMI 25.0
14 - 29.9), 13.75%,95%CI: [12.21 - 15.45] , underweight (BMI <18.5), 11.66%, 95%CI: [10.15 - 13.35], and the least was obesity (BMI > 30), 1.69%, 95%CI: [1.20 - 2.37].
Table 1
Selected Socio-economic Demographic Characteristics of the Respondents
Unweighted observations Weighted percent (95%CI) Gender, n (%) 3,758 Men 1,676 51.46 (49.36-53.55) Women 2,082 48.54 (46.45-50.64 Age category, n (%) 3,758 18-29 691 36.38 (34.07-38.76) 30-49 1,820 42.11 (40.08-44.17) 50-69 1,247 21.51 (20.0-23.10) BMI, n (%) 3,042 21.98 (21.81-22.16) Underweight (<18.5) 312 11.66 (10.15-13.35) Normal weight (18.5 - 24.9) 2,227 72.90 (70.74-74.95) Overweight (25.0 - 29.9) 461 13.75 (12.21-15.45) Obesity (>30) 59 1.69 (1.20-2.37) Employment, n (%) 3,745 Unemployed 577 15.85 (14.13-17,73) Employed 789 24.09 (21.91-26.42) Self-employed 2,208 57.29 (54.92-59.63) Retired 184 2.77 (2.25-3.40) Education, n (%) 3,746
Not having completed primary education 642 14.83 (12.99-16.88)
Having completed primary education 803 20.17 (18.33-22.14)
Having completed basic secondary education 1,000 25.87 (23.76-28.09)
Having completed secondary school 627 20.14 (18.37-22.04)
At least Graduated Uni/College /Specialized secondary education
674 18.99 (17.03-21.12) Marital status, n (%) 3,740 Unmarried 442 20.24 (18.19-22.46) Married 2,937 74.59 (72.40-76.65) Separated/divorced/widowed 361 5.17 (4.52-5.92) Living location, n (%) 3,758 Urban 1,834 39.87 (38.25-41.51) Rural 1,924 60.13 (58.49-61.75) Economic quintile, n (%) 3,758 Lowest 766 19.16 (16.29-22.40)
15 Lower 944 23.72 (21.69-25.88) Middle 580 15.63 (14.02-17.39) Higher 704 20.06 (18.09-22.18) Highest 764 21.44 (19.17-28.89) Tobacco use, n (%) 3,747 Not at all 2,839 73.61 (71.50-75.61)
Less than daily 121 3.93 (3.15-4.89)
Daily 787 22.46 (20.55-24.50)
Overweight and Obesity Patterns among the Respondents
Overweight and Obesity Patterns by Key Socio-economic and Demographic Characteristics Table 2 demonstrates overweight and obesity patterns by key socio-economic and
demographic characteristics. There were significant differences in overweight and obesity by age category, employment status, education status, marital status, living location and economic quintile factors (p <0.05). Both overweight and obesity were more likely higher among those who were in higher age groups, non-employed, less educated, urban residents and non-smokers. While overweight was higher among the married and obesity was higher among the separated, divorced and widowed. However, overweight and obesity tended to be more prevalent among the higher socioeconomic groups. In terms of employment, both overweight and obesity were found more prevalent among the retired; obesity was more likely among the unemployed.
Table 2
Overweight and Obesity Patterns by Socio-economic and Demographic Characteristics
Underweight n=312 Normal weight n=2227 Overweight n=416 Obesity n=59 P Unweighted observations Weighted Percentage / Mean (95%CI)
Gender, n (%) 0.410 Men 133 10.74 (8.68-13.22) 987 74.55 (71.32-77.54) 182 13.01 (10.84-15.55) 23 1.69 (1.01-2.81) Women 179 12.59 (10.47-15.06) 1240 71.22 (68.33-73.94) 278 14.50 (12.59-16.65) 36 1.69 (1.14-2.52) Age category, n (%) <0.001
16 18-29 85 18.08 (14.52-22.28) 358 72.50 (67.59-76.92) 41 8.32 (5.79-11.82) 5 1.10 (0.39-3.06) 30-49 109 7.08 (5.74-8.70) 1122 75.31 (72.55-77.87) 229 16.17 (14.04-19.75) 20 1.45 (0.88-2.37) 50-69 118 11.28 (9.14-13.85) 747 69.10 (65.53-72.46) 191 16.70 (14.04-19.75) 34 2.92 (1.98-4.27) Employment, n (%) 0.0237 Unemployed 53 13.40 (9.64-18.32) 306 70.29 (64.59-75.43) 71 13.15 (9.87-17.30) 21 3.16 (1.85-5.36) Employed 53 11.45 (8.51-15.25) 409 73.46 (68.83-77.62) 85 14.50 (11.37-18.32) 5 0.59 (0.22-1.59) Self-employed 200 1172 (9.88-13.85) 1398 73.39 (70.67-75.93) 272 13.28 (11.52-15.27) 28 1.61 (1.02-2.54) Retired 6 3.43 (1.32-8.60) 114 71.85 (62.91-79.34) 33 21.10 (14.39-29.86) 5 3.62 (1.40-9.0) Education, n (%) 0.0067
Not having completed primary education
55 10.39 (7.11-14.95) 404 73.44 (68.25-78.05) 85 13.30 (10.24-17.11) 16 2.87 (1.39-5.81)
Having completed primary education
69 9.93 (7.32-13.32) 468 69.04 (64.52-73.22) 130 18.71 (15.45-22.49) 16 2.32 (1.34-3.99)
Having completed basic secondary education
98 14.04 (11.19-17.48) 639 75.29 (71.31-78.87) 96 9.32 (7.30-11.82) 13 1.35 (0.75-2.42)
Having completed secondary school
55 13.02 (9.48-17.63) 346 73.09 (67.26-78.22) 72 12.58 (9.18-16.99) 6 1.31 (0.38-4.46)
At least Graduated Uni/College / Specialized secondary education
36 9.39 (6.42-13.54) 365 73.56 (68.30-78.23) 78 16.33 (12.56-20.96) 8 0.72 (0.34-1.53)
School year, mean (95%CI) 0.354
8.88 (8.34-9.43) 8.69 (8.37-9.02) 8.78 (8.17-9.40) 7.45 (6.10-8.80) Marital status, n (%) <0.001 Unmarried 63 18.34 (13.68-24.15) 227 73.47 (66.85-79.18) 23 6.42 (3.56-11.31) 4 1.77 (0.56-5.50) Married 218 10.11 (8.66-11.78) 1765 72.84 (70.6-74.96) 385 15.36 (13.66-17.23) 51 1.69 (1.24-2.31) Separated/divorced/ widowed 29 10.34 (6.19-16.77) 23 73.78 (66.60-79.89) 50 14.72 (10.70-19.92) 3 1.16 (0.32-4.10) Living location, n (%) <0.001
17 Urban 112 9.42 (7.34-12.0) 971 69.6 (65.82-73.13) 256 18.79 (15.88-22.09) 35 2.20 (1.34-3.58) Rural 200 12.88 (109-15.15) 1256 74.69 (72.05-77.16) 205 11.02 (9.34-12.95) 24 1.42 (0.89-2.25) Economic quintile, n (%) <0.001 Lowest 100 14.99 (11.98-18.6) 494 74.95 (70.83-78.66) 62 8.51 (6.40-11.23) 11 1.55 (0.78-3.06) Lower 88 12.42 (9.69-15.79) 587 72.71 (68.38-76.65) 119 13.28 (10.60-16.50) 18 1.59 (0.92-2.72) Middle 49 14.69 (10.79-19.69) 347 70.07 (64.51-75.09) 76 12.36 (9.47-15.98) 9 2.88 (1.28-6.33) Higher 44 9.58 (6.47-13.97) 422 74.79 (69.73-79.26) 95 15.06 (11.76-19.10) 5 0.56 (0.20-1.54) Highest 31 6.56 (4.48-9.52) 377 71.21 (66.06-75.85) 109 20.02 (16.06-24.68) 16 2.21 (1.00,.4.81) Tobacco use, n (%) 0.655 Not at all 218 11.47 (9.77-13.43) 1,688 72.19 (69.69-74.56) 378 14.65 (12.96-16.52) 48 1.69 (1.15-2.45)
Less than daily
11 13.80 (6.12-28.24) 65 76.17 (62.90-85.76) 11 8.79 (4.53-16.39) 1 1.24 (0.18-7.83) Daily 82 11.60 (8.80-15.14) 470 74.94 (70.39-79.0) 72 11.66 (8.96-15.05) 10 1.80 (0.78-4.08)
Overweight and Obesity Patterns by Risk Behaviors and Intervention Factors
The full version of Table 3 can be found in Appendix A. Table 3 below shows
overweight and obesity patterns by risk behaviors and intervention factors. There are significant differences in overweight and obesity by the frequency of non-home-prepared meal per week, moderate-intensity activity at work and in leisure time, lifestyle advice received (“Eat more fruit and/or vegetables each day”, “Reduce fat in your diet”, “Start or do more physical activity”, and “Maintain a healthy body weight or lose weight”), experience of visiting health care facility in one month, measuring blood sugar or cholesterol, as well as the measured values of fasting blood glucose, total cholesterol, and waist circumference.(p <0.05). Overweight and obesity are lower among those doing physical activities at work, not visiting healthcare facilities, and no
18 experience of measuring blood sugar and cholesterol. Overweight is more likely to be higher among those receiving lifestyle advice such eating more fruit/vegetables, reducing fat in diet, doing more physical activity, and maintaining a healthy body weight.
Table 3
Overweight and Obesity Classified by Risk and Intervention Factors
Underweight n=312 Normal weight n=2227 Overweight n=416 Obesity n=59 P Unweighted observations Weighted Percentage / Mean (95%CI)
Eating Habit
Non-home prepared meals, mean (95%CI) 0.011
2.12 (1.59-2.66) 2.16 (1.95-2.36) 3.18 (2.69-3.67) 1.95 (0.98-2.92)
Physical activity
Moderate-intensity activity at work, n (%) 0.0043
Yes 156 12.16 (10.14-14.51) 1019 75.49 (72.56-78.19) 162 11.07 (9.19-13.27) 18 1.29 (0.78-2.13) No 155 11.11 (9.09-13.51) 1203 70.77 (67.84-73.55) 299 16.08 (13.92-18.49) 41 2.04 (1.35-3.07)
Moderate-intensity activity at leisure, n (%) <0.001
Yes 43 6.12 (4.25-8.74) 542 71.83 (67.30-75.95) 161 20.10 (16.57-24.16) 18 1.95 (1.12-3.38) No 268 13.05 (11.28-15.05) 1679 73.20 (70.80-75.48) 300 12.12 (10.52-13.93) 41 1.63 (1.08-2.46) Lifestyle Advice, n (%)
Eat more fruit and/or vegetables each day 0.005
Yes 97 9.34 (7.30-11.88) 809 72.03 (68.76-75.09) 205 16.95 (14.46-19.78) 23 1.67 (0104,.0268) No 214 12.81 (10.8-15.13) 1408 73.31 (70.58-75.87) 256 12.17 (10.53-14.02) 36 1.71 (1.08-2.70)
Reduce fat in your diet <0.001
Yes 54 7.73 (5.57-10.63) 519 68.15 (64.16-71.88) 175 21.94 (18.65-25.62) 23 2.19 (1.36-3.51) No 257 12.75 (10.93-14.82) 1698 74.25 (71.76-76.59) 286 11.45 (9.86-13.25) 36 1.56 (1.0-2.41)
Start or do more physical activity <0.001
Yes 49 7.50 (5.47-10.20) 517 70.33 (66.27-74.09) 150 19.98 (16.66-23.78) 21 2.19 (1.32-3.64) No 262 12.75 (10.95-14.80) 1700 73.57 (71.10-75.91) 311 12.11 (10.51-13.92) 38 1.56 (1.01-2.40)
19
Maintain a healthy body weight or lose weight <0.001
Yes 40 7.99 (5.67-11.16) 376 68.97 (64.22-73.36) 122 20.37 (16.51-24.87) 17 2.66 (1.45-4.85) No 271 12.36 (10.64-14.31) 1840 73.66 (71.23-75.95) 339 12.49 (10.87-14.30) 42 1.50 (1.03-2.20) NCD Management, n (%)
Visit health care facility in one month 0.0106
Yes 81 9.94 (7.66-12.82) 660 71.26 (67.38-74.85) 177 17.53 (14.60-20.91) 17 1.26 (0.75-2.12) No 230 12.24 (10.35-14.42) 1561 73.59 (70.82-76.18) 284 12.30 (10.58-14.25) 42 1.87 (1.25-2.80)
Experience of measuring blood sugar <0.001
Yes 93 9.57 (7.49-12.16) 750 70.35 (66.93-73.56) 209 17.35 (14.79-20.24) 30 2.73 (1.67-4.42) No 218 12.56 (10.67-14.74) 1472 74.16 (71.46-76.69) 252 12.08 (10.29-14.12) 29 1.20 (0.79-1.80)
Experience of measuring cholesterol <0.001
Yes 57 7.03 (5.15-9.51) 578 69.53 (65.94-72.90) 191 20.21 (17.30-23.48) 28 3.23 (1.91-05.39) No 254 13.10 (11.23-15.22) 1643 74.03 (71.44-76.47) 270 11.68 (10.02-13.57) 31 1.19 (0.81-1.76)
Measurement, mean (95%CI)
Fasting blood glucose [MMOL/L] <0.001
4.62 (4.44-4.79) 4.72 (4.64-4.81) 5.07 (4.90-5.24) 5.57 (4.74-6.39)
Total cholesterol [MMOL/L] <0.001
4.01 (3.86-4.15) 4.43 (4.35-4.51) 4.91 (4.75-5.06) 5.13 (4.62-5.64)
Waist circumference <0.001
73.74 (66.30-81.17) 75.98 (75.24-76.72) 87.78 (87.03-88.53) 110.57 (84.60-136.54)
Note: MMOL/L = millimoles per liter
Factors Associated with Overweight and Obesity
Bivariate Analysis of the Association between Overweight and Obesity and Different Factors
The results shown in Table 4 display the bivariate association between overweight and each of the different factors when the participants were categorized into two groups, overweight (BMI > =25) and non-overweight (BMI <25). The full version of Table 4 is listed in Appendix B. The significant association of overweight was observed for these variables: age category, education, marital status, living location, economic quintiles, tobacco use, eating habit, physical activity,
20 lifestyle advice, NCD management and key measurements (cholesterol, glucose, and waist circumference). The overweight status was lower among younger age groups, better educated, unmarried, rural residents, lower economic quintiles, physical activity participants, smokers and those with more opportunities of having meals not at home, higher mean waist circumference. However, it was higher among non-users of lard or suet, out-of-home eating, doers of physical activity at leisure, receiving lifestyle advice and NCD management.
Table 4
Bivariate Analysis of Selected Factors Associated with Overweight (Selected)
Non overweight (BMI<25) n=3297 Overweight (BMI>=25) n=461 p Unweighted observations Weighted percentage/mean (95%CI)
Age category, n (%) <0.001 18-29 650 94.19 (91.72-95.96) 41 5.81 (4.04-8.28) 30-49 1591 86.93 (85.01-88.64) 229 13.07 (11.36-14.99) 50-69 1056 85.20 (82.58-87.64) 191 14.71 (12.36-17.42) Education, n (%) <0.001
Not having completed primary education
557
88.46 (85.10-91.14)
85
11.54 (8.86-14.89)
Having completed primary education
673
84.26 (81.06-87.0)
130
15.74 (13.0-18.94)
Having completed basic secondary education
904
92.52 (90.53-94.13)
96
7.48 (5.87-9.47)
Having completed secondary school
555
90.74 (87.46-93.24)
72
9.26 (6.76-12.54)
At least Graduated Uni/College/Specialized secondary education
596 88.71 (85.29-91.41) 78 11.29 (8.59-14.71) Marital status, n (%) <0.001 Unmarried 419 23
21 95.59 (92.20-97.54) 4.41 (2.46-7.80) Married 2552 87.57 (86.02-88.97) 385 12.43 (11.03-13.98) Separated/divorced/widowed 311 87.83 (83.50-91.15) 50 12.17 (8.85-16.50) Living location, n (%) 0.0059 Urban 1578 87.0 (84.60-89.08) 256 13.0 (10.92-15.40) Rural 1719 90.69 (89.06-92.10) 205 9.31 (7.90-10.94) Economic quintile, n (%) 0.0096 Lowest 704 92.81 (90.39-94.65) 62 7.19 (5.35-9.61) Lower 825 88.85 (86.16-91.07) 119 11.15 (8.93-13.84) Middle 504 90.36 (87.53-92.60) 76 9.64 (7.40-12.47) Higher 609 88.29 (85.08-90.88) 95 11.71 (9.12-14.92) Highest 655 86.46 (83.23-89.15) 109 13.54 (10.85-16.77) Tobacco use, n (%) 0.0373 Not at all 2461 88.41 (86.91-89.76) 378 11.59 (10.24-13.09)
Less than daily 110
94.05 (88.78-96.94) 11 5.95 (3.06-11.22) Daily 715 90.81 (88.11-92.95) 72 9.19 (7.05-11.89) Eating Habit
Use lard or suet, n (%) <0.001
Yes 504 94.02 (91.46-95.84) 35 5.98 (4.16-8.54) No 2793 88.42 (86.90-89.79) 426 11.58 (10.21-13.10)
Not home prepared meals, mean (95%CI) 0.010
2.52 (2.32-2.71) 3.18 (2.69-3.67)
Physical activity
Moderate-intensity activity at work, n (%) 0.0232
Yes 1426 90.77 (88.87-92.37) 162 9.23 (7.63-11.13) No 1862 87.99 (86.17-89.61) 299 12.01 (10.39-13.83)
Moderate-intensity activity at leisure, n (%) <0.001
22 84.41 (81.07-87.26) 15.59 (12.74-18.93) No 2510 90.47 (89.03-91.74) 300 9.53 (8.26-10.97) Lifestyle Advice, n (%)
Eat more fruit and/or vegetables each day 0.0016
Yes 1201 86.93 (84.72-88.87) 205 13.07 (11.13-15.28) No 2080 90.36 (88.86-91.68) 256 9.64 (8.32-11.14)
Reduce fat in your diet <0.001
Yes 780 82.83 (79.89-85.42) 175 17.17 (14.58-20.11) No 2502 91.02 (89.57-92.28) 286 8.98 (7.72-10.43])
Start or do more physical activity <0.001
Yes 780 84.82 (81.84-87.39) 150 15.18 (12.61-18.16) No 2502 90.41 (88.95-91.70) 311 9.59 (8.30-11.05)
Maintain a healthy body weight or lose weight <0.001
Yes 587 84.45 (80.99-87.38) 122 15.55 (12.62-19.01) No 2694 90.15 (88.70-91.43) 339 9.85 (8.57-11.30) NCD management, n (%)
Visit health care facility in 1 month 0.0022
Yes 955 86.14 (83.45-88.45) 177 13.86 (11.55-16.55) No 2329 90.37 (88.80-91.73) 284 9.63 (8.27-11.20)
Experience of measuring blood sugar 0.0043
Yes 1165 86.78 (84.54-88.74) 209 13.22 (11.26-15.46) No 2123 90.39 (88.73-91.83) 252 9.61 (8.17-11.27)
Experience of measuring cholesterol <0.001
Yes 901 84.83 (82.30-87.06) 191 15.17 (12.94-17.70) No 2386 90.70 (89.19-92.03) 270 9.30 (7.97-10.81)
Measurement, mean (95%CI)
Fasting blood glucose [MMOL/L] <0.001
4.71 (4.63-4.80) 5.07 (4.90-5.24)
23
Waist circumference 76.36 (74.99-77.72) 87.78 (87.03-88.53) <0.001 Note: MMOL/L = millimoles per liter
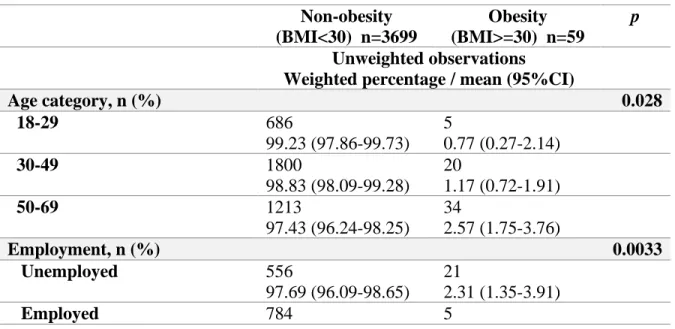
Table 5 presents the bivariate analysis of factors associated with Obesity when the
participants are categorized into two groups: obesity (BMI >30) and non-obesity (BMI <30). The full version of table 5 is in Appendix C. Some socio-economic factors, such as age category, and employment status had significant differences by obesity status. However, we could not find the significant association with thee other factors: gender, marital status, living location, economic quintile and tobacco use. Regarding NCD management factors, the experience of measuring blood sugar and the experience of measuring cholesterol factors were demonstrated as significant differences between the obesity and non-obesity groups (p <0.05). The result shows that obesity was less among younger age groups, and higher among those who were unemployed, retired, had higher mean blood cholesterol and waist circumference, although, it was higher among those having the experience of measured blood sugar and cholesterol.
Table 5
Bivariate Analysis of Factors Associated with Obesity
Non-obesity (BMI<30) n=3699 Obesity (BMI>=30) n=59 p Unweighted observations Weighted percentage / mean (95%CI)
Age category, n (%) 0.028 18-29 686 99.23 (97.86-99.73) 5 0.77 (0.27-2.14) 30-49 1800 98.83 (98.09-99.28) 20 1.17 (0.72-1.91) 50-69 1213 97.43 (96.24-98.25) 34 2.57 (1.75-3.76) Employment, n (%) 0.0033 Unemployed 556 97.69 (96.09-98.65) 21 2.31 (1.35-3.91) Employed 784 5
24 99.61 (98.93-99.86) 0.39 (0.14-1.07) Self-employed 2180 98.64 (97.86-99.14) 28 1.36 (0.86-2.14) Retired 179 96.85 (92.16-98.77) 5 3.15 (1.23-78.4]) NCD Management, n (%)
Experience of measuring blood sugar 0.0078
Yes 1344 97.92 (96.65-98.72) 30 2.08 (1.28-3.35) No 2346 99.05 (98.57-99.37) 29 0.95 (0.63-1.43)
Experience of measuring cholesterol 0.0018
Yes 1064 97.58 (95.96-98.56) 28 2.42 (1.44-4.04) No 2625 99.05 (98.60-99.36) 31 0.95 (0.64-1.40)
Measurement, mean (95%CI)
Total cholesterol [MMOL/L] 4.47 (4.40-4.54) 5.129 (4.62-5.64) 0.010 Waist circumference 77.38 (76.29-78.47) 110.57 (84.60-136.54) 0.012
Note: MMOL/L = millimoles per liter
Multiple Logistic Regression Model of Factors Associated with Overweight and Obesity The results of multivariable logistic regression models for factors associated with
overweight are presented in Table 6. Age categories, education, marital status, the number of not home prepared meal per week, and receiving the advice about reducing fat in your diet have a significant association with overweight. Adjusted for other covariates, odds of overweight increases 7% (AOR: 1.07, 95%CI: [1.02 -1.11]) for respondents who reported more not prepared home meals per week. Confounders associated with overweight included age groups, education status and marital status, with the odds of overweight being higher among higher age groups, low-education and married respondents.
Table 6
Multiple Logistic Regression Model of Factors Associated with Overweight
25 AOR 95%CI Gender, n (%) 1.12 0.80-1.55 0.514 age category, n (%) 18-29 ref 30-49 1.67 1.05-2.67 0.032 50-69 1.81 1.09-3.01 0.022 Education, n (%)
Not having completed primary education ref
Having completed primary education 1.23 0.82-1.84 0.319
Having completed basic secondary education 0.52 0.33-0.82 0.005 Having completed secondary school 0.69 0.42-1.14 0.147
At least Graduated Uni/College /Specialized secondary education
0.63 0.38-1.04 0.069 Marital status, n (%) Unmarried ref Married 2.19 1.12-4.27 0.022 Separated/divorced/widowed 1.79 0.78-4.13 0.168 Living location, n (%) Urban ref Rural 0.85 0.62-1.15 0.279 Economic quintile, n (%) Lowest ref Lower 1.49 0.95-2.35 0.085 Middle 1.23 0.76-2.01 0.398 Higher 1.43 0.87-2.37 0.158 Highest 1.49 0.87-2.58 0.147 Tobacco use, n (%)
Not at all ref
Less than daily 0.57 0.27-1.19 0.131
Daily 0.77 0.50-1.18 0.229
Eating Habit
Fruit consumption (amount), mean (95%CI) 0.95 0.89-1.02 0.168
Not home prepared meal, mean (95%CI) 1.07 1.03-1.11 0.001
Use lard or suet, n (%) 0.67 0.41-1.11 0.123
Physical Activity
Vigorous-intensity activity at work, n (%) 1.15 0.80-1.63 0.449
Moderate-intensity activity at work, n (%) 0.89 0.65-1.21 0.466
Moderate-intensity activity at leisure, n (%) 1.33 0.95-1.86 0.101
Work outside, n (%) 0.93 0.69-1.25 0.619
Lifestyle Advice, n (%)
Eat more fruit and/or vegetables each day 0.75 0.50-1.15 0.185
Reduce fat in your diet 1.93 1.24-3.01 0.004
26
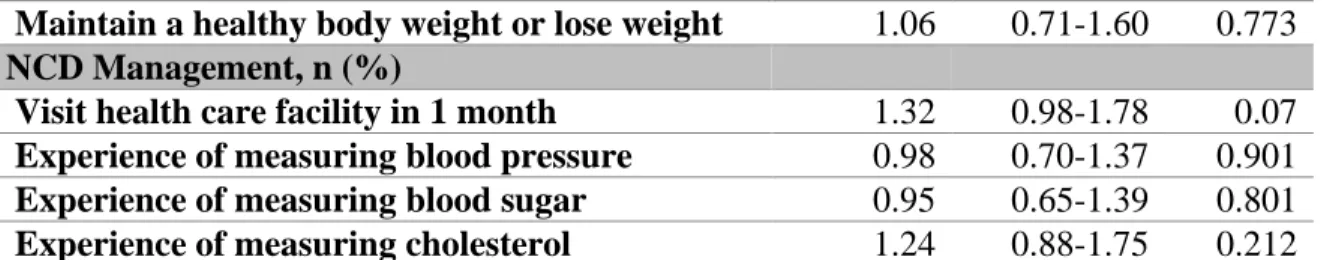
Maintain a healthy body weight or lose weight 1.06 0.71-1.60 0.773
NCD Management, n (%)
Visit health care facility in 1 month 1.32 0.98-1.78 0.07
Experience of measuring blood pressure 0.98 0.70-1.37 0.901
Experience of measuring blood sugar 0.95 0.65-1.39 0.801
Experience of measuring cholesterol 1.24 0.88-1.75 0.212 Note: AOR = Adjusted odds ratio; 95%CI = 95% confidence interval
Table 7 provides the results of the multiple logistic regression model of factors associated with obesity. Variables associated with obesity were eating habit, lifestyle advice and NCD management. Adjusting for other covariates, odds of obesity decreased 18% for more vegetable consumers (AOR: 0.82, 95%CI: [0.68 - 0.98]), but was 2.55 times higher among those
experienced with measured cholesterol (AOR: 2.55, 95%CI: [1.16 - 5.58]). Odds of obesity among respondents with at least graduate university/college/specialized secondary education decreased 81% compared to those without completed primary education (AOR: 0.19, 95%CI: [0.04 - 0.92]).
Table 7
Multiple Logistic Regression Model of Factors Associated with Obesity
Weighted AOR Weighted 95%CI p Age category, n (%) 18-29 ref 30-49 1.31 0.38-4.55 0.672 50-69 1.97 0.54-7.19 0.305 Employment, n (%) Unemployed ref Employed 0.22 0.04-1.27 0.09 Self-employed 0.47 0.19-1.17 0.103 Retired 0.94 0.21-4.11 0.934 Education, n (%)
Not having completed primary education ref
27
Having completed basic secondary education 0.40 0.13-1.17 0.094
Having completed secondary school 0.36 0.07-1.83 0.219
At least Graduated Uni/College/Specialized secondary education
0.19 0.04-0.92 0.039
School year, mean (95%CI) 1.04 0.99-1.08 0.141
Eating Habit
Vegetable consumption (day), mean (95%CI) 0.82 0.68-0.98 0.026 Fruit consumption (day), mean (95%CI) 0.90 0.79-1.01 0.082
Use lard or suet, n (%) 0.45 0.15-1.38 0.161
Adding salt, n (%)
Never ref
Rarely 0.68 0.12-3.72 0.656
Sometimes 0.36 0.09-4.09 0.14
Often (most meals) 0.24 0.05-1.06 0.059
Always (every meal) 0.56 0.12-2.54 0.451
Visit restaurant in 1 month, n (%) 0.87 0.41-1.87 0.723
Physical Activity
Work outside, n (%) 1.78 0.69-4.58 0.231
Lifestyle Advice, n (%)
Quit using tobacco or don’t start 0.40 0.16-1.02 0.055
Maintain a healthy body weight or lose weight 1.90 0.88-4.09 0.101
NCD Management, n (%)
Experience of measuring blood sugar 1.63 0.93-2.86 0.086
Experience of measuring cholesterol 2.55 1.16-5.58 0.019
Note: AOR = Adjusted odds ratio; 95%CI = 95% confidence interval
Discussion
The burden of NCD has become globally worrisome, especially in developing countries. While developing NCDs are multi-faceted, overweight and obesity are among the top
contributors. Lack of updated information about the country-level overweight and obesity continues to challenge proper public health policy and practices. Using recent STEP wise survey in Vietnam, our study aims to provide a more in-depth analysis of the pattern of overweight and obesity and factors associated with each among Vietnamese adults.
28
Patterns of overweight and obesity
Our study (Table 1) indicates that the prevalence of overweight and obesity is 13.75% and 1.69%, respectively. This result is quite consistent with another report in which Ng et al. (2014) reported the overweight and obesity prevalence in each country and the overweight and obesity prevalence for Vietnamese men and women in 2013 was 13.6%, 12.3% respectively and the prevalence of obesity alone was 1.5%, 1.7% respectively (Ng et al., 2014). Additionally, in this same article, we noted that our findings were lower compared to in other such countries. For instance, in Thailand, the overweight and obesity prevalence for men and women was 32.1%, 39.7% and obese alone was 6.5%, 11.2% respectively. In Nigeria, Chukwuonye, Chuku, Onyeonono, & Ukegbu (2015) ) also reported that the prevalence range of overweight was 20.3% – 35.1% and the prevalence range of obesity was 8.1% – 22.2% among Nigerian men and women respectively in 2001-2012. Based on those research results, the lower prevalence of overweight and obesity among Vietnamese adults shows some positive signs. However, when we compared with prior Vietnamese STEPS survey in 2005, our study result is still higher ( Pham et al., 2009). This result suggests no improvement, and even an increase in both overweight and obesity since 2005. If there are no adequate strategies to reduce overweight and obesity then the numbers are expected to rise significantly over the next years. Our study findings give a warning sign, an urgent concern for the country to take priority action.
A further analyses shown in Tables 2 and 3 demonstrate that overweight and obesity patterns differ by key socio-demographic characteristics, risk behaviors and intervention factors. To be specific, there were significant differences in overweight and obesity between age
categories, employment status, education status, marital status, living locations and economic quintile groups. Among those factors, we highlight economic quintile factor, adults in higher
29 economic quintiles had a higher prevalence of overweight and obesity. It is quite consistent with previous studies because Vietnam is a lower-middle-income country (Dinsa et al., 2012;
Monteiro et al., 2004; Newton et al., 2017). Furthermore, Significant differences in overweight and obesity were observed by the frequency of non-home-prepared meal per week, moderate-intensity activity at work and in leisure time, lifestyle advice received. These factors are considered important contributors of overweight and obesity (Kim et al., 2017; Mytton et al., 2014; Sargent et al., 2012). More insight discussions of these factors will be next.
Factors Associated with Overweight
Our study revealed age categories, education, marital status, the number of not home prepared meal per week, and receiving the advice about reducing fat in your diet as significant associations with overweight. Among those factors, a special attention should be given to how respondents have prepared meals. To be specific, adjusted for other covariates, odds of
overweight increases 7% for respondents who reported more occasions of meals per week that were not prepared home. This result is quite consistent with previous studies showing that eating out and/or not eating home prepared meals or having fast food was associated with higher likelihood of overweight ( Popkin et al., 2012; Popkin & Reardon, 2018; Rosenheck, 2008; Rudolph et al., 2007) . This is understandable given that many of the foods and meals outside home contexts were not fresh or they were unhealthy or both (Bahadoran et al., 2016). This result suggests that there is a public health program targeting this issue to address overweight. Although in Vietnam there have been some strategies for NCD prevention and control, they are not tailored made or specific enough for different groups (Duyen et al., 2020). As can be seen from our study the multiple models gave a further insight of what covariates contribute to the issue. We found that confounders associated with overweight included age groups, education
30 status and marital status, with the odds of overweight being higher among higher age groups, low-education and married respondents. Therefore, for immediate purposes such a public health program should focus on people who are higher age, lower educated and married as the findings suggest. However, for a long run strategy, the program needs to attend to people who are
younger because earlier interventions are better and because once lifestyle and behaviors of younger people have been established, it would be difficult to change them. Based on the current context of Vietnam, although Vietnam has been known as a lower-middle-income country, the resources for universal health coverage and public health programming remain limited (Castillo-Carandang et al., 2020). Accordingly, our suggestion would be feasible, as the country also needs to address other social issues.
Factors Associated with Obesity
The result of multiple analysis showed that factors explained obesity, comprised eating habit, lifestyle advice, and NCD management. Adjusting for other covariates, odds of obesity decreases 18% for more vegetable consumers, but was 2.55 times higher among those
experienced with cholesterol measurements. Our finding indicating the obesity association with vegetable consumptions is consistent with prior studies or interventions reporting the increase of vegetables leading to reduced body weight and/or metabolic syndrome (Dreher & Ford, 2020; Kaiser et al., 2014; Nour et al., 2018; Tapsell et al., 2014) as universally vegetables provide many benefits for promoting the function of a healthy body (Slavin & Lloyd, 2012; WHO |
Healthy Diet, n.d.). Given this benefit, WHO advocates a diet low in saturated fats, sugar and
sodium as well as consuming over 400 grams (or 3 cups) of fruits and vegetables per day for NCD management and to improve overall health and reduce the risk of certain NCDs.
31 From our results showing obesity being higher among those experienced with measured cholesterol (AOR: 2.55, 95%CI: [1.16 -5.58]), we can assume that those people who deemed as obese are more likely to visit healthcare service for testing biomarkers, and once they have been checked, their cholesterol is more likely to be higher. Another reason can be when they visit the healthcare service they most likely receive health workers’ advice for specialty and biomarker check-ups. If that is true, then, it seems that healthcare services in Vietnam probably include at least some aspect of a NCD management component somewhere in the health system
(Takashima et al., 2017). Our multiple logistic regression model also reveals education
background of respondents as a significant contributor. Particularly, participants who are better educated are less likely to be obese. This finding suggests that education plays a driving role in reducing obesity. The study finding again highlights the importance of education in defining many health problems, not just obesity. However, we argue that it’s a quite challenge to increase formal education as it’s costly (UNESCO Digital Library, n.d.). Therefore, to tackle a health problem as obesity, it’s feasible to integrate health education into public health policy and practice. Actually, there have been some policies for NCDs in Vietnam. However, as a previous study pointed out, some difficulties with those policies remained (Tuan T Nguyen & Minh V Hoang, 2018). To be specific from our results, promotion of healthy eating is clearly focused on in the current NCD related policy, as we could reduce obesity by changing diets such as
increasing vegetable consumption. (What’s in Your NCD Policy Analysing the Strength of
Diet-Related NCD, 2019)
Limitations
This study has some limitations. As a secondary data analysis based on complex survey data, some missing values are inevitable. As a cross-sectional design of the STEPwise survey,
32 the temporal relationship between different factors and outcomes (overweight and obesity) may not be confirmed. Also, recall bias may occur due to the nature of self-reported items, especially items measuring risk behaviors and NCD management variables. Although it was considered as a large-sample survey, the sample size of obesity among some groups was still small, affecting the modeling for obesity. For example, marital status and economic quintile factors were not
included in the multivariable logistic model because they did not meet the criteria for the variable selection. The issue associated with this small sample size was a skewed obesity variable. Given this issue, we had to perform a skewed multivariable logistic regression model using “Scobit” statistical programming. Unfortunately, this model was not converged; therefore, we used a standard logistic regression model.
Even though these limitations provide a caveat, this study provides some crucial insights. The results could provide a quite strong case for public health policy and practice as discussed above. Further studies such as food intake of home prepared meal and out-of- home meal, employment status and physical activity in developing countries and efficacy of NCD prevent intervention are expected.
On a positive note, this study is a population-based survey with a multi-stage complex sampling process applied. Hence, our study sample group can represent the population in Vietnam. Furthermore, since a specialist group designed this study with support from WHO based in Vietnam, the data collection has been deem valid for measuring key variables and outcomes. The study not just gives further perspectives of overweight and obesity and their associations in Vietnam, but also some recommendations for NCD control and prevention.
33
Conclusions
Given that overweight and obesity are prevalent in Vietnam, prevention is an important factor for addressing the prevalence of NCDs. To reduce these issues, a public health policy and practice that considers both term and long-term strategies can be anticipated. For short-term, a risk-factor approach should be pursued to break down risk behaviors among different groups of people, such as those at older age and with lower education. For long-term, a strategy working with younger groups and how to manage and integrate NCD component into the
existing health system, especially in the lower level of the system could add benefits to reducing overweight and obesity (Thuy Duyen et al., 2020). Further studies taking a longitudinal and/or intervention design into account are recommended to provide more evidence and to support further directions of overweight and obesity prevention and control for the future in Vietnam. As Vietnam socioeconomically resembles most of the other developing countries in the Southeast Asian region, this study could also provide a case study for consideration in similar settings.
34
References
Abarca-Gómez, L., Abdeen, Z. A., Hamid, Z. A., Abu-Rmeileh, N. M., Acosta-Cazares, B., Acuin, C., Adams, R. J., Aekplakorn, W., Afsana, K., Aguilar-Salinas, C. A., Agyemang, C., Ahmadvand, A., Ahrens, W., Ajlouni, K., Akhtaeva, N., Al-Hazzaa, H. M., Al-Othman, A. R., Al-Raddadi, R., Al Buhairan, F., … Ezzati, M. (2017). Worldwide trends in body-mass index, underweight, overweight, and obesity from 1975 to 2016: A pooled analysis of 2416 population-based measurement studies in 128·9 million children, adolescents, and adults. The Lancet,
390(10113), 2627–2642. https://doi.org/10.1016/S0140-6736(17)32129-3
Bahadoran, Z., Mirmiran, P., & Azizi, F. (2016). Fast Food Pattern and Cardiometabolic Disorders: A Review of Current Studies. Health Promotion Perspectives, 5(4), 231–240. https://doi.org/10.15171/hpp.2015.028
Bennett, J. E., Kontis, V., Mathers, C. D., Guillot, M., Rehm, J., Chalkidou, K., Kengne, A. P., Carrillo-Larco, R. M., Bawah, A. A., Dain, K., Varghese, C., Riley, L. M., Bonita, R., Kruk, M. E., Beaglehole, R., & Ezzati, M. (2020). NCD Countdown 2030: Pathways to achieving
Sustainable Development Goal target 3.4. The Lancet, 396(10255), 918–934. https://doi.org/10.1016/S0140-6736(20)31761-X
Bhurosy, T., & Jeewon, R. (2014). Overweight and Obesity Epidemic in Developing Countries: A Problem with Diet, Physical Activity, or Socioeconomic Status? The Scientific World Journal,
2014, 1–7. https://doi.org/10.1155/2014/964236
Binh, T. Q., Phuong, P. T., Nhung, B. T., & Tung, D. D. (2014). Metabolic syndrome among a middle-aged population in the Red River Delta region of Vietnam. BMC Endocrine Disorders,
14(1), 77. https://doi.org/10.1186/1472-6823-14-77
Bui, T. V., Blizzard, C. L., Luong, K. N., Truong, N. L. V., Tran, B. Q., Otahal, P., Gall, S., Nelson, M. R., Au, T. B., Ha, S. T., Phung, H. N., Tran, M. H., Callisaya, M., & Srikanth, V. (2016). National survey of risk factors for non-communicable disease in Vietnam: Prevalence estimates and an assessment of their validity. BMC Public Health, 16(1), 498.
https://doi.org/10.1186/s12889-016-3160-4
Castillo-Carandang, N. T., Buenaventura, R., Chia, Y.-C., Do Van, D., Lee, C., Duong, N. L., Ng, C. H., Robles, Y. R., Santoso, A., Sigua, H., Sukonthasarn, A., Tan, R., Viora, E., Zakaria, H., Brizuela, G. E., Ratnasingham, P., Thomas, M., & Majumdar, A. (2020). Moving Towards Optimized Noncommunicable Disease Management in the ASEAN Region: Recommendations from a Review and Multidisciplinary Expert Panel. Risk Management and Healthcare Policy,
Volume 13, 803–819. https://doi.org/10.2147/RMHP.S256165
Choi, B., Schnall, P., Dobson, M., Yang, H., Baker, D., & Seo, Y. (2017). A socioecological framework for research on work and obesity in diverse urban transit operators based on gender, race, and ethnicity. Annals of Occupational and Environmental Medicine, 29(1), 15.
35 Cuevas García-Dorado, S., Cornselsen, L., Smith, R., & Walls, H. (2019). Economic
globalization, nutrition and health: A review of quantitative evidence. Globalization and Health,
15(1), 15. https://doi.org/10.1186/s12992-019-0456-z
Cuong, T. Q., Dibley, M. J., Bowe, S., Hanh, T. T. M., & Loan, T. T. H. (2007). Obesity in adults: An emerging problem in urban areas of Ho Chi Minh City, Vietnam. European Journal
of Clinical Nutrition, 61(5), 673–681. https://doi.org/10.1038/sj.ejcn.1602563
Di Angelantonio, E., Bhupathiraju, S. N., Wormser, D., Gao, P., Kaptoge, S., de Gonzalez, A. B., Cairns, B. J., Huxley, R., Jackson, C. L., Joshy, G., Lewington, S., Manson, J. E., Murphy, N., Patel, A. V., Samet, J. M., Woodward, M., Zheng, W., Zhou, M., Bansal, N., … Hu, F. B. (2016). Body-mass index and all-cause mortality: Individual-participant-data meta-analysis of 239
prospective studies in four continents. The Lancet, 388(10046), 776–786. https://doi.org/10.1016/S0140-6736(16)30175-1
Do, L. M., Tran, T. K., Eriksson, B., Petzold, M., & Ascher, H. (2017). Prevalence and incidence of overweight and obesity among Vietnamese preschool children: A longitudinal cohort study.
BMC Pediatrics, 17(1), 150. https://doi.org/10.1186/s12887-017-0904-y
Dreher, M. L., & Ford, N. A. (2020). A Comprehensive Critical Assessment of Increased Fruit and Vegetable Intake on Weight Loss in Women. Nutrients, 12(7).
https://doi.org/10.3390/nu12071919
G. D. Dinsa, Y. Goryakin, E. Fumagalli, & M. Suhrcke. (2012). Obesity and socioeconomic status in developing countries: A systematic review. Obesity Reviews, 13.
Global status report on noncommunicable diseases 2010.
Hoang Thi Duc Ngan, Le Danh Tuyen, Pham Van Phu, & Smita Nambiar. (2018). Childhood overweight and obesity amongst primary school children in Hai Phong City, Vietnam. Asia
Pacific Journal of Clinical Nutrition, 27(2). https://doi.org/10.6133/apjcn.062017.08
Hoang, V. M., Tran, Q. B., Vu, T. H. L., Nguyen, T. K. N., Kim, B. G., Pham, Q. N., Nguyen, T. L., Lai, D. T., Nakagawa, J., Shin, H.-R., Kim, W. J., Riley, L., Wadhwani, C., Truong, D. B., & Tran, D. P. (2019). Patterns of Raised Blood Pressure in Vietnam: Findings from the WHO STEPS Survey 2015. International Journal of Hypertension, 2019, 1–7.
https://doi.org/10.1155/2019/1219783
Kaiser, K. A., Brown, A. W., Bohan Brown, M. M., Shikany, J. M., Mattes, R. D., & Allison, D. B. (2014). Increased fruit and vegetable intake has no discernible effect on weight loss: A systematic review and meta-analysis1234. The American Journal of Clinical Nutrition, 100(2), 567–576. https://doi.org/10.3945/ajcn.114.090548
Kim, B.-Y., Choi, D.-H., Jung, C.-H., Kang, S.-K., Mok, J.-O., & Kim, C.-H. (2017). Obesity and Physical Activity. Journal of Obesity & Metabolic Syndrome, 26(1), 15–22.
36 Minh, H. V., Byass, P., Huong, D. L., Chuc, N. T. K., & Wall, S. (2007). Risk Factors for
Chronic Disease Among Rural Vietnamese Adults and the Association of These Factors With Sociodemographic Variables: Findings From the WHO STEPS Survey in Rural Vietnam, 2005. 4(2), 10.
Monteiro, C. A., Moura, E. C., Conde, W. L., & Popkin, B. M. (2004). Socioeconomic status and obesity in adult populations of developing countries: A review. Bulletin of the World Health
Organization, 82(12), 940–946.
Mytton, O. T., Nnoaham, K., Eyles, H., Scarborough, P., & Mhurchu, C. N. (2014). Systematic
review and meta-analysis of the effect of increased vegetable and fruit consumption on body weight and energy intake. 11.
National Survey on The Risk Factors of Non-communicable Diseases (STEPS) Viet Nam, 2015 (p.
130). (n.d.). Ministry of Health General Department of Preventive Medicine.
NCD Risk Factor Collaboration. (2016). Trends in adult body-mass index in 200 countries from 1975 to 2014: A pooled analysis of 1698 population-based measurement studies with 19·2 million participants. The Lancet, 387(10026), 1377–1396. https://doi.org/10.1016/S0140-6736(16)30054-X
Newton, S., Braithwaite, D., & Akinyemiju, T. F. (2017). Socio-economic status over the life course and obesity: Systematic review and meta-analysis. PLOS ONE, 12(5), e0177151. https://doi.org/10.1371/journal.pone.0177151
Ng, M., Fleming, T., Robinson, M., Thomson, B., Graetz, N., Margono, C., Mullany, E. C., Biryukov, S., Abbafati, C., Abera, S. F., Abraham, J. P., Abu-Rmeileh, N. M. E., Achoki, T., AlBuhairan, F. S., Alemu, Z. A., Alfonso, R., Ali, M. K., Ali, R., Guzman, N. A., … Gakidou, E. (2014). Global, regional, and national prevalence of overweight and obesity in children and adults during 1980–2013: A systematic analysis for the Global Burden of Disease Study 2013.
The Lancet, 384(9945), 766–781. https://doi.org/10.1016/S0140-6736(14)60460-8
Nguyen, Q. N., Pham, S. T., Nguyen, V. L., Weinehall, L., Bonita, R., Byass, P., & Wall, S. (2012). Time Trends in Blood Pressure, Body Mass Index and Smoking in the Vietnamese Population: A Meta-Analysis from Multiple Cross-Sectional Surveys. PLoS ONE, 7(8), e42825. https://doi.org/10.1371/journal.pone.0042825
Nguyen, T. T., & Trevisan, M. (2020). Vietnam a country in transition: Health challenges. BMJ
Nutrition, Prevention & Health, 3(1), 60–66. https://doi.org/10.1136/bmjnph-2020-000069
Nour, M., Lutze, S. A., Grech, A., & Allman-Farinelli, M. (2018). The Relationship between Vegetable Intake and Weight Outcomes: A Systematic Review of Cohort Studies. Nutrients,
10(11). https://doi.org/10.3390/nu10111626
Obesity. (n.d.). Retrieved January 9, 2021, from
37
Obesity and overweight. (n.d.). Retrieved January 4, 2021, from
https://www.who.int/news-room/fact-sheets/detail/obesity-and-overweight
Pham, L. H., Au, T. B., Blizzard, L., Truong, N. B., Schmidt, M. D., Granger, R. H., & Dwyer, T. (2009). Prevalence of risk factors for non-communicable diseases in the Mekong Delta, Vietnam: Results from a STEPS survey. BMC Public Health, 9(1), 291. https://doi.org/10.1186/1471-2458-9-291
Pham, T. T. P., Matsushita, Y., Dinh, L. T. K., Do, T. V., Nguyen, T. T. T., Bui, A. T., Nguyen, A. Q., & Kajio, H. (2019). Prevalence and associated factors of overweight and obesity among schoolchildren in Hanoi, Vietnam. BMC Public Health, 19(1), 1478.
https://doi.org/10.1186/s12889-019-7823-9
Popkin, B. M., & Reardon, T. (2018). Obesity and the food system transformation in Latin America. Obesity Reviews, 19(8), 1028–1064. https://doi.org/10.1111/obr.12694
Popkin, Barry M., Adair, L. S., & Ng, S. W. (2012). NOW AND THEN: The Global Nutrition Transition: The Pandemic of Obesity in Developing Countries. Nutrition Reviews, 70(1), 3–21. https://doi.org/10.1111/j.1753-4887.2011.00456.x
Pricing the right to education: The cost of reaching new targets by 2030—UNESCO Digital Library. (n.d.). Retrieved January 15, 2021, from
https://unesdoc.unesco.org/ark:/48223/pf0000232197
Rosenheck, R. (2008). Fast food consumption and increased caloric intake: A systematic review of a trajectory towards weight gain and obesity risk. Obesity Reviews, 9(6), 535–547.
https://doi.org/10.1111/j.1467-789X.2008.00477.x
Rudolph, T. K., Ruempler, K., Schwedhelm, E., Tan-Andresen, J., Riederer, U., Böger, R. H., & Maas, R. (2007). Acute effects of various fast-food meals on vascular function and
cardiovascular disease risk markers: The Hamburg Burger Trial. The American Journal of
Clinical Nutrition, 86(2), 334–340. https://doi.org/10.1093/ajcn/86.2.334
Sargent, G. M., Forrest, L. E., & Parker, R. M. (2012). Nurse delivered lifestyle interventions in primary health care to treat chronic disease risk factors associated with obesity: A systematic review. Obesity Reviews, 13(12), 1148–1171. https://doi.org/10.1111/j.1467-789X.2012.01029.x Sartorius, B., Veerman, L. J., Manyema, M., Chola, L., & Hofman, K. (2015). Determinants of Obesity and Associated Population Attributability, South Africa: Empirical Evidence from a National Panel Survey, 2008-2012. PLOS ONE, 10(6), e0130218.
https://doi.org/10.1371/journal.pone.0130218
Slavin, J. L., & Lloyd, B. (2012). Health Benefits of Fruits and Vegetables1. Advances in
38 Takashima, K., Wada, K., Tra, T. T., & Smith, D. R. (2017). A review of Vietnam’s healthcare reform through the Direction of Healthcare Activities (DOHA). Environmental Health and
Preventive Medicine, 22(1), 74. https://doi.org/10.1186/s12199-017-0682-z
Tapsell, L. C., Batterham, M. J., Thorne, R. L., O’Shea, J. E., Grafenauer, S. J., & Probst, Y. C. (2014). Weight loss effects from vegetable intake: A 12-month randomised controlled trial.
European Journal of Clinical Nutrition, 68(7), 778–785. https://doi.org/10.1038/ejcn.2014.39
Thuy Duyen, N., Van Minh, H., Van Huy, N., Bao Giang, K., Thu Ngan, T., Xuan Long, N., Kim Khanh Ly, D., Thu Trang, V., & Dung, V. (2020). Patterns of behavioral risk factors for non-communicable diseases in Vietnam: A narrative scoping review. Health Psychology Open,
7(2), 205510292096724. https://doi.org/10.1177/2055102920967248
Tuan T Nguyen & Minh V Hoang. (2018). Non-communicable diseases, food and nutrition in Vietnam from 1975 to 2015: The burden and national response. Asia Pacific Journal of Clinical
Nutrition, 27(1). https://doi.org/10.6133/apjcn.032017.13
What’s in your NCD policy analysing the strength of diet-related NCD (p. 12). (2019). Center for
Population Health Sciences Hanoi School of Public Health, Vietnam, Centre for Gender and Global Health University College London, UK.
WHO | Double burden of malnutrition. (n.d.). WHO; World Health Organization. Retrieved
January 9, 2021, from http://www.who.int/nutrition/double-burden-malnutrition/en/
WHO | Healthy diet. (n.d.). Retrieved January 14, 2021, from
https://www.who.int/news-room/fact-sheets/detail/healthy-diet
WHO | NCD and the Sustainable Development Goals. (n.d.). WHO; World Health Organization.
Retrieved January 9, 2021, from http://www.who.int/global-coordination-mechanism/ncd-themes/sustainable-development-goals/en/