The exploration of population pharmacokinetic model for meropenem in augmented renal clearance and investigation of optimum setting of dose
Tatsuro Tamatsukuri a , Masayuki Ohbayashi a , Noriko Kohyama a , Yasuna Kobayashi b , Toshinori Yamamoto c , Kenichiro Fukuda d , Shunsuke Nakamura e , Yasufumi Miyake f , Kenji Dohi d , and Mari Kogo a
a Division of Pharmacotherapeutics, Department of Clinical Pharmacy, Showa University School of Pharmacy, Tokyo, Japan
b Department of Pharmacology and Therapeutics, Faculty of Pharmaceutical Sciences, Niigata University of Pharmacy and Applied Life Sciences, Niigata, Japan
c Showa University Medical Foundation, Tokyo, Japan
d Department of Emergency, Disaster and Critical Care Medicine, Showa University, Tokyo, Japan
e Department of Emergency Medicine, Wakayama Rosai Hospital, Wakayama, Japan
f Department of Emergency Medicine, Teikyo University School of Medicine, Tokyo, Japan
Corresponding author: Tatsuro Tamatsukuri Tel: +81-3-3784-8221
E-mail: [email protected]
Division of Pharmacotherapeutics, Department of Clinical Pharmacy, Showa
University School of Pharmacy
1-5-8 Hatanodai, Shinagawa-ku, Tokyo, 142-8555, Japan
All authors meet the ICMJE authorship criteria.
Declarations of interest: none
Abstract
In recent years, augmented renal clearance (ARC), in which renal function is excessively enhanced, has been reported, and its influence on β-lactam antibiotics has been investigated. In this study, we aimed to determine the optimum population pharmacokinetic model of meropenem in patients with sepsis with ARC, and evaluated dosing regimens based on renal function.
Seventeen subjects (6 with ARC and 11 without) were enrolled in this study.
Predicted meropenem concentrations were evaluated for bias and precision using the Bland–Altman method. To examine the dosing regimen, Monte Carlo simulation was performed to calculate the cumulative fraction of response (CFR). In patients with ARC, the bias (average of the predicted value and measured value residuals) of models constructed by Crandon et al. (2011), Roberts et al. (2009), and Jaruratanasirikul et al. (2015) were 5.96 μg/mL, 10.91 μg/mL, and 4.41 μg/mL, respectively. Following 2 g meropenem every 8 h (180 min infusion), CFR ≥ 90%, a criterion of success for empirical therapy, was achieved, even with creatinine clearance of 130 –250 mL/min. For patients with sepsis and ARC, the model of Jaruratanasirikul et al. showed the highest degree of accuracy and precision and confirmed the efficacy of the meropenem dosing regimen in this patient population.
Keywords
Augmented renal clearance; meropenem; pharmacodynamics; population
pharmacokinetic analysis; sepsis
Introduction
In 2016 in Japan, approximately 11,510 fatalities among the whole population were the result of sepsis [1]. Treatment for sepsis generally involves the early administration of an antimicrobial agent. Where Pseudomonas aeruginosa is presumed to be involved in the nosocomial onset, or where the patient’s background is unknown for community-acquired onset, meropenem (MEPM), a broad spectrum carbapenem antibiotic, is one pharmacotherapeutic option. For these indications, the approved standard dosing regimens for adults include 500 mg or 1,000 mg MEPM administered as a short-term infusion every 8 h (q8h);
in the case of bacterial meningitis, doses up to 2,000 mg are recommended [2].
Renal insufficiency should be considered when determining the dose of MEPM, as this compound is excreted primarily via the kidney [3, 4]. In recent years, augmented renal clearance (ARC), a condition in which renal function is excessively enhanced, has been reported in intensive care [5]. Furthermore, a reduction in the levels of β-lactam antibiotics in the blood has been shown to be associated with ARC and is therefore of clinical interest [6, 7] because of the importance of maintaining the level of MEPM in the blood to ensure the effectiveness of antimicrobial treatment and prevent bacterial resistance.
To date, the optimum MEPM dose adjustment in patients with ARC has not been established, although therapeutic drug monitoring (TDM) [8], prolonged infusion [9], and population pharmacokinetic modeling [10] may be considered.
Population pharmacokinetic models are used to facilitate dose adjustment according to renal function in many clinical settings. Several population pharmacokinetic models of MEPM have been reported for patients with sepsis [11, 12, 13], although the accuracy of these models for predicting MEPM blood levels in patients with ARC remains unclear. Therefore, in this study, we aimed to determine the optimum model for MEPM dose adjustment in septic patients with ARC. We also evaluated a specific dosing regimen for high PK/PD target attainment according to renal function using Monte Carlo simulation.
Patients and methods
Study protocol
We included patients aged 18 years or older who were receiving MEPM for sepsis in the intensive care unit (ICU) of Showa University Hospital emergency center. The following patients were excluded: (1) patients receiving hemodialysis, (2) patients with burns, (3) patients with massive bleeding, and (4) cancer patients. The examination period was from April 8, 2016 to June 30, 2017. For the diagnosis of sepsis, systemic inflammatory response syndrome (SIRS) criteria were adopted [14]. ARC was defined as creatinine clearance (CrCl ) ≥130 mL/min/1.73 m 2 calculated by 8-h urine collection [15]. Blood samples (approximately 2 mL) were collected immediately prior to MEPM administration and 2 h after the start of infusion as a point of the elimination phase. For patients with ARC, blood samples were also collected after the second and subsequent doses of MEPM, and for patients without ARC, a blood sample was drawn after the third dose of MEPM. Age, sex, height, weight, serum creatinine value, measured CrCl, acute physiology and chronic health evaluation II (APACHE II) score, sequential organ failure assessment (SOFA) score, information on MEPM administration method and concomitant medication was collected.
In the model of Crandon et al. [11], CrCl was estimated by the Cockcroft–
Gault formula using estimated ideal body weight (IBW) (0.9 mg/dL was used for calculation when serum creatinine was ≤0.9 mg/dL in patients ≥65 years).
IBW = 50 kg + 2.3 kg for each inch over 5 feet (males) IBW = 45.5 kg + 2.3 kg for each inch over 5 feet (females)
In addition, adjusted body weight (AdjBW) was used when the actual body weight exceeded IBW by 20% or more.
AdjBW = IBW + 0.4 (actual body weight − IBW)
In the model of Roberts et al. [12], CrCl was calculated by the Cockcroft–Gault equation using actual body weight, and by the modification of diet in renal disease (MDRD) method in the model of Jaruratanasirikul et al. [13].
This study was approved by the Showa University Ethics Committee (no.
1966). All patients provided signed informed consent prior to participation in this study.
Measurement of plasma MEPM level
The MEPM level in plasma was measured using high-performance liquid chromatography as described previously [16], with minor modifications.
Cefotaxime was used as the internal standard (final concentration 2.0 µg/mL).
Samples were separated on a CAPCELL PAK C18 UG120 5 µm (4.6 mm×150 mm) column (SHISEIDO, Kyoto, Japan). The mobile phase was a mixture of 10 mM phosphate buffer (pH 7.4) and acetonitrile (94.5:5.5, v/v). The injection volume was 100 µL. The calibration curve of MEPM in human plasma was linear from 0.0 64 to 81.9 μg/mL. The limit of quantitation was 0.064 µg/mL.
For measurements, the interday and intraday accuracy of the absolute values (relative errors of the mean) and precision (as coefficient of variation) were within 10%.
Evaluation of population pharmacokinetic models
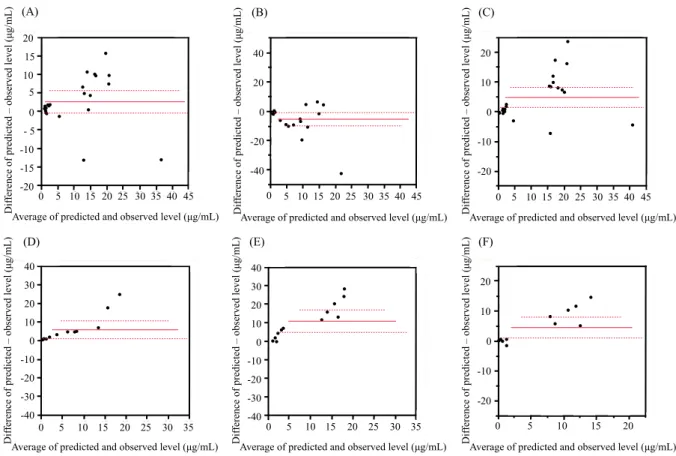
Three population pharmacokinetic models were used to predict free-form MEPM plasma level [11, 12, 13]. Blood MEPM levels were calculated based on one- or two-compartment models using reported population pharmacokinetic parameters (drug clearance, volume of distribution, and intercompartmental transfer rate constant). Predictions were evaluated for bias and precision using the Bland–Altman method [17]. The difference between the predicted value and the measured value was plotted against the average of the two values. Bias and precision were evaluated from the average of the difference between the predicted value and the measured value and the 95% confidence interval, respectively.
Evaluation of MEPM dosing regimen by Monte Carlo simulation
The achievement of 40% fT >MIC , the time point when free drug blood level
exceeds the minimum inhibitory concentration (MIC) of the causative bacteria,
was evaluated by Monte Carlo simulation using population pharmacokinetic
parameters and bacterial MIC data [18, 19]. Monte Carlo simulation (n =
10,000) was performed using Oracle Crystal Ball software (Kozo Keikaku
Engineering Inc., Tokyo, Japan).
The definitive dosing regimen was judged to be efficacious by the probability of target attainment (PTA). The PTA is the likelihood that the dosing regimen will meet or exceed the predefined pharmacodynamic target at a specific MIC.
The level of free MEPM was calculated with the assumption that the protein binding rate was 2% [3]. PTA ≥ 90 % was defined as effective.
Conversely, because the MIC is difficult to determine in empirical therapy, the dosing regimen for which the MIC distribution is taken into account should be sought. To determine the effectiveness of empirical therapy, the cumulative fraction of response (CFR) was used [20], with a value ≥ 90 % defined as effective [21]. The CFR was calculated as the summation of PTA i ×F i , with the subscript i indicating the MIC category ranked from lowest to highest MIC of a population of microorganisms, PTA i indicating the PTA of each MIC category for that drug regimen, and F i indicating the fraction of the population of microorganisms at each MIC category. The MIC distribution for the calculation of CFR used data from a surveillance study conducted in Japan (MIC ≥ 0.06 μg/mL) [22]. P. aeruginosa was selected for this evaluation because of the treatment difficulties it presents. The MIC value of 2 μg/mL for determining PTA was taken from the Clinical and Laboratory Standards Institute (CLSI) and corresponded to the drug susceptibility breakpoint of P. aeruginosa [23].
Statistical analysis
Continuous variables were evaluated by a Wilcoxon rank sum test using JMP Pro 13 software (SAS Institute Japan, Tokyo). Data are listed as median and interquartile ranges unless otherwise noted. Results were judged to be statistically significant at a significance probability less than 5% (P <0.05).
Results
Patient characteristics and clinical features
Table 1 shows the patient characteristics and clinical features of the study
participants. A total of 17 subjects were included: 6 patients with ARC (12 blood
samples) and 11 patients without ARC (22 blood samples). MEPM was intravenously infused at 1 g/day to 3 g/day (over 30–60 min). Median values of measured CrCl for patients with and without ARC were 185 and 87.6 mL/min/1.73 m 2 , respectively. The APACHEII scores of patients with and without ARC were 12.5 (9–19) and 14.0 (11–17), respectively.
Effect of ARC on MEPM plasma level
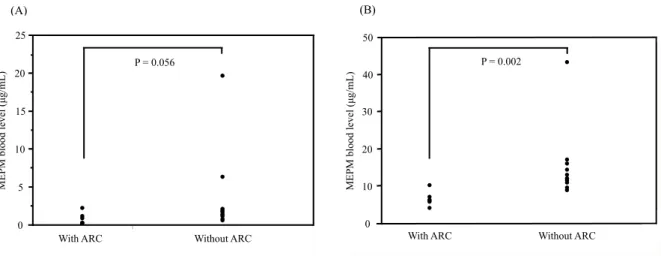
The median (quartile range) MEPM trough level was 1.73 μg/mL (0.95 μg/mL) in patients without ARC and 0.59 μg/mL (1.21 μg/mL) in patients with ARC (Fig. 1A). The median MEPM (quartile range) at 2 h after administration was 11.96 μg/mL (5.11 μg/mL) in patients without ARC and 6.11 μg/mL (2.52 μg/mL) in patients with ARC (Fig. 1B). The plasma MEPM level of patients with ARC was significantly lower than that of patients without ARC (P = 0.002).
Population pharmacokinetic parameters of each model
The population pharmacokinetic parameters of each evaluated model are shown in Table 2. The models of Jaruratanasirikul et al. and Roberts et al.
incorporated CrCl as a covariate, while the model of Crandon et al. used CrCl and adjusted body weight.
Evaluation of population pharmacokinetic models
In patients without ARC, the biases (95% confidence interval) of the models
constructed by Crandon et al. (Fig. 2A), Roberts et al. (Fig. 2B), and
Jaruratanasirikul et al. (Fig. 2C) were 2.66 μg/mL (−0.39–5.70), −5.30 μg/mL
(−9.84 to −0.77), and 4.85 μg/mL (1.46–8.24), respectively. In patients with
ARC, the corresponding biases were 5.96 μg/mL (1.14–10.77), 10.91 μg/mL
(4.87–16.95), and 4.41 μg/mL (0.93–7.89).
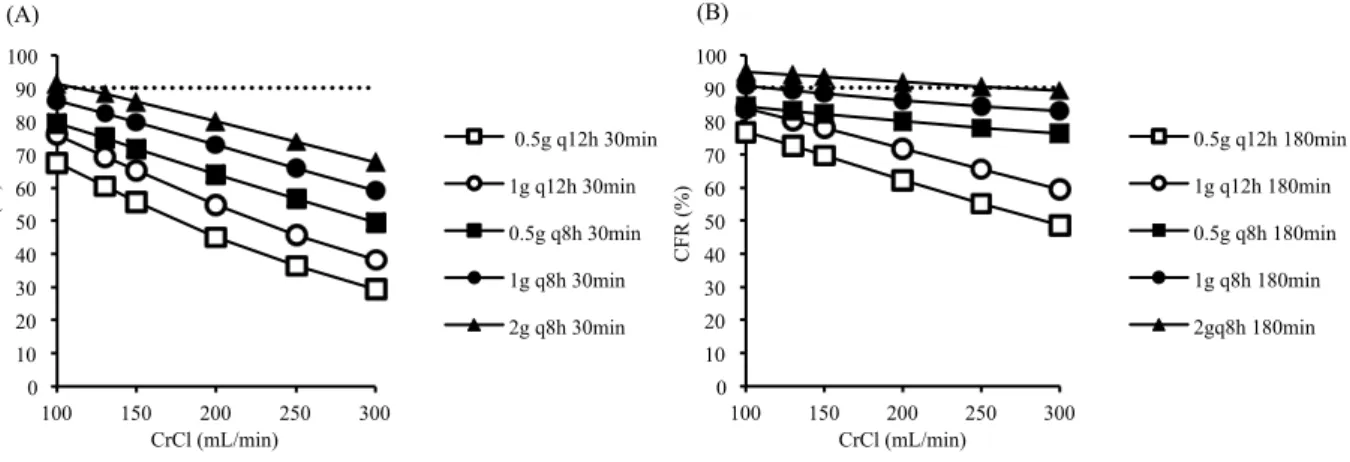
MEPM dosing regimen during empirical treatment in the patients with ARC
The CFR for each dosing regimen was calculated using the model of Jaruratanasirikul et al. (Fig. 3). In the case of CrCl of 100 mL/min, 1 g q8h was CFR 86 %, and 2 g q8h was CFR 91 % when infused for 30 min. However, for 180 min infusion, CFR ≥ 90% was achieved even at CrCl of 130–250 mL/min at 2 g q8h.
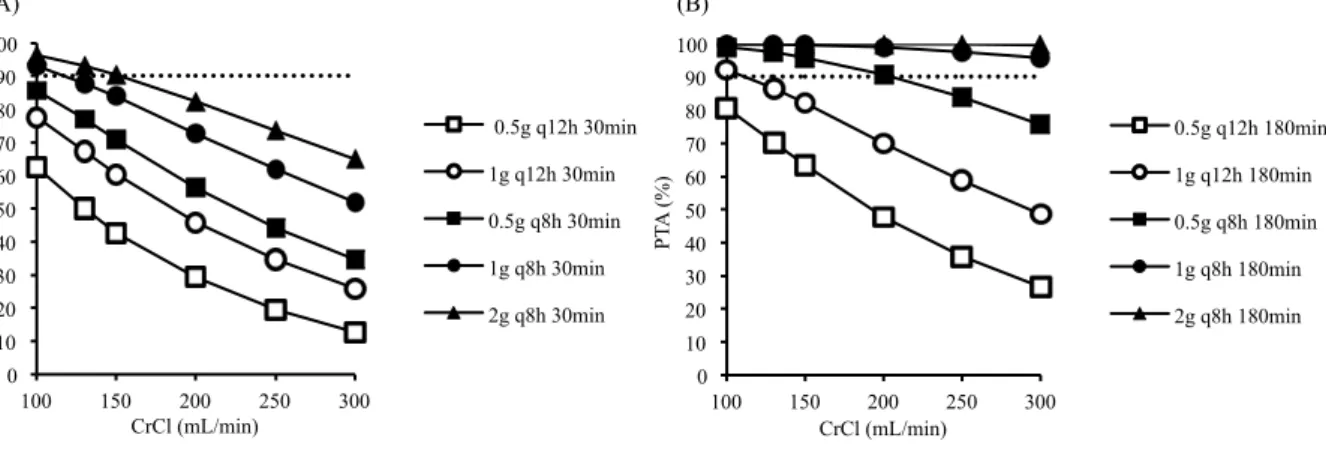
MEPM dosing regimen for definitive therapy in patients with ARC
For CrCl 100 mL/min, PTA was 93 % when administered at 1 g q 8 h for 30 min (Fig. 4A). However, at CrCl of 130 mL/min or more, PTA did not reach the target. For infusion of 180 min, PTA ≥ 90 % was maintained within the range of CrCl 100–300 mL/min with dosing regimens of 1 g q8h and 2 g q8h (Fig. 4B).
Discussion
Numerous population pharmacokinetic models of MEPM have been described to date, including specific models for critically ill patients in the ICU [24].
Given the complexities associated with modeling patients in the ICU, however, studies have mainly focused on populations such as dialysis patients [25] and those with burns [26] and a model specific to ARC has not yet been reported. As population pharmacokinetic models of patients with sepsis include those with CrCl of 130 mL/min or more, we selected three models in this study for the evaluation of external validity in patients with ARC.
Variations in bias and precision were observed among the reported models. The model of Crandon et al. had the least bias and high accuracy in patients without ARC. Patients with ARC were younger, with only one aged 65 years old or over.
The predicted MEPM level for this patient was therefore calculated using
corrected serum creatinine, but a large difference was observed between the
measured value and the predicted value. Therefore, when suspecting ARC in
older individuals, measured CrCl should be evaluated. The effect of adjusted
weight incorporated as a covariate was not evaluated in this study as adjusted
weight when calculating V 1 was not used for any patient with ARC.
In the model of Roberts et al., patients with ARC had the most bias and low precision (Fig. 2E). The population used to construct the model was patients with normal renal function, and the 75th percentile of CrCl was 161 mL/min.
Three out of six patients with ARC had a CrCl value ≥161 mL/min, which was considered to be one reason for the observed level of inaccuracy. In the model of Roberts et al., MEPM clearance was inversely proportional to CrCl, and for patients without ARC, CrCl levels ≤50 mL/min were associated with larger errors.
In patients with ARC, the model established by Jaruratanasirikul et al. had the least bias and highest precision (Fig. 2F), and the lowest APACHE II score was 16. In the present study, 4 of 6 patients had an APACHE II score <16, but it was presumed that this would have no effect on bias. However, a higher maximum CrCl (214 mL/min) than that observed with other models might have contributed to the low degree of bias. The 95% confidence interval of the Jaruratanasirikul model was >0 in patients with ARC, indicating that the predicted value was higher than the measured value. We considered the possibility that the total body clearance was underestimated. The median (range) of the total body clearance calculated by the model of Jaruratanasirikul et al.
was 15.7 L/h/1.73 m 2 (11.8–19.1 L/h/1.73 m 2 ). We thus considered that the total body clearance of the patients with ARC had increased. In past reports, however, the total body clearance of healthy subjects was higher than that calculated by the model of Jaruratanasirikul et al., with a mean ± standard deviation of 19.7 ± 5.7 L/h/1.73 m 2 [27]. These findings infer that underestimation of total body clearance was the cause of the high estimated predicted value. The volume of distribution could not be calculated from the blood sampling point in this study.
Evaluation of external validity by the Bland–Altman method showed that the model of Jaruratanasirikul et al. had the highest accuracy and precision compared with other models. Therefore, the model of Jaruratanasirikul et al. was considered optimal when evaluating the dosing regimen for septic patients with ARC.
We investigated the effect of ARC on MEPM blood level and found that, in
patients with ARC, 1 g q8h was administered over 30–60 min (maximum dose
for severe infection) but the blood level was low in comparison with that of
patients without ARC (Fig. 1). Because patients with ARC had low MEPM
blood levels, it was necessary to adjust usage and dosage.
Therefore, using the model of Jaruratanasirikul et al., which was judged to have high external validity, the optimum MEPM dosing regimen in patients with ARC was evaluated by simulation. In many studies, a dosing regimen that achieves CFR ≥ 90 % is considered appropriate empirical therapy [28], and was also considered effective in this study. MEPM 2 g q8h with 180 min infusion achieved CFR ≥ 90 % at CrCl values of 130–250 mL/min, and was thus considered effective (Fig. 3).
Ehmann et al. investigated the rate of PK/PD target attainment among critically ill patients with varying renal functions in a prospective observational study [29].
In that study, a lower rate of the PK/PD target attainment (100% fT >MIC ) in patients with CrCl >60 mL/min was established. Furthermore, when MEPM was administered to patients with ARC at 1 g q8h for 30 min (standard dosing regimen), the PK/PD target attainment rate was 0%. Sjövall et al. estimated appropriate MEPM dosing regimens for treatment of P. aeruginosa infection in patients with sepsis by using a Monte Carlo simulation of empirical therapy.
Attainment of 40% fT >MIC was evaluated, with a value of ≥90% defined as effective for CrCl of 200 mL/min. Although 40% fT >MIC was not achieved at 1 g q8h for 30 min, it was achieved at 1 g q8h for 180 min. The authors concluded that doses may need to be increased and the infusion may need to be prolonged to increase the likelihood of achieving the target plasma concentrations in patients with septic shock and a possible ARC. Therefore, it was considered that a prolonged infusion of MEPM was required for patients with ARC.
For the assumed definitive dosing regimen for P. aeruginosa, PTA was calculated and its effectiveness was evaluated (Fig. 4). Because 1 g q8h 30 min infusion resulted in PTA 93 % for CrCl 100 mL/min, we judged this regimen to be effective for treating MEPM-susceptible P. aeruginosa. However, for CrCl
>130 mL/min, PTA was <90 %, mandating prolonged infusion of 180 min. This finding suggests that prolonged infusion is necessary in both empirical and definitive therapy for patients with ARC.
This study has some limitations. First, SIRS criteria were adopted for the
diagnosis of sepsis in this study; notably, these criteria are different from the
current definition. Second, there was no significant difference in the trough level
between the patients with and without ARC. This was thought to be due to the
fact that the half-life was short and the level became extremely low after 8 hours.
Third, the model of Jaruratanasirikul et al. is applicable for patients with sepsis and not only those with ARC. We anticipate that MEPM blood level may be predicted more accurately using a model developed only for patients with ARC.
Finally, the effect indicator used in this study was PK/PD target, although no previous report has investigated clinical outcomes using this model. Therefore, a large-scale study to examine clinical outcomes following prolonged infusion and high-dose MEPM in patients with ARC is required.
In conclusion, among the available population pharmacokinetic models for MEPM in septic patients with ARC, the model of Jaruratanasirikul et al. was found to be the most accurate and precise. Furthermore, a dosing regimen of 2 g of q8h 180 min infusion was established for empirical therapy in patients with ARC and renal function of CrCl >130 mL/min. Finally, for definitive therapy, a regimen of 1 g MEPM q8h for 180 min was predicted to be effective in patients with CrCl of 130–300 mL/min.
Acknowledgments
We would like to thank Anri Sasaki, Kaori Yamamoto, and Mariko Nakayama for assistance with the analytical determination of MEPM. We also thank Clare Cox, PhD, from Edanz Group (www.edanzediting.com/ac) for editing a draft of this manuscript.
This research did not receive any specific grant from funding agencies in the public, commercial, or not for profit sectors.
Conflict of interest: None
References
[1] Ministry of Health, Labour and welfare. Demographics survey in Japan,
http://www.mhlw.go.jp/toukei/list/81-1a.html [accessed 22 December 2017].
[2] FDA. Drugs@FDA: FDA Approved Drug Products, https://www.accessdata.fda.gov/scripts/cder/daf/index.cfm?event=overview.proc ess&ApplNo=050706 [accessed 26 December 2017].
[3] Craig WA. The pharmacology of meropenem, a new carbapenem antibiotic.
Clin Infect Dis 1997;24 Suppl 2:S266–75.
[4] Shibayama T, Sugiyama D, Kamiyama E, Tokui T, Hirota T, Ikeda T.
Characterization of CS-023 (RO4908463), a novel parenteral carbapenem antibiotic, and meropenem as substrates of human renal transporters. Drug Metab Pharmacokinet 2007;22:41–7.
[5] Udy AA, Baptista JP, Lim NL, Joynt GM, Jarrett P, Wockner L, et al.
Augmented renal clearance in the ICU: results of a multicenter observational study of renal function in critically ill patients with normal plasma creatinine concentrations. Crit Care Med 2014;42:520–7.
[6] Huttner A, Von DE, Renzoni A, Huttner BD, Affaticati M, Pagani L, et al.
Augmented renal clearance, low β-lactam concentrations and clinical outcomes in the critically ill: an observational prospective cohort study. Int J Antimicrob Agents 2015;45:385–92.
[7] Udy AA, Varghese JM, Altukroni M, Briscoe S, McWhinney BC, Ungerer JP, et al. Subtherapeutic initial β-lactam concentrations in select critically ill patients: association between augmented renal clearance and low trough drug concentrations. Chest 2012;142:30–9.
[8] Tröger U, Drust A, Martens-Lobenhoffer J, Tanev I, Braun-Dullaeus RC, Bode-Böger SM. Decreased meropenem levels in intensive care unit patients with augmented renal clearance: benefit of therapeutic drug monitoring. Int J Antimicrob Agents 2012;40:370–2.
[9] Carlier M, Carrette S, Roberts JA, Stove V, Verstraete A, Hoste E, et al.
Meropenem and piperacillin/tazobactam prescribing in critically ill patients:
does augmented renal clearance affect pharmacokinetic/pharmacodynamic target attainment when extended infusions are used? Crit Care 2013;17:R84.
[10] Sjövall F, Alobaid AS, Wallis SC, Perner A, Lipman J, Roberts JA.
Maximally effective dosing regimens of meropenem in patients with septic shock. J Antimicrob Chemother 2018;73:191–8.
[11] Crandon JL, Ariano RE, Zelenitsky SA, Nicasio AM, Kuti JL, Nicolau DP.
Optimization of meropenem dosage in the critically ill population based on renal
function. Intensive Care Med 2011;37:632–8.
[12] Roberts JA, Kirkpatrick CM, Roberts MS, Robertson TA, Dalley AJ, Lipman J. Meropenem dosing in critically ill patients with sepsis and without renal dysfunction: intermittent bolus versus continuous administration? Monte Carlo dosing simulations and subcutaneous tissue distribution. J Antimicrob Chemother 2009;64:142–50.
[13] Jaruratanasirikul S, Thengyai S, Wongpoowarak W, Wattanavijitkul T, Tangkitwanitjaroen K, Sukarnjanaset W, et al. Population pharmacokinetics and Monte Carlo dosing simulations of meropenem during the early phase of severe sepsis and septic shock in critically ill patients in intensive care units.
Antimicrob Agents Chemother 2015;59:2995–3001.
[14] Levy MM, Fink MP, Marshall JC, Abraham E, Angus D, Cook D, et al.
2001 SCCM/ESICM/ACCP/ATS/SIS International Sepsis Definitions Conference. Crit Care Med 2003;31:1250–6.
[15] Sime FB, Udy AA, Roberts JA. Augmented renal clearance in critically ill patients: etiology, definition and implications for beta-lactam dose optimization.
Curr Opin Pharmacol 2015;24:1–6.
[16] Ikeda K, Ikawa K, Morikawa N, Miki M, Nishimura S, Kobayashi M.
High-performance liquid chromatography with ultraviolet detection for real-time therapeutic drug monitoring of meropenem in plasma. J Chromatogr B Analyt Technol Biomed Life Sci 2007;856:371–5.
[17] Bland JM, Altman DG. Applying the right statistics: analyses of measurement studies. Ultrasound Obstet Gynecol 2003;22:85–93.
[18] Craig WA. Pharmacokinetic/pharmacodynamic parameters: rationale for antibacterial dosing of mice and men. Clin Infect Dis 1998;26:1–10.
[19] Nicolau DP. Pharmacokinetic and pharmacodynamic properties of meropenem. Clin Infect Dis 2008;47:S32–40.
[20] Mouton JW, Dudley MN, Cars O, Derendorf H, Drusano GL.
Standardization of pharmacokinetic/pharmacodynamic (PK/PD) terminology for anti-infective drugs: an update. J Antimicrob Chemother 2005;55:601–7.
[21] Ludwig E, Konkoly-Thege M, Kuti JL, Nicolau DP. Optimising antibiotic dosing regimens based on pharmacodynamic target attainment against Pseudomonas aeruginosa collected in Hungarian hospitals. Int J Antimicrob Agents 2006;28:433–8.
[22] Yamaguchi K, Ishii Y, Tateda K, Iwata M, Watanabe N, Shinagawa M, et al.
Nationwide surveillance of parenteral antibiotics containing meropenem
activities against clinically isolated strains in 2012. Jpn J Antibiot 2014;67:73–
107.
[23] Clinical and Laboratory Standards Institute. Performance standards for antimicrobial susceptibility testing. Eighteenth informational supplement.
M100–22th Wayne, Pennsylvania: CLSI; 2012.
[24] Kees MG, Minichmayr IK, Moritz S, Beck S, Wicha SG, Kees F, et al.
Population pharmacokinetics of meropenem during continuous infusion in surgical ICU patients. J Clin Pharmacol 2016;56:307–15.
[25] Ulldemolins M, Soy D, Llaurado-Serra M, Vaquer S, Castro P, Rodríguez AH, et al. Meropenem population pharmacokinetics in critically ill patients with septic shock and continuous renal replacement therapy: influence of residual diuresis on dose requirements. Antimicrob Agents Chemother 2015;59:5520–8.
[26] Ramon-Lopez A, Allen JM, Thomson AH, Dheansa BS, James SE, Hanlon GW, et al. Dosing regimen of meropenem for adults with severe burns: a population pharmacokinetic study with Monte Carlo simulations. J Antimicrob Chemother 2015;70:882–90.
[27] Leroy A, Fillastre JP, Borsa-Lebas F, Etienne I, Humbert G.
Pharmacokinetics of meropenem (ICI 194,660) and its metabolite (ICI 213,689) in healthy subjects and in patients with renal impairment. Antimicrob Agents Chemother 1992;36:2794-8.
[28] Bradley JS, Dudley MN, Drusano GL. Predicting efficacy of antiinfectives with pharmacodynamics and Monte Carlo simulation. Pediatr Infect Dis J 2003;22:982–92.
[29] Ehmann L, Zoller M, Minichmayr IK, Scharf C, Maier B, Schmitt MV, et al.
Role of renal function in risk assessment of target non-attainment after standard dosing of meropenem in critically ill patients: a prospective observational study.
Crit Care 2017;21:263.
[30] Sjövall F, Alobaid AS, Wallis SC, Perner A, Lipman J, Roberts JA.
Maximally effective dosing regimens of meropenem in patients with septic
shock. J Antimicrob Chemother 2018;73:191–8.
Figure legends
Fig. 1. Comparison of MEPM blood levels obtained from patients with and without ARC.
MEPM, meropenem; ARC, augmented renal clearance; IQR, interquartile range.
(A) represents trough level and (B) represents blood level 2 hours after the start of infusion. MEPM dosage ranged from 1 g to 3 g per day. (A) The median (IQR) of MEPM level was 0.59 (1.21) μg/mL with ARC and 1.73 (0.95) μg/mL without ARC. (B) The median (IQR) of MEPM level was 6.11 (2.52) μg/mL with ARC and 11.96 (5.11) μg/mL without ARC. Comparisons between groups were made using a Wilcoxon rank sum test. Results were considered significant at the 5% critical level (P < 0.05).
Fig. 2. Bland–Altman plots of differences between predicted and observed MEPM levels against the means of predicted and observed levels for the evaluated models.
MEPM, meropenem; ARC, augmented renal clearance.
(A) Crandon et al. model without ARC, (B) Roberts et al. model without ARC, (C) Jaruratanasirikul et al. model without ARC, (D) Crandon et al. model with ARC, (E) Roberts et al. model with ARC, (F) Jaruratanasirikul et al. model with ARC. The solid line represents the mean of the differences (bias). The dashed line represents the 95% confidence interval (precision).
Fig. 3. CFR for different creatinine clearances and dosing regimens.
CFR, cumulative fraction of response; CrCl, creatinine clearance; MIC, minimum inhibitory concentration; PTA, probability of target attainment; q8h, every 8 h; q12h, every 12 h.
(A) represents the 30 min infusion regimen and (B) represents the 180 min infusion regimen. CFR was calculated by totaling the value obtained by multiplying the fraction of each MIC in the total number of bacterial strains by PTA at each MIC. MIC distribution was >0.06 µg/mL for empirical therapy.
CFR was considered successful at ≥90%.
Fig. 4. PTA for different creatinine clearances and dosing regimens.
PTA, probability of target attainment; MIC, minimum inhibitory concentration;
CrCl, creatinine clearance; q8h, every 8 h; q12h, every 12 h.
(A) represents the 30 min infusion regimen and (B) represents the 180 min infusion regimen. PTA is expressed as a fraction that achieves 40% fT >MIC
among the simulations performed 10,000 times. The broken horizontal line indicates PTA ≥90 % above which the PTA was considered successful.
Table 1
Patient demographics and clinical characteristics.
Patients with ARC
(n = 6) Patients without ARC
(n = 11)
Male/female, n 4 / 2 7 / 4
Age, years 43.0 (33–55) 77.0 (65–82)
Height, cm 162.5 (155–178) 160.0 (151–170)
Body weight, kg 53.3 (48–73) 50.1 (47–73)
Weight change, kg 1.9 (−2.6–6.9) −1.6 (−3.4–0.2)
SOFA score 3.5 (0–6) 4.0 (3–7)
APACHE II score 12.5 (9–19) 14 .0 (11–17)
Site of infection, n
Lung 2 5
Urinary tract 1 2
Bloodstream - 1
Bone marrow - 1
Soft tissue 1 1
Unknown 2 1
Meropenem regimen, n
1 g q8 h 30 min infusion 2 2
1 g q8 h 45 min infusion 3 4
1 g q8 h 60 min infusion 1 -
1 g q12 h 30 min infusion - 2
0.5 g q12 h 45 min infusion - 1
0.5 g q12 h 60 min infusion - 2
Vasopressor, n (%) 1 (16.7) 3 (27.3)
Serum creatinine, mg/dL 0.40 (0.35–0.48) 0.81 (0.58–1.44) Measured creatinine clearance,
mL/min/1.73 m2 185.6 (144–221) 87.6 (38.9–108.2)
SOFA, Sequential Organ Failure Assessment; APACHE II, Acute Physiology and Chronic Health Evaluation II;
q8h, every 8 h; q12h, every 12 h.
Data presented are medians (interquartile range) unless otherwise stated. Weight change represents the
difference between hospital admission and administration start date of meropenem.
Table 2
Population pharmacokinetic parameters of methods for the prediction of MEPM.
Study Population pharmacokinetic parameters
One-compartment population pharmacokinetic model
Jaruratanasirikul et al. [13] CL (L/h) = 3.01 + 0.07 · CrCl ; V (L) = 23.7
Two-compartment population pharmacokinetic models
Crandon et al. [11] K (h-1) = 0.392 + 0.003 · CrCl; V1 (L) = AdjBW · 0.239
Roberts et al. [12] CL (L/h) = 13.6 · (6/CrCl) ; V1 (L) = 7.9 ; V2 (L) = 14.8
MEPM, meropenem; CL, meropenem plasma clearance; CrCl, creatinine clearance; V, volume of distribution for one-compartment model; K, elimination rate constant from the central compartment; V1, volume of distribution of the central compartment; V2, volume of distribution of the peripheral compartment; AdjBW, adjusted body weight.
Fig. 1. Comparison of MEPM blood levels obtained from patients with and without ARC.
(A)
トラフ
ARC nonARC
ARC有無 With ARC
MEPM blood level (µg/mL)
Without ARC 0
5 15 20
10
P = 0.056 25
0 10 20 30 40 50
ARC nonARC
10 20 30 40
MEPM blood level (µg/mL)
With ARC Without ARC
(B)
P = 0.002
0 50
Fig. 2. Bland–Altman plots of differences between predicted and observed MEPM levels against the means of predicted and observed levels for the evaluated models.
-20 -15 -10 -5 0 5 10 15 20
差: Crandon予測値-実測値
実測値 Crandon予測値
0 5 10 15 20 25 30 35 40 45 平均: (Crandon予測値+実測値)/2 45 0 5 10 15 20 25 30 35 40 20
15 10
0 - 5 -10 -15 -20 5
Average of predicted and observed level (µg/mL) Difference of predicted – observed level (µg/mL) (A)
-40 -20 0 20 40
差: Roberts予測値-実測値
実測値
Roberts予測値0 5 10 15 20 25 30 35 40 45 平均: (Roberts予測値+実測値)/2
40
20
0
-20
-40
0 5 10 15 20 25 30 35 40 45 Average of predicted and observed level (µg/mL) Difference of predicted – observed level (µg/mL) (B)
-20 -10 0 10 20
差: Jaruratanasirikul予測値-実測値
実測値
Jaruratanasirikul予測値
0 5 10 15 20 25 30 35 40 45
平均: (Jaruratanasirikul予測値+実測値)/2
0
-10
-20
45
0 35 40
10 20
5 10 15 20 25 30
Average of predicted and observed level (µg/mL) Difference of predicted – observed level (µg/mL) (C)
-40 -30 -20 -10 0 10 20 30 40
差: Crandon予測値-実測値
実測値 Crandon予測値
0 5 10 15 20 25 30 35
平均: (Crandon予測値+実測値)/2
0 5 10 15 20 25 30 35
0 -10 10
-20 20 30 40
-30 -40
Average of predicted and observed level (µg/mL) Difference of predicted – observed level (µg/mL) (D)
-40 -30 -20 -10 0 10 20 30 40
差: Roberts予測値-実測値
実測値 Roberts予測値
0 5 10 15 20 25 30 35
平均: (Roberts予測値+実測値)/2
0 5 10 15 20 25 30 35
0 -10 10
-20 20 30 40
-30 -40
Average of predicted and observed level (µg/mL) Difference of predicted – observed level (µg/mL) (E)
-20 -10 0 10 20
差: Jaruratanasirikul予測値-実測値
実測値
Jaruratanasirikul予測値
0 5 10 15 20
平均: (Jaruratanasirikul予測値+実測値)/2
0 5 10 15 20
0
-10 10 20
-20
Average of predicted and observed level (µg/mL) Difference of predicted – observed level (µg/mL) (F)
Fig. 3. CFR for different creatinine clearances and dosing regimens.
CFR (%)
CrCl (mL/min) (A)
0 10 20 30 40 50 60 70 80 90 100
100 150 200 250 300
0.5g q12h 30min 1g q12h 30min 0.5g q8h 30min 1g q8h 30min 2g q8h 30min
CFR (%)
CrCl (mL/min) (B)
0 10 20 30 40 50 60 70 80 90 100
100 150 200 250 300
0.5g q12h 180min 1g q12h 180min 0.5g q8h 180min 1g q8h 180min 2gq8h 180min
Fig. 4. PTA for different creatinine clearances and dosing regimens.
PTA (%)
CrCl (mL/min) 0
10 20 30 40 50 60 70 80 90 100
100 150 200 250 300
0.5g q12h 30min 1g q12h 30min 0.5g q8h 30min 1g q8h 30min 2g q8h 30min (A)
PTA (%)
CrCl (mL/min) 0
10 20 30 40 50 60 70 80 90 100
100 150 200 250 300
0.5g q12h 180min 1g q12h 180min 0.5g q8h 180min 1g q8h 180min 2g q8h 180min (B)