STUDIES ON TOXIN UPTAKE AND ACCUMULATION PROFILES IN PUFFERFISH TISSUES
フグ類各組織の毒取り込み・蓄積プロファイルに関する研究
March, 2020
Graduate School of Fisheries and Environmental Sciences Nagasaki University
Wei Gao
CONTENTS
GENERAL INTRODUCTION...1-10
Chapter I Contrasting Toxin Selectivity between the Marine Pufferfish Takifugu pardalis and the Freshwater Pufferfish Pao suvattii ...11-24
Chapter II Evaluation of the tetrodotoxin uptake ability of pufferfish Takifugu rubripes tissues according to age using an in vitro tissue slice incubation method...25-41
Chapter III Profile differences in tetrodotoxin transfer to skin and liver in the pufferfish Takifugu rubripes...42-54
Chapter IV Maturation‑associated changes in internal distribution and intra-ovarian microdistribution of tetrodotoxin in the pufferfish Takifugu pardalis...55-79
Chapter V GENERAL DISCUSSION...80-90
ACKNOWLEDGEMENT...91-93
REFERENCES...94-109
General introduction
Pufferfish have a long history in the Japanese food culture, and also have been an important aquatic resource in Asian countries. However, it is well known that pufferfish possess a potent neurotoxin, tetrodotoxin (TTX).
TTX is an alkaloid with a low molecular weight of 319 and was firstly isolated in 1950 as a crystalline prism from toxic pufferfish (Yokoo, 1950).
TTX is lethal to humans and causes muscle paralysis by specifically blocking voltage-gated sodium channels (Geffeney and Ruben, 2006;
Narahashi, 2001). Therefore, food poisoning due to the consumption of these fish often occurs in Japan and some Southeast Asian countries such as Vietnam, Philippine, and Cambodia (Toda et al., 2012). TTX was considered only distributed in pufferfish. However, since Mosher et al.
(1964) detected TTX in the eggs of the California newt Taricha torosa, TTX was found in various other marine organisms including certain species of gobies Gobius criniger (Noguchi and Hashimoto, 1973), octopuses Hapalochlaena maculosa (Sheumack et al., 1978), gastropods Charonia sauliae (Noguchi et al., 1982), starfish Astropecten polyacanthus (Noguchi et al., 1982), crabs Atergatis floridas (Noguchi et al., 1983), flatworms (Miyazawa et al., 1986), and ribbon worms (Miyazawa et al., 1988). Since Noguchi et al. (1986) detected TTX in a
floridus, and Yasumoto et al. (1986) found another TTX-containing bacteria Alteromonas sp. from herbivorous fish Ypsiscarus ovifrons and xanthid crab Zosimus aeneus, TTX-containing bacteria which distributes over a broad range in marine environment was reported and considered as origin of TTX and cause the toxification of those marine organisms (Noguchi and Arakawa, 2008). Pufferfish such as Takifugu rubripes and Takifugu alboplumbeus (formerly known as Takifugu niphobles (Jordan and Snyder, 1901)) become non-toxic when artificially reared with non- toxic diets after hatching (Matsui et al., 1982; Noguchi et al., 2006) and such non-toxic pufferfish become toxic when orally administered TTX (Honda et al., 2005; Yamamori et al., 2004). These findings indicate that the toxification of pufferfish is exogenous and derived from a food chain that begins with marine bacteria, although the transfer, accumulation, and elimination mechanisms of TTX taken up into the pufferfish body via the food organisms remain to be elucidated.
The toxin content and distribution in the pufferfish fluctuate according to species. In the natural environment, Takifugu flavipterus (formerly known as poecilonotus) has high level of TTX in the skin, while adult T.
rubripes accumulates little TTX in the skin. Several pufferfish species which possess high level of toxicity in the skin have secretory glands or secretory cells (sacciform cells) in the skin (Kodama et al., 1986), but in T.
rubripes no glandular structure is observed, which is considered as the
possible reason for the difference of toxicity in the skin among those species (Ikeda et al., 2009).
On the other hand, freshwater pufferfish contain paralytic shellfish poison (PSP) as the major toxic component. PSP is a group of neurotoxins produced by toxic dinoflagellates of the genera Alexandrium, Gymnodinium, and Pyrodinium in marine environments and by toxic cyanobacteria of the genera Anabaena, Cylindrospermopsis, Aphanizomenon, Planktothrix, and Lyngbya in freshwater environments (Cusick et al., 2013). The main component of PSP, saxitoxin (STX), has an almost equivalent molecular size and mode of action to TTX (Cusick et al., 2013). Marine Sphoeroides pufferfish in Florida (Landsberg et al., 2006) and marine Arothron pufferfish in the Philippines (Sato et al., 2000) and Japanese coastal waters (Nakashima et al., 2004) are also highly toxified by PSP. In addition, small amounts of PSP are detected in edible marine pufferfish of the genus Takifugu (Kodama et al., 1983; Nakamura et al., 1984; Jang et al., 2006), raising a food hygiene issue in Japan.
Considering the similarity of the molecular size, toxicity and the poisoning mechanism between TTX and STX, why freshwater pufferfish specifically accumulate PSP still remains unclear.
To understand the TTX kinetics after TTX is absorbed into the pufferfish body through the intestine, various TTX administration experiments were conducted using artificially reared pufferfish specimens.
Nontoxic specimens of T. rubripes and T. alboplumbeus were reared with TTX-containing diets on a long-term basis, and as results, they accumulate TTX efficiently into specific tissues, such as the skin, liver, and ovary (Matsui et al., 1981; Yamamori et al., 2004; Honda et al., 2005; Kono et al., 2008). Also it was suggested that after aborting the TTX-containing diet, the TTX content in the liver gradually decreased, while it increased in the skin and ovary. Intramuscular or intravenous administration of TTX to the nontoxic specimens to observe short-term toxin behavior just after administration revealed that the administered TTX is transferred first to the liver and then to the skin via blood circulation, but toxin transfer to the gonads differs greatly between males and females with the toxin transferring to and accumulating in only the ovary (Ikeda et al., 2009;
Matsumoto et al., 2008b; Wang et al., 2011, 2012). According to these researches, the TTX kinetics inside the pufferfish body has been partly clarified. However, Nagashima et al. (2003) and Matsumoto et al. (2005, 2007) demonstrated that the ability to take up TTX is TTX-specific by in vitro experiments using T. rubripes liver tissue slices, and that the ability is higher than that of the livers of other fish, and suggested the exhibition of a carrier-mediated transport system for TTX into the liver. In addition, the toxin-binding protein (puffer fish saxitoxin and tetrodotoxin binding protein; PSTBP) was separated from the blood plasma of the pufferfish T.
alboplumbeus and Takifugu pardalis (Matsui et al., 2000; Yotsu-Yamashita
et al., 2001), and genes homologous to that of PSTBP were also found in T. rubripes and other Takifugu pufferfishes (Tatsuno et al., 2013b;
Hashiguchi et al., 2015). Yotsu-Yamashita et al. (2013) suggested that these TTX-binding proteins could be involved in TTX transfer via blood circulation to the skin. These studies indicated that the molecular mechanisms involved in the transfer/accumulation of TTX in the skin and liver could be different.
The distribution of TTX inside the pufferfish body is also affected by the growth of the individuals even in the same species. In wild adult T.
rubripes, the liver and ovary are generally strongly toxic, and the skin, muscle, and testis are non-toxic (Noguchi and Arakawa, 2008), but in wild young fish, the skin is the main toxin-accumulating tissue. In TTX administration experiments using non-toxic cultured young T. rubripes, much of the TTX is transferred to the skin (Honda et al., 2005; Ikeda et al., 2009). Tatsuno et al. (2013) conducted an in vivo oral gavage TTX administration experiment in T. rubripes of different ages, and found that the administered TTX was mainly transferred to the skin in young fish (6 months old), whereas most of it was transferred to and accumulated in the liver in adult fish (15 months old). They speculated that because the liver is undeveloped and has low TTX-accumulating ability in young fish, the TTX mainly accumulates in the skin for elimination, but as the liver develops TTX accumulates and is stored in the liver. The distribution of
TTX in the pufferfish body also changes with the maturation of individuals.
In the natural environment, T. flavipterus, and T. alboplumbeus typically have high concentrations of TTX in the liver and skin, but during maturation females accumulate TTX mainly in the ovary and skin, and males accumulate TTX mainly in the skin and liver, with the total TTX amount being higher in females (Ikeda et al., 2010; Itoi et al., 2016). Wang et al. (2011) reported that TTX administered intramuscularly to hybrid specimens produced by crossbreeding T. rubripes with T. alboplumbeus, which matures earlier than T. rubripes, is first taken up in the liver and then transferred to and accumulates in the ovary in females and the skin in males.
It is possible that the organs of pufferfish have different TTX uptake/accumulation pattern depending on the species, and growth/maturation stage. However, there still are some unclear points on how the development of the liver, skin, and ovary affect the TTX distribution inside the pufferfish body.
In the present study, to further clarify the TTX transfer/accumulation mechanism in pufferfish, focusing on those main accumulation organs including the liver, skin, ovary, and the first barrier when TTX is absorbed into the pufferfish body, we investigated the toxin transfer/accumulation profiles of each tissue based on in vivo toxin administration experiments and in vitro tissue incubation experiments on nontoxic artificially reared pufferfish, and the survey on wild pufferfish.
In Chapter I, to clarify the differences of the toxin selectivity between marine and freshwater pufferfish, in vivo administration experiments of TTX and PSP were conducted using artificially reared nontoxic specimens of T. pardalis (marine) and Pao suvattii (freshwater). T. pardalis specimens were administered feed homogenate containing TTX or dicarbamoylSTX (dcSTX) (dose of toxin, 55.2 nmol/fish) and P. suvattii specimens were administered feed homogenate containing TTX + STX (dose of each toxin, 19.2 nmol/fish) by oral gavage, and then collected after 24 and 48 or 72 h.
In T. pardalis, TTX administered into the intestine was absorbed into the body and transferred and retained mainly in the skin and liver, while dcSTX was hardly retained in the body, although it partly remained in the intestine. In strong contrast, in P. suvattii, little TTX remained in the body, whereas STX was absorbed into the body and was transferred and retained in the ovary and skin. The findings revealed that TTX/PSP selectivity differs between the marine species T. pardalis and the freshwater species P. suvattii. T. pardalis, which naturally harbors TTX, selectively accumulates TTX, and P. suvattii, which naturally harbors PSP, selectively accumulates PSP.
In Chapter II, the TTX uptake ability of the tissues in T. rubripes was investigated using in vitro tissue incubation experiment. The tissue slices prepared from the liver, skin, and intestine of the nontoxic cultured T.
rubripes, were incubated in a 25 µg/mL TTX-containing buffer for 1-48 h,
and then the TTX content of each tissue was quantified. As a result, the TTX content temporally increased in all tissues. The TTX content in the skin and intestine slices was comparable to or slightly higher than that in the liver slices, with a similar transition pattern between the three tissue types. Therefore, we consider that the tissue slice incubation method can be applied for evaluating the TTX uptake ability of the skin and intestine.
Same experiments were conducted using adult and young T. rubripes specimens. There is no significant difference of the TTX uptake ability of the liver and intestine between them, however, the skin slices of young fish took up approximately twice as much TTX as that of adult fish, suggesting that the TTX uptake ability of the skin is involved in the growth-dependent changes in the toxin distribution inside the body in T. rubripes. According to the observation on the TTX micro-distribution in the tissue slices using immunohistochemical staining, TTX is transferred and accumulates from pancreatic exocrine cells to hepatic parenchymal cells in the liver, from connective tissues to basal cells in the skin, and from villi epithelial cells via the lamina propria to the muscle layer in the intestine.
In Chapter III, TTX (dose of toxin, 30 (Low dose; LD), 100 (Medium dose; MD), and 300 (High dose; HD) μg/individual) was intramuscularly administered to cultured T. rubripes, and then fish were collected 24 h after toxin administration to elucidate the differences in TTX transfer/accumulation profiles between the liver and skin. As a result,
although the TTX concentration of both the liver and skin significantly increased with an increase in the dose, the slope coefficients differed significantly. At LD, the TTX concentration of the liver and skin is almost at the same level (0.43-0.48 µg/g), but at HD, the TTX concentration of the liver (6.0 µg/g) is approximately as 3.5 times higher than the skin (1.7 µg/g). Relationships between the dose and the TTX accumulation ratio (ratio (%) of accumulated TTX in each tissue (mg/tissue) to the administered dose (mg/individual)) in the skin and liver also significantly differed. The TTX accumulation ratio of the skin (11.1-38.6%) declined when the dose of administered TTX increased, while that of the liver (18.4- 21.3%) almost remained constant. Therefore, it is possible that the TTX accumulation mechanisms in these two organs differ, and the higher the intake of TTX, the higher TTX accumulation ratio in the liver.
In Chapter IV, the maturation-associated changes in the TTX transfer/accumulation profiles of the ovary in wild T. pardalis was investigated. Twenty-two female individuals were collected at a specific location in Omura Bay, Nagasaki Prefecture, from November through December 2014, and then the maturation stage of those were separated to yolk vesicle stage (Yv), yolk globule stage (Yg)-1, -2, and -3 based on the ovary section. The TTX concentration in the tissues at each maturation stage was quantified. The TTX concentration in the ovary increased markedly from Yv to Yg-1, so was the TTX content in the ovary from Yg-
1 to Yg-3. On the other hand, 20 female individuals (February and March designed as the pre-spawning stage, and April and May as the post- spawning stage base on gonadosomatic index (GSI)) collected at the same place from February through May 2015 were investigated as well. In the post-spawning stage, the TTX concentration in the ovary were similar to that in the pre-spawning stage, but the TTX content of the ovary declined significantly while the TTX concentration of the liver increased rapidly.
The TTX distribution in the oocytes differed among those maturation stages, positive signals of TTX were observed in the nucleus and yolk vesicles in the oocytes at the yolk vesicle stage, mainly in the yolk globules at the yolk globule stage and in the egg membrane at the pre-spawning stage.
In Chapter V, the above results were comprehensively discussed.
Chapter I
Contrasting Toxin Selectivity between the Marine Pufferfish Takifugu pardalis and the Freshwater Pufferfish Pao suvattii
Marine pufferfish of the genus Takifugu, including Takifugu pardalis, contain the potent neurotoxin TTX as a main toxic component. On the other hand, small-sized freshwater pufferfish, including Pao suvattii (formerly known as Tetraodon suvattii), contain PSP as the major toxic component in their skin and ovary, and consumption of these fish occasionally causes food poisoning in Southeast Asian countries such as Thailand and Cambodia (Kungsuwan et al., 1997; Ngy et al., 2008). Marine pufferfish are thought to accumulate PSP via the food chain starting from PSP- producing dinoflagellates (Landsberg et al., 2006; Sato et al., 2000), while freshwater pufferfish are thought to accumulate PSP from PSP-producing cyanobacteria (Zaman et al., 1997). It is unclear, however, whether the marine Takifugu pufferfish can accumulate PSP equally to freshwater pufferfish or whether freshwater pufferfish can accumulate TTX equally to marine Takifugu pufferfish if the toxin supply in the food is sufficient. In this chapter, we administered TTX and/or PSP to artificially reared nontoxic specimens of T. pardalis and P. suvattii to clarify the differences in toxin selectivity between marine and freshwater pufferfish.
1. Materials and methods 1.1. Pufferfish specimens
Artificially reared nontoxic 12-month-old T. pardalis (body length, 10.2 ± 0.5 cm; body weight, 36.7 ± 6.2 g; n = 30 (11 females and 19 males)) and P. suvattii (body length, 8.3 ± 0.4 cm; body weight, 28.0 ± 3.1 g; n = 8 (5 females and 3 males)) were used for the toxin administration experiments, as described below. The GSI (100 x gonad weight/body weight) in T. pardalis was 0.29 ± 0.06 in females and 0.35 ± 0.16 in males, and that in P. suvattii was 9.6 ± 2.1 in females and 0.45 ± 0.16 in males.
1.2. Preparation of toxic feed homogenate
TTX extracted from the ovaries of wild T. rubripes and PSP extracted from the xanthid crab Zosimus aeneus were purified by solvent partitioning, activated charcoal treatment, and Bio-Gel P-2 (Bio-Rad Laboratories, Inc., Hercules, CA, USA) and Bio-Rex 70 (Bio-Rad Laboratories, Inc., Hercules, CA, USA) column chromatography according to the previously reported method (Arakawa et al, 1994), affording TTX (purity >60%), and dcSTX and STX (purity >80%) as essentially single components (content of 4- epiTTX in the TTX preparation, <2%). We administered dcSTX to T.
pardalis and STX to P. suvattii because the availability of STX was insufficient. An aqueous solution of TTX or dcSTX was mixed with artificial feed for marine juvenile fish (Otohime C2, Marubeni Nisshin
Feed Co., Ltd., Tokyo, Japan) at a ratio of 2/1 (v/w) and homogenized, and then feed homogenates containing either TTX or dcSTX (552 nmol/mL) were administered to T. pardalis. For P. suvattii, the feed homogenate was similarly prepared to contain a mixture of TTX and STX (192 nmol/mL each).
1.3. Toxin administration to T. pardalis
T. pardalis specimens were divided into three groups of 10 individuals—two TTX administration groups and one dcSTX administration group—and then maintained separately in three aerated 90- L tanks with artificial seawater at 25 oC. Each specimen was administered TTX- or dcSTX-containing feed homogenate (dose of toxin, 55.2 nmol/fish) by oral gavage and immediately returned to the tank. One TTX administration group and the dcSTX administration group were collected at 72 h. As the amount of TTX available was sufficient, a 24 h TTX administration group was also used to confirm the transition of the toxin distribution inside the body.
1.4. Toxin administration to P. suvattii
P. suvattii specimens were maintained in an aerated 60 L tank with dechlorinated tap water at 25 oC. Each specimen was administered the feed homogenate containing TTX and STX (dose of each toxin, 19.2 nmol/fish)
by oral gavage and immediately returned to the tank. Four specimens were randomly collected at 24 or 48 h after toxin administration, and toxin quantification was performed as described below to compare the distribution of each toxin.
1.5. Toxin quantification
The intestine, muscle, skin, liver, and gonads (testes/ovaries) were removed an extracted with 0.1 M HCl, passed through an HLC-DISK membrane filter (0.45 µm, Kanto Chemical Co., Inc., Tokyo, Japan), and submitted to liquid chromatography-tandem mass spectrometry (LC- MS/MS) for TTX and/or high-performance liquid chromatography with post-column fluorescence derivatization (HPLC-FLD) for PSP.
In the LC-MS/MS analysis, chromatography was carried out using an Alliance 2690 Separations Module (Waters, Milford, MA, USA) with a Mightysil RP-18 GP column (2.0 x 250 mm, particle size 5 µm, Kanto Chemical Co., Inc., Japan) and mobile phase comprising 30 mM heptafluorobutyric acid in 1 mM ammonium acetate buffer (pH 5.0) at a flow rate of 0.2 ml/min. The eluate was introduced into a Quattro microTM API detector (Waters) in which the TTX was ionized by positive-mode electrospray ionization with a desolvation temperature of 350 °C, source block temperature of 120 °C, and cone voltage of 50 V, and monitored at m/z 162 (for quantitative) and 302 (for qualitative) as product ions
(collision voltage 38 V) with m/z 320 as a precursor ion through a MassLynxTM NT operating system (Waters). The limit of detection (LOD) and limit of quantification (LOQ) of TTX was 0.0009 nmol/mL (0.003 nmol/g tissue; S/N = 3) and 0.003 nmol/mL (0.009 nmol/g tissue; S/N = 10), respectively.
HPLC-FLD was performed using an Alliance 2690 Separations Module with a LiChroCART Superspher RP18(e) column (4.6 x 250 mm, particle size 4 µm, Merck, Germany) and a mobile phase comprising 2 mM heptanesulfonic acid in 4% acetonitrile-30 mM ammonium phosphate buffer (pH 7.3) at a flow rate of 0.8 ml/min. The eluate was continuously mixed with 50 mM periodic acid and 0.2 M KOH containing 1 M ammonium formate and 50% formamide, and heated at 65 °C. The formation of fluorophores was monitored at 392 nm with 336 nm excitation.
The LOD of both dcSTX and STX was 0.007 nmol/mL (0.02 nmol/g tissue;
S/N = 3) and the LOQ of both dcSTX and STX was 0.02 nmol/mL (0.06 nmol/g tissue; S/N = 10).
2. Results and discussion
The toxin concentration in the examined organs of T. pardalis and P.
suvattii at 24 and 48 or 72 h after TTX and/or PSP administration is shown in Fig. 1 and Tables 1 and 2. In T. pardalis, TTX administered into the intestine by oral gavage was taken up into the body and transferred mainly
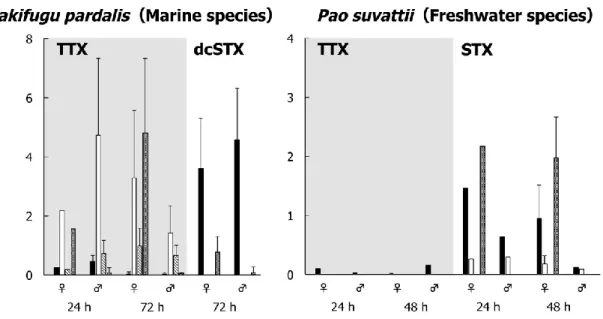
Fig. 1. Toxin concentration in different organs of T. pardalis (left) and P.
suvattii (right) at 24 and 48 or 72 h after TTX and/or PSP (dcSTX or STX) administration. Data are shown as means (columns) and SDs (error bars).
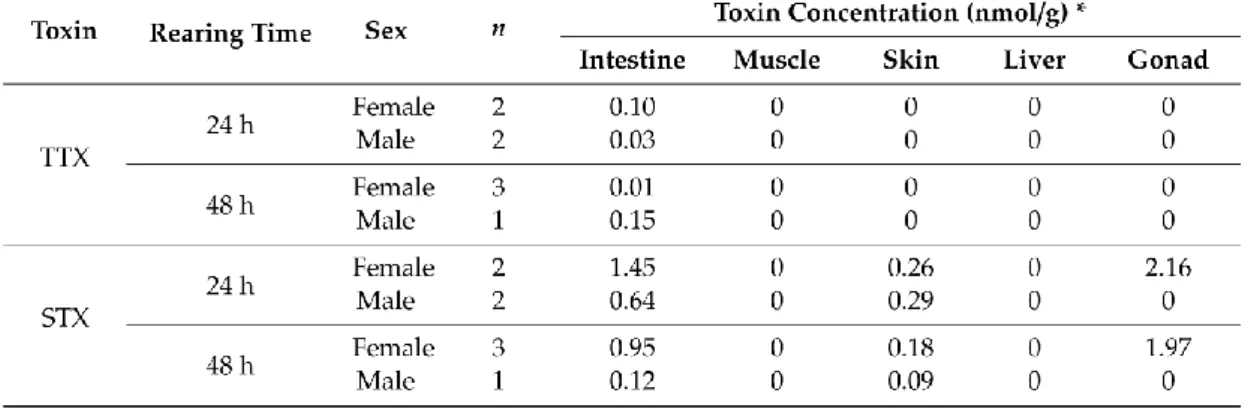
Table 1. Toxin concentration (mean value) in different organs of T. pardalis at 24 and/or 72 h after TTX or dcSTX administration.
Table 2. Toxin concentration (mean value) in different organs of P. suvattii at 24 and 48 h after TTX + STX administration.
to the skin, ovary, and liver. The TTX concentration was the highest in the skin at 24 h and in the ovary at 72 h, and the TTX concentration in the liver was generally lower than that in the ovary and skin. At 24 h, a low concentration of TTX remained in the intestine, and at 72 h, the concentration in the intestine further decreased to a trace level. On the other hand, the dcSTX concentration in the intestine remained high even at 72 h and was detected at low concentrations only in the gonads among the other organs examined. In P. suvattii, in strong contrast to T. pardalis, no TTX was detected in any organs other than the intestine at 24 and 48 h, while STX was taken up into the body and transferred only to the ovary and skin.
Interestingly, a much higher concentration of STX than TTX remained in the intestine, similar to T. pardalis.
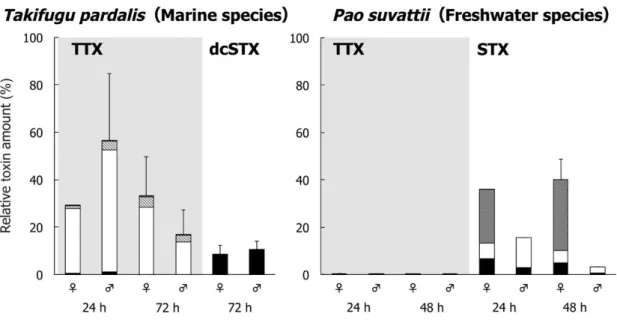
The relative toxin amount (% of the administered toxin) in each organ of T. pardalis and P. suvattii is shown in Fig. 2 and Tables 3 and 4. In T.
pardalis, 16.6–55.1% of the administered TTX was absorbed and retained in the body at 24 and 72 h, with most (82.7–95.1% of the “Total”) distributed in the skin and the rest distributed mainly in the liver. At 72 h, little toxin (~0.1% of the administered toxin) remained in the intestine. On the other hand, dcSTX was not retained in the rest of the body except for in the gonads, in which little toxin accumulated (0.2% in females and 0.01% in males), and 8.4–10.3% of the dose remained in the intestine. In strong contrast, in P. suvattii, little TTX (0.03–0.5%) remained in the body
Fig. 2. Relative toxin amount (% of the administered toxin) in different organs of T. pardalis (left) and P. suvattii (right) at 24 and 48 or 72 h after TTX and/or PSP administration. Data are shown as means (columns) and SDs (error bars).
Table. 3. Relative toxin amount (% of the administered toxin, mean value) in different organs of T. pardalis at 24 and/or 72 h after TTX or dcSTX administration.
Table. 4. Relative toxin amount (% of the administered toxin, mean value) in different organs of P. suvattii at 24 and 48 h after TTX + STX administration.
at 24 and 48 h, whereas STX (29.3–35.0% in females and 2.7–12.6% in males) was absorbed by the body and retained in the ovary and skin. The intestine contained 0.6–6.8% of the administered dose.
It is strongly indicated that the marine species T. pardalis and the freshwater species P. suvattii are endowed with contrasting TTX/PSP selectivity. Due to the scarcity of PSP preparations and of artificially reared pufferfish specimens, or as a matter of practical convenience, the two toxin administration experiments conducted in the present study differed with respect to the experimental conditions, such as the PSP components, dose, administration method (TTX and PSP administered alone or in combination), number of test fish, and rearing period, thereby preventing a quantitative comparison of the selectivity between species. Nevertheless, our findings clearly demonstrate for the first time that T. pardalis, which naturally harbors TTX, selectively accumulates TTX, and P. suvattii, which naturally harbors PSP, selectively accumulates PSP. Ngy et al. (2008) intramuscularly administered TTX and PSP into artificially reared specimens of the freshwater pufferfish Leiodon (formerly known as Tetraodon) tergidus and found that PSP rapidly transferred from the muscle to the skin, where it accumulated. On the other hand, all the fish administered TTX died within 3–4 h, and approximately half the TTX dose remained in the muscles of the dead fish. Although the toxin administration method differed from that in the present study, L. tergidus is considered to
have similar toxin selectivity as P. suvattii. In addition, this finding indicates that freshwater pufferfish are not very resistant to TTX. Marine pufferfish have much stronger resistance to TTX than do general fish, but their resistance to PSP is not very strong (Saito et al, 1984; Saito et al, 1985;
Saito et al, 1989). Thus, toxin selectivity could be closely related to toxin resistance.
Chapter II
Evaluation of the tetrodotoxin uptake ability of pufferfish Takifugu rubripes tissues according to age using an in vitro tissue slice
incubation method
Distribution of TTX inside the pufferfish body varies depending on the developmental stage. To understand the mechanism of the age-dependent changes, most of the previous studies have focused on the TTX uptake ability of the liver. Nagashima et al. (2003) and Matsumoto et al. (2005, 2007), using an in vitro tissue slice incubation method, demonstrated that liver tissues of marine Takifugu pufferfish, unlike those of general marine fish, take up a considerable amount of TTX. They did not consider the TTX uptake ability of the intestine, however, which serves as the first barrier when TTX in the food organisms is absorbed into the pufferfish body, or of the skin, which, like the liver, is a main transfer destination of TTX absorbed into the body. In this chapter, to clarify the mechanisms involved in the unique kinetics of TTX in the pufferfish body and growth-associated changes, firstly whether the in vitro tissue slice incubation method is applicable for evaluating the TTX uptake ability of not only the liver but also the skin and intestine, was investigated, and then the TTX uptake ability of these tissues between young (8 months old) and adult (20 months old) Takifugu rubripes was compared. Moreover, to estimate the TTX
uptake pathway in each tissue, an immunohistochemical technique (Tanu et al., 2002) was used to observe temporal changes in the intra-tissue micro-distribution of TTX during incubation.
Section 1
TTX accumulation profiles of tissue slices after in vitro incubation
To investigate whether the in vitro tissue slice incubation method is applicable for evaluating the TTX uptake ability of various tissues, I applied the liver, skin and intestine of artificial adult T. rubripes for the in vitro incubation experiment, and then similar experiments were conducted for young individuals and additional adults.
1. Materials and methods 1.1. Pufferfish specimens
Non-toxic cultured young (8 months old; body length, 13.5 ± 0.5 cm;
body weight, 80.0 ± 6.1 g; n=3) and adult (20 months old; body length, 28.4 ± 0.8 cm; body weight, 743 ± 61 g; n=3) T. rubripes were used for the tissue slice incubation experiments described below.
1.2. TTX preparation
TTX extracted from the ovaries and livers of T. pardalis, and purified by solvent partitioning, activated charcoal treatment, and Bio-Gel P-2 (Bio-Rad Laboratories, Hercules, CA, USA) column chromatography according to a previously reported method (Arakawa et al., 1994) was used for the tissue slice incubation experiments. Crystalline TTX (Nacalai
Tesque, Inc., Kyoto, Japan) was used as a standard for the TTX quantification analysis described below.
1.3. Tissue slice incubation experiments
The liver, skin and intestine were collected from one of the adult fish, and an incubation experiment was conducted according to the method of Matsumoto et al. (2007). Briefly, 12 tissue slices (8 mm in diameter, ~1 mm in thickness) were prepared from the liver, dorsal skin, and intestine, which was first sliced longitudinally to form a sheet. Each slice was incubated with a 1.5 ml of incubation buffer (160 mM NaCl, 4.8 mM KCl, 23.8 mM NaHCO3, 0.96 mM KH2PO4, 1.5 mM CaCl2, 1.2 mM MgSO4, 12.5 mM HEPES, and 5.0 mM D-glucose; adjusted to pH 7.4 with NaOH solution) containing 25 µg/mL TTX in a 15-mL plastic tube aerated with O2 and CO2 at a 9:1 ratio at 20 °C for a maximum of 48 h. During the incubation, 3 slices of each tissue were collected at 1, 8, 24, and 48 h, washed with neutral phosphate buffer (0.15 M NaCl and 0.01 M Na2HPO4; adjusted to pH 7.0 with 0.15 M NaCl and 0.01 M NaH2PO4), and weighed.
To investigate whether the TTX uptake ability of each tissue differed according to the age of the fish, three tissue slices were similarly prepared from the liver, skin, and intestine of the three young fish and the remaining two adult fish, and an incubation experiment was conducted for 8 h.
1.4. TTX quantification
TTX was quantified by LC-MS/MS analysis according to the method described in Chapter I 1.5. Toxin quantification.
1.5. Statistical analysis
Statistical analysis was performed by combining the data from the 8-h incubation in the first incubation experiment and the data from the second incubation experiment. Considering that it is difficult to compare the toxin uptake ability between different tissues in this experiment, Student’s t-test was performed for each tissue between young fish and adult fish using the mean TTX content of each individual (mean TTX content of the 3 slices).
2. Results and discussion
Changes in the TTX content of liver, skin, and intestine slices of adult T. rubripes during the incubation are shown in Fig. 3. The TTX content temporally increased in all tissues. The TTX content of the liver was 4.7 ± 1.7, 9.3 ± 2.5, 10.7 ± 0.5, and 13.6 ± 1.2 μg/g at 1, 8, 24, and 48 h of incubation, respectively, and was highest among the three tissues at 1 h, but the content of the skin and intestine exceeded that of the liver at 8 h and thereafter. The TTX content of the intestine was highest at 8 and 24 h (12.1 ± 1.7 and 17.3 ± 1.3 μg/g, respectively), and that of the skin was highest at 48 h (18.8 ± 1.4 μg/g).
Fig. 3. Change in TTX content of the liver, skin, and intestine tissue slices (n=4) from one adult T. rubripes individual during incubation for 48 h. The bars indicate the standard deviation.
The TTX content of the tissue slices of the young and adult T. rubripes after 8 h of incubation is shown in Figs. 4. In the young fish and adult fish, the TTX content was 12.6 ± 1.2 and 11.0 ± 1.6 μg/g in the liver, 26.9 ± 2.7 and 11.6 ± 1.7 μg/g in the skin, and 15.5 ± 3.0 μg/g and 12.7 ± 4.8 μg/g in the intestine, respectively. The TTX content in the liver and intestine did not differ significantly between the young fish and adult fish, while it was significantly higher in the skin of the young fish compared with the adult fish (p<0.05).
Nagashima et al. (2003) reported that when the liver slices of several general fish species were incubated in the same TTX concentration as used in the present study (25 µg/mL), ~3-4 µg/g TTX was detected at 0.5 h, but the amount changed little thereafter. In contrast, in the liver slices of T.
rubripes, the TTX content increased over time, and reached up to ~12 µg/g at 24 h and ~15 µg/g at 48 h. After that, the TTX content did not decrease even when incubated in incubation buffer containing no TTX. These findings led them to conclude that the liver tissue of T. rubripes is endowed with high TTX uptake ability. In the present study, TTX was taken up into the liver slices at nearly the same level at the same incubation times (~11 µg/g at 24 h, ~14 µg/g at 48 h), confirming the high reproducibility of this experimental system. The TTX content in the skin and intestine slices was comparable to or slightly higher than that in the liver slices, with a similar transition pattern between the three tissue types. The tissue structures and
Fig. 4. Difference in TTX content of the liver (upper), skin (middle), and intestine (lower) tissue slices between young and adult T. rubripes after incubation for 8 h. Asterisk indicates significant difference (t-test, p < 0.05)
0 10 20
Young Adult
TT X c ontent ( μ g/g)
Liver
0 10 20 30
Young Adult
TT X c ontent ( μ g/g)
Skin
0 10 20
Young Adult
TT X c ontent ( μ g/g)
Intestine
properties differ between the liver and skin/intestine, and it is unlikely that such a liver-like TTX uptake profile was caused by mere physical diffusion of TTX. Therefore, we concluded that the tissue slice incubation method can be applied for evaluating the TTX uptake ability of the skin and intestine, and that the TTX uptake ability of the skin and intestine of T.
rubripes is similar to that of the liver. In future studies, the TTX uptake ability of the skin and intestine should be evaluated in non-toxic pufferfish and in general fish as well.
Wild adult T. rubripes accumulate high levels of TTX in the liver and ovary, but the skin, muscle, and testis are generally non-toxic (Noguchi and Arakawa, 2008). According to studies by Ikeda (2009) and Tatsuno (2012), however, the TTX content in the skin accounts for more than 90% of the total TTX content in wild young T. rubripes (small-sized fish with a body weight of 20.9 ± 3.9 g). Medium-sized fish (body weight 261 ± 66 g) have a lower TTX ratio in the skin than small sized fish, and the TTX content in the liver accounts for 15%-86%. Therefore, it is presumed that the skin is rather the main toxin accumulation tissue in young T. rubripes, but the liver becomes the main toxin repository as the fish grows. Similarly, in a rearing experiment in which cultured young (under 1 year old) and adult (under 2 years old) T. rubripes were fed a TTX-containing diet for 60 days, the TTX accumulation rate in the skin was higher in the young fish than in the adult fish (Honda et al., 2005). When TTX was administered intramuscularly to
cultured young T. rubripes, most of the toxin was transported to the skin where it accumulated (Ikeda et al., 2009). In a previous study (Tatsuno et al., 2013a), the TTX administered to T. rubripes by oral gavage was transferred mainly to the skin in 6- month-old fish, and to the liver in 15- month-old fish, which have a more developed liver. In T. rubripes, the TTX taken up into the body is transferred mainly to the skin in younger fish, but as the age increases and the liver matures, the ratio of toxin transferred/accumulated in the liver gradually increases. Recently, Kiriake et al. (2016) conducted a TTX uptake experiment using liver tissue slices from 4-month-old and 18-month-old nontoxic cultured T. rubripes, and claimed that there was no difference between TTX uptake amounts between the two ages. In the present study, the TTX uptake ability is higher in the skin of young fish than in the skin of adult fish. it is highly possible that the TTX uptake ability of the skin is involved with the growth- associated change of the TTX distribution in the T. rubripes.
Section 2
Temporal change in the microdistribution of TTX in tissue slices after in vitro incubation
To estimate the TTX uptake pathway in the liver, skin, and intestine of T. rupripes, the tissue slices after in vitro incubation were used for immunohistochemical staining.
1. Materials and methods 1.1. Pufferfish specimens
A non-toxic cultured young T. rubripes (8 months old; body length, 13.6 cm; body weight, 82.4 g) and was used for the tissue slice incubation experiments described below.
1.2. Tissue slice incubation experiment
By the method described in Section 1, 6 tissue slices were prepared from the liver, skin, and intestine of the young T. rubripes, respectively, and incubated with incubation buffer containing 25 µg/mL TTX for a maximum of 8 h. During the incubation, 2 slices of each tissue were collected at 0.5, 2, and 8 h, and submitted to immunohistochemistry as described below.
1.3. Immunohistochemical observation
Tissue sections (6-µm thick) were prepared from the incubated tissue slices by conventional histologic procedures, and immunostained according to the previously reported method (Gao et al., 2018; Tanu et al., 2002). Briefly, the sections were successively treated with 10% H2O2 in water and 25% goat serum in 0.01 M phosphate-buffered saline (Iatron Lab.
Inc., South Bend, IN, USA), and then incubated with a monoclonal anti- TTX antibody (Kawatsu et al., 1997), followed by a polymer, EnVision+
(Dako North America Inc., Carpinteria, CA, USA) for 60 min. For a negative control, mouse IgG (Vector Laboratories Inc., Burlingame, CA, USA) was used instead of the anti-TTX antibody. After treating the sections with 0.017% 3,3’-diaminobenzidine tetrahydrochloride (Wako Pure Chemical Industries Ltd., Tokyo, Japan) substrate solution in 0.01 M phosphate-buffered saline, they were counter-stained with Mayer's hematoxylin (Merck, Darmstadt, Germany), and observed under an optical microscope (BZ-X700, Keyence Corp., Osaka, Japan). TTX-positive signals were indicated by a brown color.
2. Results and discussion
Changes in the micro-distribution of TTX in the liver, skin, and intestine tissue slices during the incubation are shown in Figs. 5-7. In the liver, weak TTX-positive signals were observed at the pancreatic exocrine
Fig. 5. Immunohistologic observation of the liver tissue slices after in vitro incubation. Positive immunoreaction was visualized as a brown color.
Alphabetical letters h and p indicate hepatic parenchymal cell, and pancreatic exocrine cell, respectively. Scale bars indicate 50 µm.
Fig. 6. Immunohistologic observation of the skin tissue slices after in vitro incubation. Positive immunoreaction was visualized as a brown color.
Alphabetical letters ed, d, and b indicates epidermis layer, dermis layer, and basal cells. Scale bars indicate 50 µm.
Fig. 7. Immunohistologic observation of the intestine tissue slices after in vitro incubation. Positive immunoreaction was visualized as a brown color.
Alphabetical letters et, l, and m indicate epithelial cells, lamina proprial and muscular layer, respectively. Scale bars indicate 50 µm.
cells at 0.5 h of incubation, and the signal became stronger in the pancreatic exocrine cells and spread to surrounding hepatic parenchymal cells at 2 h.
At 8 h, the whole section was stained brown. In the skin, weak positive signals were observed at the connective tissue on the muscle side (data not shown), but the epidermis and dermis layer were not stained at 0.5 h.
Although there was no obvious change between 0.5 h and 2 h, strong TTX- positive signals were confirmed at basal cells between the epidermis and dermis at 8 h. In the intestine, weak positive signals were observed at the epithelial cells and lamina propria of the intestinal villi at 0.5 h, then the signals became stronger at 2 h and extended to the muscular layer at 8 h.
From the temporal change in the micro-distribution of TTX in each tissue slice, the TTX uptake pathway in each tissue can be estimated to some extent. In the liver, it seems that TTX is first taken up into pancreatic exocrine cells, and then spreads to hepatic parenchymal cells. In the skin, TTX seems to be first taken up into the connective tissues, and is then transferred to and accumulates in the basal cells. Many pufferfish have secretory glands or secretory cells (sacciform cells) in the skin (Itoi et al., 2012; Kodama et al., 1986; Mahmud et al., 2003a,b; Tanu et al., 2002) and release TTX from the skin in response to external stimuli (Kodama et al., 1985; Saito et al., 1985), but in T. rubripes, no glandular structure is observed in the skin, and TTX-positive signals are found only in the basal cells (Ikeda et al., 2009; Okita et al., 2013). Therefore, it is highly likely
that the basal cell properties are involved in the difference in the TTX uptake ability of the skin between young and adult fish, consistent with the findings of the present study. In the intestine, TTX was assumed to be taken up from the epithelial cells of the villi into the lamina propria, and gradually transferred to the muscle layer. It is unclear, however, how such uptake of TTX by the intestine slices is involved in intestinal TTX absorption in vivo. This point requires further clarification to apply the TTX uptake ability of the intestine slices as an index of TTX absorption ability or TTX selectivity in the intestine.
Chapter III
Profile differences in tetrodotoxin transfer to skin and liver in the pufferfish Takifugu rubripes
Tetrodotoxin accumulates mainly in the skin, liver, and ovary, and the muscle and testis are nontoxic in many species of marine pufferfish of the genus Takifugu (Tani, 1945). To clarify the transfer/accumulation mechanisms, various TTX administration experiments have been conducted using nontoxic specimens reared from eggs using nontoxic feeds. Those results revealed that the administered TTX is transferred first to the liver and then to the skin via blood circulation, but toxin transfer to the gonads differs greatly between males and females with the toxin transferring to and accumulating in only the ovary. According to the results from Chapter II, it is possible that the molecular mechanisms involved in the transfer/accumulation of TTX differ between the two main TTX- accumulating tissues, the skin and liver, but few studies have focused on this mechanism. In this chapter, to provide more insight on this mechanism, TTX was intramuscularly administered at different doses to nontoxic T.
rubripes specimens, and the transfer profiles of TTX to the skin and liver were investigated.
Section 1
Transfer profiles of TTX to the skin and liver
To investigate the differences in accumulation mechanism between the skin and liver, TTX was intramuscularly administered at different doses to nontoxic T. rubripes specimens, then the TTX content of the skin and liver were quantified.
1. Materials and methods 1.1. Pufferfish specimens
Nontoxic cultured specimens of T. rubripes (8-month-old, body length 16.0 ± 1.2 cm, body weight 142.4 ± 23.7 g, GSI 0.06-0.23, n = 17), which had been reared with TTX-free diet since hatching, were used as test fish for the TTX administration experiment as described below.
1.2. Preparation of TTX solution
A TTX standard (Wako, purity >90%) was dissolved in 1.35% NaCl solution at different concentrations (0.3, 1.0, 3.0 mg/mL), and were used in the following experiments.
1.3. TTX administration experiment
The test fish were divided into three groups, Low dose (LD; n = 6),
Medium dose (MD; n = 6), and High dose (HD; n = 5), and each group was reared in a 200-L aerated tank. The TTX dose for each group was set at 30, 100, and 300 μg/individual (administration concentration 0.3, 1.0, and 3.0 mg/mL), respectively, referring to the minimum lethal intraperitoneal-dose of TTX to cultured T. rubripes, 3.3-5.5 μg/g body weight, (~500-800 μg/fish) (Saito et al., 1984, 1985a).
The absorption rate of TTX in the pufferfish digestive tract changes according to the administration concentration (Matsumoto et al., 2008a).
To avoid this influence, intramuscular administration was used rather than oral gavage administration. The test fish of each group were injected with 0.1 mL TTX solution (30, 100, or 300 μg/individual) into the dorsal muscle, returned to the tank, and then collected 24 h after toxin administration. The skin, liver, and muscle were dissected from each fish, and toxin quantification each tissue were performed as described below.
1.4. TTX quantification
TTX from each tissue was extracted with 0.1% acetic acid in a 100 °C water bath (Japan Food Hygiene Association, 2005), and the extract, after passing through an HLC-DISK membrane filter (0.45 mm, Kanto Chemical Co., Inc., Japan) and appropriately diluting with pure water, was subjected to a liquid chromatography/mass spectrometry (LC/MS) analysis according to the method of Nakashima et al. (2004). Namely, LC/MS was
carried out on an alliance LC/MS system (Waters) equipped with a ZsprayTM MS 2000 detector. A Mightysil RP-18 GP column (2.0 x 250 mm, Kanto Chemical) was used with 30 mmol/l heptafluorobutyric acid in 1 mmol/l ammonium acetate buffer (pH 5.0) for the mobile phase.
1.5. Statistical analysis
General linearized models were used to determine how the dose and its interaction with the tissue (i.e., liver or skin) influenced the TTX concentration and the TTX accumulation ratio. A Gaussian distribution and an identity link function were applied in the TTX concentration analysis and a binomial distribution with a logit function was used to model the TTX accumulation ratio. Models were fitted with R version 3.3.0 (R Development Core Team, 2016), and a likelihood ratio test was used to determine the statistical significance of the slopes among the liver and skin.
2. Results and discussion
The test fish in HD showed temporary paralysis just after TTX injection, and one died. The remaining 4 fish, however, recovered, and we observed no other abnormal signs thereafter. In all groups, TTX was detected in the skin and liver, but not in the muscle. Relationships between the dose and TTX concentration in the skin and liver are shown in Fig. 8.
In both tissues, the TTX concentration significantly increased with an
Fig. 8. TTX concentration (μg/g) of skin (A) and liver (B) as a function of administered dose; 30 (n = 6), 100 (n = 6), and 300 (n = 4) μg/individual.
Data are shown as the mean (point) and SD (error bar) for each dose. Line and gray zone indicate the expected values of the Gaussian generalized linear model and the 95% confidence interval, respectively.
increase in the dose, but the slope coefficients differed significantly (skin, 0.0044 ± 0.002 (estimate ± 1 standard error); liver, 0.0208 ± 0.002, p <
0.0001). Thus, the TTX concentration in the liver increased much more quickly than that in the skin as dose increased.
Relationships between the dose and the TTX accumulation ratio in the skin and liver are shown in Fig. 9. Binomial general linearized models revealed significant differences in the slope coefficient (skin, -0.0063
±0.0007; liver, 0.0005 ± 0.006, p < 0.0001). A slope coefficient of essentially 0 for the liver indicates that TTX dose had no effect on the TTX accumulation ratio in the liver.
As described above, when TTX was administered intramuscularly to immature specimens of T. rubripes at doses of 30, 100, or 300 μg/individual, the toxin transfer profile after 24 h differed greatly between the skin and liver. The toxin concentration of the liver was almost equivalent to that of the skin at the low dose (30 μg/ individual), but reached 3-fold that of the skin at the high dose (300 μg/individual).
Therefore, it is presumed that the more TTX ingested by T. rubripes, the higher the accumulated toxin ratio in the liver. Although TTX in the present study was administered through a route that does not naturally occur, Honda et al. (2005) reported that when cultured T. rubripes are reared with TTX-containing diets for 60 days, they accumulate a small amount of toxin in the skin and liver at low doses, and a large amount of toxin in the liver
Fig. 9. TTX accumulation ratio (%) of skin (A) and liver (B) as a function of administered dose; 30 (n = 6), 100 (n = 6), and 300 (n = 4) μg/individual.
Data are shown as the mean (point) and SD (error bar) for each dose. Line and gray zone indicate the expected values of the binomial generalized linear model and the 95% confidence interval, respectively.
at high doses, suggesting that a similar phenomenon occurs in the natural environment.
Section 2
Immunohistochemical observation of the skin and liver
To observe the micro-distribution of TTX in the skin and liver after administration at different doses from Section 1, immunohistochemical staining was conducted.
1. Materials and methods 1.1. Materials
A part of the skin and liver of each test fish in Section 1 was submitted to the following immunohistochemical observation.
1.2. Immunohistochemical observation
Representative parts of the skin and liver were fixed in 10% neutrally buffered formalin for 7 days, embedded in paraffin, and then sectioned at 3-mm thickness using a microtome. The obtained sections were immunostained as described in 1.3. Immunohistochemical observation, Section 2, Chapter II, and observed under a light microscope.
1.3. Results and discussion
Positive immunoreactions for TTX (brown color) were observed in both the skin and liver. TTX localization in representative skin sections from each group are shown in Fig. 10. In LD, TTX-positive signals were
Fig. 10. Immunohistologic observation of the skin in each group. TTX was visualized as a brown color. Arrow and (a) indicate basal cell and epidermis layer, respectively. Scale bars, 25 μm.
observed in basal cells, as described in previous studies (Ikeda et al., 2009;
Okita et al., 2013). As the dose increased, however, TTX-positive signals were also observed in the epidermis layer. TTX localization in the representative liver sections from each group are shown in Fig. 11. TTX- positive signals were rarely observed in LD and MD, but they were distributed over the whole liver tissue in HD, particularly at the pancreatic exocrine cells as stronger immunoreactions.
These results revealed differences in TTX localization according to the administered dose. Many pufferfish have secretory glands or secretory cells (sacciform cells) in the skin (Kodama et al., 1986; Tanu et al., 2002;
Mahmud et al., 2003a, b; Itoi et al., 2012), and external stimuli induce the release TTX from the skin (Kodama et al., 1985; Saito et al., 1985b). In T.
rubripes, no secretory glands or gland-like structures have been observed, and the positive immunoreactions for TTX are localized only at the basal cells along the basal membrane (Ikeda et al., 2009; Okita et al., 2013).
However, cultured T. rubripes fed with toxic pufferfish livers released a considerable amount of TTX from the skin with a mild external stimulus (Saito et al., 1985b). In addition, Itoi et al. (2014) observed juveniles of generally nontoxic fish that ingest pufferfish larvae (T. rubripes as well as T. niphobles) and then promptly spit them out, and presumed that the TTX transferred from the mother works to repel predators, based on the findings that TTX was primarily localized on the body surface of the larvae.
Fig. 11. Immunohistologic observation of the liver in each group. Arrow and arrow head indicate hepatic parenchymal cell, and pancreatic exocrine cell, respectively. Scale bars, 25 mm.
Although the mechanism remains to be clarified, T. ruburipes are considered to release TTX from the skin, despite that they have no gland structure in the skin. In the skin of LD, TTX-positive signals were observed in basal cells as previously described (Ikeda et al., 2009; Okita et al., 2013).
In contrast, in the MD and HD the TTX-positive signals were not only observed in basal cells but were also spread over the epidermis layer. This may because the time from TTX injection to fish collection was shorter, and the dose was higher in the present study than in the previous reports.
Pufferfish are endowed with high resistance to TTX, but can die when a large amount of TTX is administered (Saito et al., 1984, 1985a). In fact, paralysis occurred after administration and one fish died in the HD group.
Therefore, it is possible that pufferfish eliminate part of the TTX taken up into the body via the skin to reduce the TTX load to the body just after administration.
Chapter 4
Maturation-associated changes in internal distribution and intra- ovarian microdistribution of tetrodotoxin in the pufferfish Takifugu
pardalis
Maturation has been proved to be a significant factor to the TTX distribution inside the pufferfish body. Ikeda et al. (2010) investigated seasonal changes in tissue toxicity using wild specimens of the pufferfish Takifugu flavipterus, and found that liver and skin toxicity is high during the “ordinary period” (i.e., the months outside of the maturation and spawning periods), but in the maturation period during which the GSI increases, liver toxicity declines and ovary toxicity increases. A similar phenomenon is observed in Takifugu alboplumbeus (Itoi et al. 2016), suggesting that the TTX absorbed from toxic food organisms into the female pufferfish body is actively transported and accumulates in the ovary through its development during the maturation period. On the other hand, an immunohistochemical technique suggested that the micro-distribution of TTX in the pufferfish ovary changes with ovarian maturation (Itoi et al.
2012; Mahmud et al. 2003). In this chapter, to clarify these points, we collected wild specimens of Takifugu pardalis during the maturation period, and investigated changes in the internal distribution and intra-ovarian micro-distribution of TTX following oocyte maturation or spawning.
Section 1
Changes in the toxin distribution with ovary maturation
To clarify the maturation-associated accumulation profile of TTX in the pufferfish T. pardalis, female specimens were separated into each maturation stage based on the histology of ovarian sections, and then TTX quantification in each tissue in each maturation stage, as well as observation of the micro-distribution of TTX in the ovary was conducted.
1. Materials and methods 1.1. Pufferfish specimens
From November through December 2014, 22 female and 9 male specimens (designated Group I) of T. pardalis (Table 5) were collected in Omura Bay, Nagasaki Prefecture, Japan (Fig. 12). They were transported to the laboratory at Nagasaki University, and the skin, muscle, liver, and gonads were dissected out. A part of each ovary was used for histologic and immunohistochemical observations as described below, and the remainder of the ovary and the other tissues were frozen and kept below - 30 0C until TTX quantification.
1.2. Gonadosomatic index (GSI)
The GSI of each specimen was calculated from its gonad weight (GW)
Table. 5. Specification of T. pardalis specimens.
Fig. 12. Map showing the collection site of T. pardalis specimens.
and body weight (BW) using the following equation: GSI = 100 x GW/BW.
1.3. Histologic observation of the ovary
The Ovary sections were prepared according to conventional histologic procedures. Briefly, a tiny block from the ovary of each specimen fixed in 10% neutrally buffered formalin for 1 week and decalcified in a 5%
ethylenediaminetet-raacetic acid solution for 3 days was dehydrated through an ascending series of ethanol (70–100%), cleared in xylene, and embedded in paraffin. The embedded ovary was sectioned with a microtome at a thickness of 3 µm, and each section was deparaffinized in xylene, rehydrated through a descending ethanol series (100–70%), and then rinsed with water. The sections were stained with hematoxylin-eosin, and observed under a light microscope.
1.4. Immunohistochemical observation
A representative section prepared for each ovary as described above was immunostained using the same method as described in 1.3.
Immunohistochemical observation, Section 2, Chapter II, and observed under a light microscope.
1.5. TTX quantification
The method described in Chapter I was used.
1.6. Statistical analysis
Statistical analyses were performed using R version 3.2.1 (R Development Core Team 2015). Analysis of variance (ANOVA) was used to compare GSI, as well as TTX concentration and TTX amount in each tissue among the different maturation stages.
2. Results and discussion
In the T. pardalis specimens, the oocytes had begun to mature (yolk accumulation) in all the ovaries, where not only immature oocytes in the perinucleolus stage, but also oocytes in the yolk vesicle stage and/or yolk globule stage were observed. The maturation stages of the ovaries, however, differed among individuals. Individuals in which the most mature oocytes in the ovary were at the yolk vesicle stage were designated as yolk vesicle stage (Yv; n = 3), and those in which the most mature oocytes were in the yolk globule stage were designated as yolk globule stage (Yg). Among those in the yolk globule stage, individuals in which the mean cell diameter of the largest 10 oocytes (the diameter of 20 oocytes per individual was measured, and the largest 10 values were selected and averaged) was less than 400 µm, 400–500 µm, and more than 500 µm were further designated as Yg-1 (n = 3), Yg-2 (n = 10), and Yg-3 (n = 6), respectively (Fig. 13).
The GSI of the female specimens at each maturation stage and of the male specimens is shown in Fig.14. The GSI of the females, which was
Fig. 13. Light micrographs of a representative ovarian section from T.
pardalis specimens in different maturation stages; yolk vesicle stage (Yv), yolk globule stage (Yg)-1, Yg-2, and Yg-3.
Fig. 14. GSI of females at each maturation stage, along with the GSI of males. Data are shown as individual values (circles) and mean of each maturation stage or males (cross bars). a < b < c, p < 0.05.
0.2–11, increased significantly with maturation from Yg-1 to Yg-3 (p <
0.05). The GSI of the males (maturation stage was not evaluated) was 0.1–
24 with large individual differences, and the maximum value reached approximately two-fold that of the female specimens.
TTX concentration in the tissues at each maturation stage is shown in Fig. 15. The TTX concentration in the ovary (61–555 MU/g on average) was highest among the four tissues tested at any maturation stage in females, followed by the skin (30–97 MU/g) and liver (5.7–87 MU/g). The TTX concentration in the ovary increased markedly from Yv to Yg-1 (the difference between Yv and Yg-1–Yg-3 was significant, p < 0.05), and plateaued thereafter from Yg-1 to Yg-3. The TTX concentrations in the skin and liver showed no conspicuous change from Yv to Yg-2, although the concentration increased in Yg-3. TTX concentrations in the skin, muscle, and liver of male specimens were at almost the same level as those of female specimens from Yv to Yg-2, but little TTX was detected in the testis.
The TTX amount per tissue is shown in Fig. 16. In females, the TTX amount in the ovary largely increased with maturation from Yv (4.3 MU/individual on average) to Yg-3 (4330 MU/individual). The increase from Yv to Yg-2 was statistically significant (p < 0.05). TTX amounts in the skin, muscle, and liver were also highest at Yg-3. The skin had the highest value (~ 270 MU/individual) in the male specimens, which was the
Fig. 15. TTX concentration (MU/g) in tissues from females at each maturation stage, along with that of males. Data are shown as means (columns) and SD (error bars). a < b, p < 0.05.
Fig. 16. TTX amount (MU/individual) in tissues from females at each maturation stage, along with that in the males. Data are shown as means (columns) and SD (error bars). a < b < c, p < 0.05.
same level as that in females at Yg-1. During this period, the relative TTX amount in the ovary gradually increased, and finally the TTX content in the ovary accounted for approximately 70–80% of the total toxin in the fish.
Therefore, it is presumed that when maturation starts, most of the TTX taken up into the body (or that had previously accumulated in the liver) transfers to the ovary and accumulates in oocytes at the yolk vesicle stage.
Oocytes progressing to the yolk globule stage actively take up TTX during the process, and the TTX concentration of the cell greatly increases.
Furthermore, as the yolk globule oocytes grow (increase their weight) while continuing to actively take up TTX, the TTX amount increases with the TTX concentration remaining unchanged.
The relative TTX amount (ratio of TTX amount of each tissue to the total TTX amount of the individual) is shown in Fig. 17. In Yv females, 86
± 3% (mean ± SD) of the toxin in the body was distributed in the skin, and the ratio of the ovary was 7.5 ± 7.7%. As maturation progressed, however, Changes the ratio of the skin decreased, and the ratio of the ovaries increased, and in Yg-2 and Yg-3, the content in the ovaries accounted for 76±9 and 69±19% of the total TTX amount, respectively. In the male specimens, the ratio of the skin (77±32%) was the highest, indicating a similar internal toxin distribution as in the Yv females.
Immunohistologic observation of a representative oocyte in each maturation stage is shown in Fig. 18. In Yv, positive TTX reactions (brown
Fig. 17. Relative TTX amount (%) of tissues of females (n=22) in each maturation stage, along with that of the males (n=9).
Fig. 18. Immunohistologic observation of a representative oocyte in each maturation stage, where TTX was visualized as a brown color (upper). No positive reaction of TTX was observed in the negative control sections (lower). In Yv, yv and pn indicate oocytes in the yolk vesicle stage and the perinucleolus stage, respectively.
color) were observed in the nucleus in oocytes at the perinucleolus stage, and in the nucleus and yolk vesicles in the oocytes at the yolk vesicle stage.
In oocytes at the yolk globule stage in Yg-1, however, the positive TTX reactions in the nucleus faded and reactions were observed inside the whole cell except for in the oil globules. When the accumulation of yolk globules progressed in the Yg-2 oocytes, positive TTX reactions were observed in the yolk globules and cytoplasm near the egg membrane (Fig. 19). In the Yg-3 oocytes, the TTX localization was almost the same as that in Yg-2 oocytes. In Yg-2 and Yg-3 oocytes, we observed both positive reactions and no reaction in the nucleus within the same ovary (the rates for oocytes with a positive reaction was about 6%).
Fig. 19. Enlarged view of a representative oocyte in Yg-2 (left), where positive TTX reactions (brown color) were observed at the cytoplasm near the egg membrane (arrowhead). No positive reaction of TTX was observed in the negative control section (right).