Author(s)
竹田, 清
Citation
Issue Date
Text Version ETD
URL
http://hdl.handle.net/11094/35694
DOI
rights
Note
Osaka University Knowledge Archive : OUKA
Osaka University Knowledge Archive : OUKA
https://ir.library.osaka-u.ac.jp/
HYPOXIA ENHANCES UNILATERAL I~UNG IN.IBRY
BY INCREASING BLOOD FLOW TO TIIE INJURED LUNG
Kiyoshi Takeda, Mark J. Knapp, Walter G. Wolfe and James D. Crapo
Departments of Medicine and Surgery
Duke University Medical Center
Durham, North Carolina 27710
Abstract presented at the American Thoracic Society Meetings, May
11-14, 1986.
Dr. Knapp is a recipient of the Parker B. Francis grant.
Address Correspondence to:
James D. Crapo, M. D.
Box 3177
Duke University Medical Center
Durham, North Carolina 27710
(919) 684-6266
ABSTRACT
We hypothesized that in unilateral lung injury, bilateral hypoxic
ventilation would induce vasoconstriction in the normal lung, redirect
blood flow to the Injured lung, and cause enhanced edema formation.
Unilateral left lung injury was Induced by intrabronchial instillation of
1. 5 ml/kg of O .1 N HCl. After HCl injury, blood flow to the injured
left lung decreased progressively from . 70±. 04 to . 37 ±. 05 L/mln and
percent of flow to the injured left lung (QL/QT) decreased from
37. 7±2.2 to 23.6±2.2% at 240 min. Exposure to hypoxia (12% 0 2 ), for
three IO-minute episodes did not affect QL/QT in normal animals, but
after unilateral HCl injury, it caused blood flow to the injured left lung
to increase significantly. A concomitant decrease in blood flow occurred
to the non-injured right lung, resulting in a significant increase in
QL/QT. The enhanced blood flow to the injured lung was associated
with a significant increase in the wet-to-dry lung weight ratio in the
dependent regions of the injured lung. These findings demonstrate
that in unilateral HCl-induced lung injury, transient hypoxia can
enhance blood flow to the areas of injury and increase lung edema
formation.
Index Terms: Hypoxia, acid aspiration, unilateral lung injury, lung
INTRODUCTION
In experimental unUateral lung injury, blood flow to the injured
lung has been reported to decrease ( 1) . This physiological response ls
Important in maintaining arterial oxygenation by shunting blood flow
away from the injured to the normal lung. One of the mechanisms for
this response is postulated to be hypoxic pulmonary vasoconstriction
(HPV). HPV has been demonstrated to exist In areas of atelectasis as
well as during hypoxic ventilation in animals and humans (2,3). In
addition to maintaining arterial oxygenation, HPV may lessen the
sever-ity of lung Injury by reducing blood flow to the lung with Increased
capillary permeability. Most experimental models of acute lung injury,
including acid aspiration, involve endothelial damage and are
charac-terized by an enhanced permeability type of edema ( 4, 5) . Bishop et al.
reported that minoxidil, a potent HPV inhibitor, further increased the
production of extravascular lung water during the early phase of acute
lung injury in rabbits when it was given prior to oleic acid
adminis-tration (6). These findings suggest that when blood flow increases to
areas of Injury and increased capillary permeability, edema formation
in-creases. Clinically, patients with acute lung injury may be exposed to
transient hypoxia during procedures such as endotracheal suctioning
(7) and bronchoscopic examination (8). During the hypoxic period, the
pulmonary vasculature in the normal lung may elicit HPV and shunt
blood flow to injured areas of the lung, resulting in aggravation of
Injury.
The purposes of this study were 1) to observe serf al physiological
changes. _Including blood flow distribution, after unilateral lung injury;
ventilation on blood flow distribution; and 3) to measure the extent of edema formation In th~ injured lung following hypoxic ventilation by following wet-to-dry lung weight ratios (W/D).
ME'l'IIODS AND MATERIALS
Animal Preparation
Twenty adult, male mongrel dogs screened for heart worm infesta-tion and weighing 17 to 25 kg were anesthetized with Intravenous pen-tobarbltal sodium (30 mg/kg) and intubated with a cuffed endotracheal tube (9. 0 mm ID). Mechanical ventilation with 100% oxygen was main-tained with a Harvard animal ventilator to achieve a PaCO2 of 32 to 38
torr by adjusting the tidal volume (20 ml/kg) and respiratory rate
(10-13 cycles/min). Before sternotomy, 7.5 mg/kg of pentobarbltal
sodium and 0.15 mg/kg of pancuronium bromide were administered intra-venously. After this, anesthesia was maintained with hourly adminis-tration of pentobarbftal sodium (3 mg/kg) and pancuronlum bromide
(0.05 mg/kg). By using this regimen, no sign of light anesthesia was
observed. To minimize the effects of these drugs, they were given 45 minutes prior to measurements.
After induction of anesthesia, a balloon-tipped Swan-Ganz catheter (7 .5 Fr.) was advanced into the main pulmonary artery through the right external jugular vein to measure pulmonary arterial pressure (PAP). The position of the catheter was assured by direct palpation after thoracotomy. By cutdown of the right groin, a 14-G polyethylene catheter was placed in the femoral artery to measure arterial pressure (AP). Another catheter was advanced into the right atrium through the right femoral vein to measure right atrial pressure (RAP). After placement of catheters, the chest was opened via a median sternotomy and ventilation was maintained with an application of 5 cm H2O
for the purpose of left atrial pressure (LAP) measurement. A
segmen-tal branch of pulmonary > vein draining from each lower lobe was
canuu-la ted with a thin polyethylene tube. The tube was advanced from the
segmental branch into the lobar vein to obtain mixed pulmonary venous
blood. An electromagnetic flow probe ( 5 or 6 mm In diameter, Micron
Co.) with a nonocclusive zero function was placed around the left main
pulmonary artery, and the mean blood flow to the left lung was
re-corded on a strip chart recorder (Hewlett-Packard Co.; Model 7758A).
The flowmeter was calibrated ii! vivo in every experiment. Blood flow
to the right lung (QR) was calculated as the difference between QT and
QL. A 36 Fr. Carlen's tube, designed for left endobronchial
intuba-tion, was placed via a tracheostomy to facilitate unilateral instillation of
hydrochloric acid (HCI) and was kept in place during the rest of the
study.
All surgical procedures were done under sterile conditions.
Normal saline was infused at a rate of 50 ml/hr via a catheter in a
peripheral vein during the study period. Intravascular pressures were
measured with Statham pressure transducers (P 23 Db) and recorded on
a strip chart recorder. The mid-point of the left atrium was used as
zero reference. QT was determined using the thermal dilution
tech-nique and was done In triplicate using 10 ml of 5% dextrose solution at
room temperature. Blood samples were withdrawn from femoral and
pul-monary arteries and pulmonary veins and pH, PO2 and PCO2 were
measured immediately using a blood gas analyzer (Radiometer,· ABL-30).
Total, left and right pulmonary vascular resistances
(PVRT, PVRL and
PVRR' respectively) were calculated from the perfusion pressure
vascular resistance ( SVR) was also calculated from systemic perfusion
pressure (AP-RAP) divftled by QT. Both PVR and SVR were expressed
..
as mmHg/1/min. Body temperature was maintained at 37. 0°C by using a
heating pad.
Study Design (Figure_!)_
After stabilization of hemodynamics following surgery, baseline
hemodynamic and blood gas data were collected. · Dogs were divided into
four groups. A control group consisted of five dogs who underwent
the same surgical procedure and placement of catheters as the injured
animals. In the HCl group. five dogs had HCl instillation into the left
lung after baseline measurements. A 10-Fr polyvinyl chloride tube was
advanced into the left main bronchus through a left-sided orifice of a
Carlen's double-lumen catheter and 1.5 ml/kg body weight of 0.1 N HCI
was instilled slowly. In the supine position, intrabronchially injected
HCl went preferentially into the lower lobe. To induce a more
homo-genous injury, HCI was instilled at four positions; supine. head down,
head down + left side dependent recumbent and left side dependent
recumbent positions. Distribution of HCl was confirmed by adding a
small amount of 1% methylene blue as an indicator. Immediately after
instillation of the HCI, intrabronchial suction of the right Jung was
per-formed to make sure that unilateral instillation into the left hmg was
achieved. After HCl administration, data were collected hourly for four
hours. In the hypoxia group, 5 dogs were ventilated with a hypoxic
gas mixture (12% 02 + 88% N2 ) for 10 minutes periodically at 60, 120
and 180 minutes after the baseline measurements. Hemodynamlc and
The HCl + hypoxia group consisted of five dogs. They had both HCl
instillation and hypoxi~· ventilation at the same times as the hypoxia
group. After four hours of observation, the dogs were sacrificed with
a fatal dose of pentobarbltal sodium, and zero blood flow to the left
lung was recorded In order to complete the in vivo calibration of the
flow probe. Thereafter, both lower lobes were removed.
After the animals were · sacrificed, the lungs and heart were
re-moved en bloc by cutting the great vessels and allowing blood to drain
freely into the chest. Next, the pericardium and heart were removed,
and the lobes were individually separated. The identical procedure was
carried out in all animals, so the wet-to-dry lung weight ratios (W/D)
were not biased. After the lower lobes were removed, the dorsal
(dependent) and ventral (non-dependent) parts of the lower lobes were
identified in relation to the supine position of the dog over the six-hour
experiment. The dorsal and ventral portions were separated by placing
the lobes on a table in the exact anatomic relationship to the position of
the animal and horizontally cutting the lobes in half.
Statistics
Analysis of variance followed by Duncan's multiple range test was
used to compare physiologic data between and among groups. A
two-sided, paired Student's t test was used to analyze data between
pre-and post-hypoxia. A two-sided, unpaired Student's t test was used for
comparison of W/D. Differences were considered statistically significant
RESULTS
Effects of Acid Aspiration on Physiological Parameters
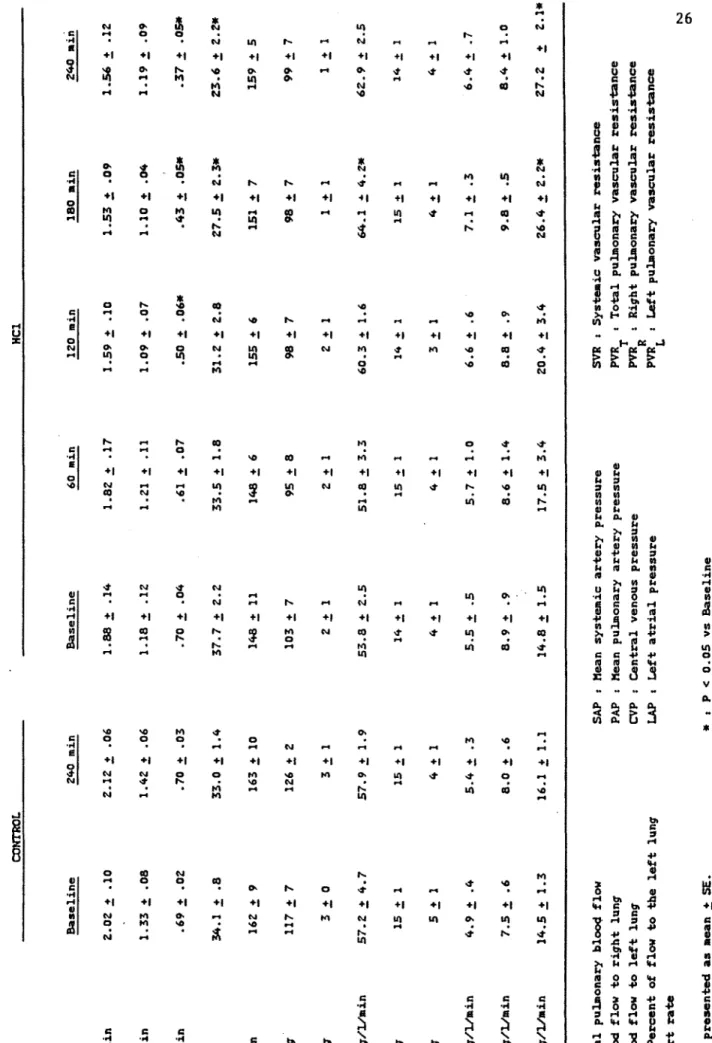
llemodynamfc changes following unilateral HCl administration are
'
summarized in Table 1. In the control group, hemodynamics were
stable during the study period. In the HCl-treated group, total
pul-monary blood flow (QT) showed a tendency to decrease after HCl
ad-ministration. At baseline blood flow to the left lung (QL) was . 70±. 04
L/min and percent of flow to the left lung (QL/QT) was 37. 7±2
.2i.
However, following HCl administration, QL decreased progressively to
.37±.05 L/min and QL/QT decreased to 23.6±2.2% at the end of a 4 hour
study (Figure 2). On the other hand, blood flow to the right lung
(QR) was stable during the study. A slight decrease was seen in mean
systemic artery pressure; however, mean pulmonary artery pressure
(PAP) did not change during the four-hour study period. Those
changes were reflected in the vascular resistances. Total pulmonary
vascular resistance (PVRT) showed a tendency to increase after 120
minutes. Pulmonary vascular resistance in the right lung (PVRR) did
not change; however, pulmonary vascular resistance fn the left lung
(PVRL) increased significantly and at the end of the experiment, it
increased to 1841, of the baseline (Figure 3). Systemic vascular
re-sistance (SVR) increased significantly 180 minutes after HCl
adminis-tration and stayed elevated thereafter. Heart rate (HR), left atrial
pressure (LAP) and right atrial pressure (RAP) did not change
throughout the study.
Table 2 summarizes blood gas data. In the control group, P02 ,
PC0 2 and pH did not change during the study. Following HCl
significantly but the pulmonary venous P02 in the non-injured right
lung was not affected. · Arterial P02 decreased significantly during the
first 2 hours after HCl; however, it showed a tendency to increase
toward the baseline during the last 2 hours. Mixed venous P0 2 showed
a time-related profile similar to the arterial P02 • An Increase of PC0 2
and n decrease of pH were observed in left pulmonary venous blood
after HCl administration. On the other hand, right pulmonary venous
PC0 2 decreased markedly after IICl administration. PC0 2 and pH did
not change in arterial and mixed venous blood.
Effects of Bilateral Hypoxic Ventilation on Unilateral Lung Injury.
Hemodynamic and blood gas changes following bilateral hypoxic
ventilation are summarized in Tables 3 and 4, respectively.
In both the hypoxia and II Cl + hypoxia groups, bilateral hypoxic
ventilation caused a significant elevation in pulmonary artery pressure
(PAP). The PAP increase was greater after the second and third
hypoxic ventilation than after the first hypoxic ventilation as previously
reported (9). In the hypoxia group, total blood flow (QT) and blood
flow to both the left (QL) and right (QR) lungs increased significantly
following hypoxic ventilation (Table 3). Because the increase in blood
flow was uniformly distributed, percent of flow to the left lung
(QL/QT) did not change (open symbols, Fig. 4). In the presence of
HCl induced unilateral lung injury, exposure to hypoxia caused an
Increase In blood flow to the injured left lung in conjunction with a
decrease in blood flow to the normal right hmg (Table 3). The result
was a consistent increase in percent blood flow to the left lung (solid
symbols, Fig. 4). In Figure 5, changes in pulmonary vascular
resistances In both left and right lungs increased significantly after the
second and third hypoxic· ventilation, suggesting that the non-injured
lung had a vasoconstrictive response to hypoxia. In the HCl + hypoxia
group, the non-injured right lung had a vasoconstrlctlve response to
hypoxia and PVRR increased significan Uy. However, in the Injured left
lung, no vasoconstrictive response to hypoxia was observed (Fig. 5).
Hypoxic ventilation caused a significant decrease in P0 2 of the
blood obtained from every sampling site in both groups. In the
hypoxia group, the P0 2 decreased significantly; however, there was no
difference between right and left pulmonary venous blood. Due to the
low P0 2 caused by HCI injury, left pulmonary venous P02 was
consis-tently lower than right pulmonary venous P02 after hypoxic ventilation
in the HCl + hypoxia group. In general, PC0 2 and pH were not
affected by 10 minutes of exposure to hypoxia.
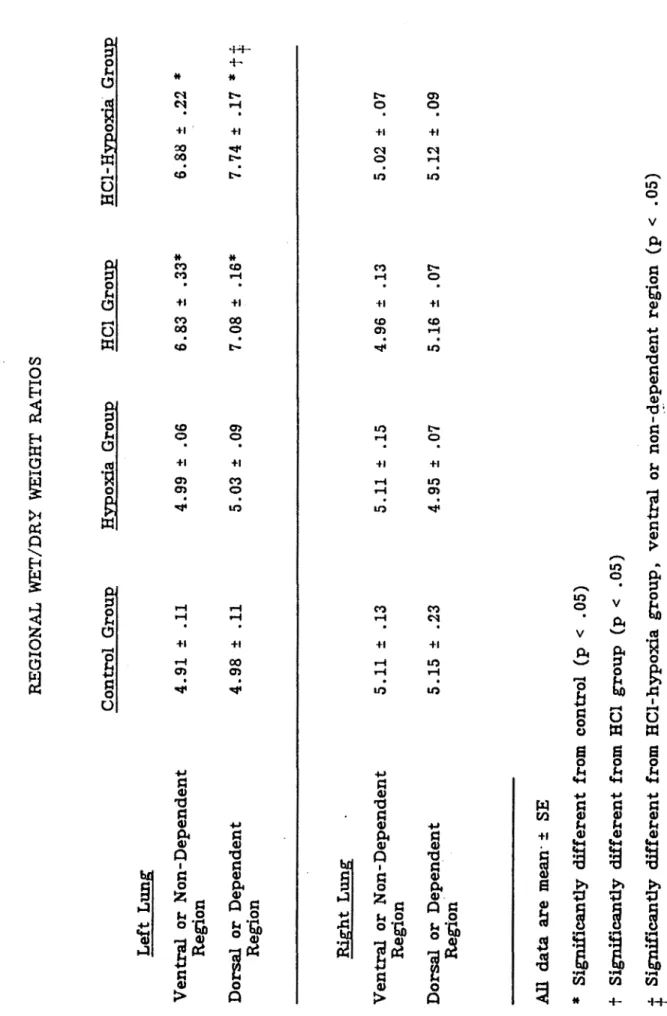
Lung Water (Table 5)
In the control and hypoxia groups, there were no statistically
sig-nificant difference in either the W/D ratios of the right and left lungs
or in the W/D ratios of the dependent and non-dependent aspects of the
right and left lung. In the HCL group, the W/D ratios of both the
dependent and non-dependent portions of the injured left lower lobe
in-creased significantly from that of the uninjured right lower lobe:
4. 96± .13 to 6. 83±. 33, and 5 .16±. 07 to 7. 08± .16 respectively. In the
HCL-hypoxia group, the W/D ratios of the dependent and
non-dependent regions of the injured left lower lobe also increased
signifi-cantly over the corresponding right lower lobe: 5.02±.07 to 6.88±.22,
Next, we compared the W/D ratios of the JICI group to the HCI-hypoxia group. There· was no statistical difference between the W/D ratios in the ventral or non-dependent regions of the injured left lower lobes in the two groups: 6. 83±. 33 to 6. 88±. 22. However, there was a statistically significant increase In the W/D ratio In the dorsal or dependent regions of the injured left lower lobe in the HCl-hypoxia group versus the HCl group: 7. 08± .16 to 7. 74± .17 (Table 5).
DISCUSSION
Acid aspiration is one of the major causes of acute lung injury and
Is characterized by increased alveolar-capillary membrane permeability
( 4, 5). Clinically, it ls of ten recognized as a localized injury such as
unilateral lung Injury. The physiolog·lcal sequences of pulmonary acid
aspiration have been extensively studied (10-14). In general, there are
decreases In heart rate, blood pressure and cardiac index immediately
after HCl administration followed by a progressive decrease in cardiac
index and a progresive increase in systemic and pulmonary vascular
resistances with or without an elevation of pulmonary · artery pressure.
Fabre et al. (11) compared these sequences to an early parasympathetic
and successive hypovolemic syndrome. Following unilateral HCl
adminis-tration, we observed a progressive decrease in cardiac output;
how-"
ever, pulmonary artery pressuri! did not change during the study.
These findings are consistent with the study of Cameron et al. (13).
They also found a progressive Increase in hematocrit and suggested
that the animals were sequesting fluid into the in~ured lung and were
becoming hypovolemic even though they were hemodynamically stable.
We demonstrated that blood flow to the injured left lung
progres-sively decreased with a concomitant increase in pulmonary vascular
re-sistance in the Injured lung following HCl administration. We also found
a marked decrease In the pulmonary venous P02 in the injured lung
from 552±22 to 70±8 torr; however, arterial P0 2 was affected less.
Using differentially labeled microspheres, Fisher. and Wood ( 15)
inves-tigated the effects of lobar acid injury on lobar and sublobar pulmonary
segments and demonstrated t.hat percent blood flow to the injured region
decreased significantly three hours after HCl administration. However,
percent flow to the non-injured region was not altered. They also
studied the effect of their blood sampling technique on lobar venous
P0 2 and demonstrated that blood from the ventral and dorsal part of
pulmonary vein had oxygen tensions of 400 torr and 60 - 70 torr,
respectively and mixed pulmonary venous blood had an intermediate
P02 • We collected mixed pulmonary venous blood with special attention
to their findings; however, P0 2 was comparable to the P0 2 of blood
from the dorsal (injured) part in their study. The lower P0 2 in our
study may be attributed to a more severe injury since we used a larger
amount of HCI. It is noteworthy that the percent decrease, of flow to
the injured segment in their study (-26. 3%) is quite similar to our
study (-27 .1%) 3 hours after HCl administration.
Flow to the Injured lung decreased because of a pulmonary
vaso-constrictive response to acid Injury. Local hypoxia induced by acid
injury may elicit hypoxic pulmonary vasoconstrlction (HPV) which, in
turn, shunts blood to the normal region and maintains arterial
oxy-genation. 'fhe presence of HPV in acute lung injury is suggested by
the fact that vasodilators can worsen gas exchange (16); however, this
ls stlll controversial. Vascular reactivity is reported to be Increased in
rat lungs injured with _-naphthylthiourea (17). On the other hand,
HPV is reported to be altered or impaired in some lung injuries, such
as bacterial pneumonia (18), endotoxemia (19,20), pulmonary oxygen
toxicity (21,22), etc. Stephenson et al. (1) reported that In
ethychlorvynol-inc.luced unilateral lung injury, the percent flow to the
Inadequate to prevent a decrease In arterial P02 • It was suggested
that, following acute lung Injury, the reactivity of pulmonary
vascu-lature was altered such that blood flow to hypoxic alveoll was
main-tained. In our study, percent flow to the injured left lung decreased
by 37% 4 hours after HCl administration. Their study might be affected
by a presence of systemic hypoxemla (Pa0 2 60. 7 torr). We found that
arterial P02 decreased significantly, reaching its trough at 2 hours
after HCl administration; however, it returned to pre-HCl level at 4
hours. This finding might be consistent with the study In which HPV
is reported to be absent at one and two hours, but return by four
hours after acid instillation in goats (23). Whatever the mechanlsm(s)
is (are) to reduce the blood flow to the injured lung, this phenomenon ls
important to decrease the shunt and also to lessen the severity of
injury which is characterized by permeability edema.
Another mechanism by which the flow to the injured lung decreases
is mechanical. It has been suggested that perivascular cuffing during
the early stage of pulmonary edema may cause a compression of small
vasculature, resulting in a decreased blood flow to the edematous region
(24). However, extensive edema is reported to be required to cause
blood redistribution (25). By raising the pulmonary arterial and
venous pressures, Bhattacharya et al. (26) induced edema in isolated
perfused canine lobe. In edematous lobes, blood flow remained constant
until lobe weight had doubled, suggesting that extensive edema is
essential to reduce the blood flow to the edematous region. We
observed alveolar flooding pathologically and a wet-to-dry lung weight
ratio of 6. 96, both of which suggest that severe pulmonary edema
after II Cl administration, the injured left lower lobe tripled its weight
from a mean of 30.2 g to 87.6 g. If th2 HCl-induced edema occurred In
a very short period of time, the blood flow decrease observed in our
study might be explained by this mechanical factor.
In HCI-treated animals exposed to bilateral hypoxia, blood flow to
the right non-injured lung decreased, but blood flow to the injured left
lung increased (Fig. 4). This is explained by an increase In pulmonary
vascular resistance In the non-injured lung without an increase in
pul-monary vascular resistance in the injured lung which Implies that either
an impaired vascular reactivity to hypoxia or on-going vasoconstriction
blocked the further response to hypoxia in the injured lung. It ls
plausible to postulate that an augmented blood flow to the injured lung
can Increase pulmonary shunt and aggravate the lung water
accumula-tion. Bishop and Cheney (16) investigated effects of vasodilator
treat-ment on gas exchange and lung water accumulation over a five-hour
period in oleic acid-induced pulmonary edema. They found that
minoxidil, which is a potent HPV inhibitor (27), increased venous
admixture by 38%, whereas animals treated with hydralazine, which does
not inhibit HPV (28), gave a smaller increase of 21%. Lung water
accumulation was significantly accelerated by minoxidil; however, a
smaller and non-significant increase was seen in the hydralazlne group.
Moreover, they observed a significantly higher mortality in
minoxidil-treated dogs and concluded that vasodilators with a minimal effect on
HPV mlgh~ be preferable in the face of respiratory failure.
We hypothesized that the increase in blood flow ~econdary to
bilat-eral hypoxia would Increase intravascular pressure and, therefore,
,.
we sought to determine W/0 ratios from both the dependent and
non-dependent regions of the lung because we thought that injury may be
Increased in the dependent areas of the lung from conditions of this
experiment. We found no increase in lung water accumulation in either
the control group or In the hypoxia group alone, Indicating no injury
occurred secondary
to
manipulation and instrumentation of the animals.In both the HCl group and the HCl-hypoxia group, there were
signifi-cant increases in W/0 ratios in the injured lung. Also, in both of
these Injured groups, there was an increase in the W/D ratios in the
dependent region versus the non-dependent region of the injured left
lower lobe with the values in the HCl-hypoxia group achieving
statisti-cal significance. This is not surprising since gravity even in the
normal human lung Increases blood flow to the dependent areas of the
lung In the upright position. In an injured capillary bed, this increase
in blood flow would alter Starling's forces and increase edema formation.
In the HCl-hypoxia group where blood flow was redirected from the
normal lung to the injured lung by bilateral hypoxia, the W/D ratio
from the dependent region was significantly greater than the
corre-sponding region of the HCl group. These data indicate that local
in-creases in pulmonary intra vascular pressure ef ther secondary to gravity
or bilateral hypoxia will further increase W/D ratios and presumably
lung water in an injured lung.
In clinical settings, patients with acute lung injury may be
exposed to hypoxia during routine airway management procedures such
as endotracheal suctioning (7), diagnostic bronchoscopy (8), ventilator
circuit change (31), etc. De~aturation of arterial blood and
33). Our findings showed that hypoxia elicited a vasoconstrictive re-sponse In the normal lung and redfstibuted the blood flow to the injured lung. If this effect is repetitive or prolonged, It may cause significant increases in lung water accumulation and aggravate the acute lung injury.
In summary, following unilateral HCI administration, blood flow to the Injured lung decreased without any effect on the contralateral lung. This decrease in flow to the Injured lung Is a protective mechanism to maintain arterial oxygenation and lessen the severity of lung injury. If
blood flow to the Injured lung Is increased either by blockade of HPV or by an elevation of pulmonary vascular pressure, Intrapulmonary shunt-ing and lung water accumulation may be accelerated, resulting in more severe Injury, especially in the acute phase of lung injury.
Ack1 __ 10wledgemen
!
The writers wish t.o thank Dr. Vito A. Mantese for technical
sup-port. This work was supported in_ part by NIH Grant HL31992 and by
a grant from RJR-Nablsco. Dr. Mark Knapp was a Parker B. Francis
REFERENCES
1. Stephenson, A.H. , R. S. Sprague, T. E. Dahms, and A. J. Lonigro. Unilateral acute lung injury induced by ehthychlorvynol In anes-thetized dogs. ~
~_N>J
Physiol 56: 1252-1259, 1984.2. Glasser, S . A. , K. B. Domino, L. Lindgren, P. Parcella, C. Marshall, and B. E. Marshall. Pulmonary blood pressure and flow during atelectasis in the dog. Anesthesiology 58: 225-231, 1983.
3, Bindslev L., A. Jolin, G. Hedenstierna, S. Baehrendtz, and
J. Santesson. Hypoxic pulmonary vasoconstriction in the human lung: Effect of repeated hypoxic challenges during anesthesia. ~nesthesiology 62: 621-625, 1985.
4. Jones, J.G., R.F. Grossman, M. Berry, G. Slavin, G.H. Hulands, and B. Minty. Alveolar-capillary membrane permeability. Correla-tion with funcCorrela-tional, radiographic and postmortem changes after fluid aspiration. Am Rey Respir !;>is 120: 399-410, 1979.
5. Toung, J.K., D. Bordos, D.W. Benson, D. Carter, G.D. Zuidema, S. Permutt, and J. L. Cameron. Aspiration pneumonia: Experimen-tal evaluation of albumin and steroid therapy. Ann Surg 183:
179-184, 1976.
6. Bishop, M.J., T. Huang, and F.W. Cheney. Effect of vasodllator treatment on the resolution of oleic acid injury in dogs. Am _!tev Respfr Dis 131: 421-425, 1985.
7. Adlkofer, S.R.M., and M.M. Powaser. The effect of endotracheal suctioning on arterial blood gases In patients after cardiac sur-gery. Heart Lung 7: 1011-1014, 1978.
8. Albertini, R.E., J.H. Harrell, N. Kurihara, and K.M. Moser.
Arterial hypoxemia · h-iduced by fiberoptlc bronchoscopy.
230: 1666-1667, 1974.
JAMA
----9. Unger, M., M. Atkins, W. A. Briscoe, and T .K. C. King.
Potentf-ation of pulmonary vasoconstrlction response with repeated
inter-mittent hypoxia.
J
Apm Physiol 43: 662-667, 1977.10. Greenfield, L.J., R.P. Singleton,
D.R.
Mccaffree, andJ. J. Coalson. Pulmonary effects of experimental graded aspiration
of hydrochloric acid. Ann Surg 170: 74-86, 1969.
11. Fabre, J. , C. Martin, C. Pomane, P. Long, and G. Francois.
The early period of experimental Mendelson's syndrome in dogs
with PaC0 2 and pH in a normal range. Resuscitation 11: 103-110,
1984.
12. Winn, R., J. Stothert, B. Nadir, and J. Hildebrandt. Lung
mechanics following aspiration of 0.1 N hydrochloric acid.
J
AI?.P!Physiol 55: 1051-1056, 1983.
13. Cameron, J. L., P. Caldfni, J. K. Toung, and G.D. Zuidema.
Aspiration pneumonia: Physiologic data following experimental
aspi-ration. Surgen 72: 238-245, 1972.
14. Broe, P .J., J .K. Toung, S. Permutt, and J. L. Cameron.
Aspira-tion pneumonia: Treatment with pulmonary vasodila tors. ~!!!'.IDrr.Y
94: 95-99, 1983.
15. Fisher, C.J., Jr, and L.D.H. Wood. Effect of lobar acid injury
on pulmonary perfusion and gas exchange In dogs.
J
APP.!
Physiol49: 150-156, 1980.
16. Bishop, M.J., and F. W. Cheney. Vasodilators worsen gas
exchange in dog oleic-acid lung injury. Anesthesiology 64:
17. Hill, N. S., and S. Rounds. Vascular reactivity is increased In rat
lungs Injured with· _ -haphthylthlourea. ·
J
AP.Pl
f!n~sio! 54:1693-1701, 1983.
18. Lampron, N. , F. Lemaire, B. Teisseire, A. Harf, M. Palot,
D. Matamls, and A.M. Lorino. Mechanical ventilation with 100%
oxygen does not increase intrapulmonary shunt in patients with
severe bacterial pneumonia. Am Rev Respir Dis 131: 409-413,
1985.
19. Weir, E.K., J. Mlczoch, J.T. Reeves, and R.F. Grover.
Endo-toxin and prevention of hypoxic pulmonary vasoconstriction. J
.
La~
Clln Med 88: 975-983, 1976.20. Hutchison, A.A., M.L. Ogletree, J.R. Snapper, and
ILL. Brigham. Effect of endotoxemia on hypoxic pulmonary
vaso-constriction In unanesthetized sheep.
1463-1468, 1985.
J Aw! Physio~ 58:
2L Newman, J.H., I.F. McMurty, and J.T. Reeves. Blunted
pulmo-nary pressor responses to hypoxia in blood perfused, ventilated
lungs isolated from oxygen toxic rats.: Possible role of
prosta-glandins. Prostaglandins 22: 11-20, 1981.
22. Newman, J.H., J.E. Loyd, D.K. English, M.L. Ogletree,
W. J. Fulkerson, and K. L. Brigham. Effects of lOO<t oxygen on
lung vascular function in awake sheep. ~
AP.m
Physlol 54:1379-1386, 1983.
23. Pavlin, E., L. Reed, and R. Winn. Hypoxic pulmonary·
vasocon-strlotlon
(HPV)Is absent at
1and
2hours after aspiration of
0.1N HCl but returns at 4 and 24 hours. ~m Rev Respir Dis 133:
24. Hughes, J.M.B. Regional Differences in the Lung. New York,
Academic Press; 1977~ 381-418.
25. Muir, A.L., D.L. Hall, P.O. Despas, and J.C. Hogg.
Distribu-tion of blood flow in the lungs in acute pulmonary edema in dogs.
~ ~ Physlol 33: 763-769, 1972.
26. Bhattacharya, J., K. Nakahara, and N.C. Staub. Effect of edema
on pulmonary blood flow in the isolated perfused dog lung lobe. J
fil!I?_! Physlol 48: 444-449, 1980.
27. Bishop, M.J., and F. W. Cheney. Comparison of the effects of
minoxidil and nifedipine on hypoxic pulmonary vasoconstrfction in
dogs. J Cardlovasc J>harmacol 5: 184-189, 1983.
28. Bishop, M.J., S. Kennard, L.D. Artman, and F.W. Cheney.
Hydralazine does not inhibit canine hypoxic pulmonary
vasocon-striction. Am Rev Respir Dis 128: _998-1001, 1983.
29. Jullen, M., M.R. Flick, J.M. Hoeffel, and J.F. Murray. Accurate
reference measurement for postmortem lung water. ~
A.P.P.!
Physiol56: 248-253, 1984.
30. Breen, P.H. , P. T. Schumacker, J. Sandoval, I. Mayers,
L. Oppenheimer, and L.D.H. Wood. Increased cardiac output
In-creases shunt: role of pulmonary edema and perfusion.
J
A.PP.!
Physiol 59: 1313-1321, 1985.
31. Keller, C .A., and G. L. Ruppel. Oxygen desaturation during
ven-tilator circuit changes. Heart Lung 14: 359-362, 1985.
32. Shrader, D. L. , and S. Lakshminarayan. The effect of. fiberoptfc I
bronchoscopy on cardiac rhythm. Chest 73: 821-824, 1978.
33. Shim, C., N. Fine, R. Fernandez, and M.11. Williams, Jr. Cardiac
arrhythmias resulting from tracheal suctioning. Ann Int Med 71:
FIGURE LEGENDS
Figure 1: Scheme of experimental design. Arrows on the time line show when anesthetic drugs were given. Animals were ventilated with 100% 02 after anesthesia was initiated except for the
three IO-minute periods of hypoxia shown by the cross hatched areas on the third and fourth groups. The open circles with a solid center represent the times when physi-ologic data were collected.
Figure 2: Effect of HCl administration on percent of flow to the left lung {QL/QT).
In the control group ( open circles), QL/QT did not change during the study. On the other hand, in the HCl group
{solid circles), QL/QT decreased progressively. * : P < 0.05 vs baseline
Figure 3: Effect of IICI administration on left and right pulmonary vascular resistances {PVRL and PVRR, respectively).
PVRR in the non-injured right lung did not change, however, PVRL in the injured left lung increased progressively after HCI administration.
* :
P < 0.05 vs baselineFigure 4: Effect of bilateral hypoxic ventilation on percent of flow to the left lung (QL/QT). The cross hatched regions represent the periods of hypoxic ventllation. There was no change in
Q1/QT after bilateral hypoxic ventilation In the hypoxia group
( open symbols). However, in the HCI + hypoxia g-roup ( solid
symbols), hypoxic ventilation caused a significant increase in
QL/QT, suggesting that a shift in blood flow toward the
injured left lung occurred after hypoxia .
•
: P < O. 05 vs comparable pre-hypoxia value.Figure 5: Effects of bilateral hypoxic ventilation on left and right
pulmonary vascular resistance (PVRL and PVRR,
respec-tively). A. In the hypoxia group, bilateral hypoxic
venti-lation caused significant increases in PVRL and PVRR. B.
In the HCI + hypoxia group, PVRR in the non-injured right
lung increased after hypoxic ventilation, however, in the
Injured left lung there was no Increase in PVRL after hypoxic ventilation.
In both A and B, the cross hatched regions represent the
periods of hypoxic ventilation.
* : P < 0. 05 vs the value immediately before that period of
Baseline ~ l/ain 2.02 .± .10 QR l/•in 1.33 .± .os QL l/11in .69 ! .02 QL~ 7. 34.l ! .8 KR /ain 162 .± 9 SAP ..Kg 117 .:!: 7 CVP -Hg 3 ! 0 SVR maHg/l/11in 57.2 .± 4.7 PAP -Hg lS .:!: 1 I.AP uffg 5 .t l PVRT .. Hg/l/min 4.9 .:!: .4 PVRR aaHg/l/111in 7.5 .:!: .6 PVRL lllllffg/l/11in 14.5 .:!: 1.3 ~ Total pul.Jnonary bloo4 flow QR I Blood flow to right lung QL I Blood flow to left lung COHI'ROL Q ~ 1 Percent of flow to the left lung L • HR I Heart ra-te Data are presented as mean.:!: S£. 240 min 2.12 .± .06 1.42 .± .06 .70 .:!: .03 33.0 .t 1.4 163 .t 10 126 .t 2 3 .± l 57.9 .t l.9 15 .! 1 4 .t l 5.4 .t .3 8.0 .:!: .6 16.1 .t 1.1 TABLE l. HB1Cllnw1IC ClAHG'ES AFTER HCl Baseline 60 min 1.88 .± .14 1.82 .± .17 1.18 .± .12 1.21 .± .11 .70 .± .04 .61 .:!: .07 37.7 .± 2.2 33.5 .± 1.8 148 .:!: 11 148 .t 6 103 .t 7 95 ! 8 2 .± 1 2 .± l 53.8 .± 2.5 51.8 .± 3.3 14 .! l 15 .! l 4 .± 1 4 .± l
s.s
.:!: .5 S.7 .:t 1.0 8. 9 .:!: • 9 8.6 .! 1.4 14.8 .± 1.5 17.5 .± 3,4 SAP, Mean systemic artery pressure PAP I Kean pul.Jnonary artery pressure CVP I Central venous pressure I.AP I Left atrial pressure * 1 P < 0.05 vs Baseline HCl 120 min 180 min 240 1.59 .± .10 1.53 .± .09 1 • .56 1.09 ! .07 1.10 .± .04 1. 19 .so .:!: .06* .43 .± .05* .37 31.2 .t 2.8 27.5 .± 2.3* Z3.6 155 ! 6 151 .t 7 159 98 .t 7 98 .t 7 99 2 .± l 1 .± 1 1 60.3 .± 1.6 64.1 .! 4.Z* 62. 9 14 .! l 1S .! 1 14 3 .:!: 1 4 .:!: l 4 6.6 .t .6 7.1 .t ,3 6.4 a.a .t .9 9.8 .:!:.s
8.4 20.4 .± 3.4 26.4 .t 2.2• Z7.2 SVR I Systemic vascular resistance PVR , Total pulmonary vascular resistance T PVR Right pul.Jnonary vascular resistance R PVR I Left pulmonary vascular resistance LTABLE Z. EFFECTS OF HCl ON GAS EXCiANG'E a»n"ROL Baseline 240 min Baseline ~ P02t soo .:!: 33 487 .:!: 4Z ssa .:!: 19 419 .! 40* Femoral PCO/ 3.5 ± 1 36 .:t 1 38 ± l 37 ± Z Ar'i:eey pH 7.38 .! .01 7.38 .! .03 7.35 .:!: 03 7.36 .:!: .03 P02 46 .:!: 4 46 ± 3 44 .:!: .5 40 ± 3 Pulaonaey PC02 43 ± 2 46 .:t 2 48 .:t 2 48 .:t l Artery pH 7.30 ;t .01 7.31 ± .03 7.29 .! .01 7.29 .:t .01 P02 494 ± 14 .517 .:t 32 552 ± 22 110 .:!: 31* Left: Pulmonary PC02 26 .:!: 2 31 ! Z 27 .:!: 2 39 .:t 4 Vein pH 7.44,: .03 7.42 ± .03 7.44 .! .oz 7.32 ± .03 P02 Sl9 .:t 46 S43 .:! 29 558 .:t 27 524 .:!: 10 Right: Pullllonaey PCOz 29 ± 2 31 ! l 32 .! 4 26 .! 4 Vein f.H 7.44 ± .03 7 .44 ± .0.5 7.40 ± .04 7.41 ± .04 Da-ta are presented as 111ean ± S£. •, P < 0.05 vs Baseline t, torr HCl 120 ain 367 .:!: SO* 3.5 ± 2 7.36 .:!: .03 40 .:t 3 4.5 ± 2 7.29 .:t .01 1Z9 .:t 39!f 39 ± 6 7.32 .:t .06 556 .:!: 14 28 .:!: 4 7.40 + .04 180 ain 470 .! 22 34 .:t 2 7.37 .:!:
.oz
42 .! 3 46 .! 3 7.27 ;t .oz 70 ± 8• 42 ± 5 7.31 .± .044 .570 .:!: 17 28 .:!: 4 7.40 + .04 Z40 471 33 7.38 41 48 7 .28 106 38 7 .33 .532 29 7.38\
QR QL QL/~ HR SAP CVP PAP LAP TABU: 3 EFFECTS OF BII.ATER.A.L H'lPOXIC VEMrII.ATION ON HENCIJYNAl'IIC PARAHETERS.
. H);'.fOXia Groue HCl + H>::fOXia Grouf lsi: 2nd 3rd Pre- Posi:- Pre- Posi:- Pre- Posi:-H>::fOXia Hyeoxia H>::foxia Hyeoxia H>::fOXia Hyeoxia 1/ • in 2.23,:t.lZ 2.64,:t.12* Z.16,!.10 Z.59,:t.l~ 2.17,!.09 2.42,!.ll* 1/ • in 1.42,:t.04 l.64,!.18 1.43,!.04 l.60,:t.0~ 1.41,:t.04 1.52,:t.05* l/111in .79,:t.09 l.OO;t.15* .73,:t.09 .99!,.ll-.76,:t.10 .89,t.08* Y. 34.9,±2.l 38.0,:tS.6 34.0,±2.7 37.5,:tZ.9 34.7,±3.2 36.8,:tl.7 /min 158,!7 160,:t9 158,:t7 160,:t7 155,:6 162,:t8 • -Hg 130,±10 130,:tlO 128,±10 131.tll 126.tlO 129,±10 lllfflHg 0,:tl O,!l O.tl lzl 0,:tl O,:tl IIIIIHg 15,:tl 23,±llE* 15,±1 27.!2** 15.tl 27.±2** mmHg 1.±1 2.±1 l.±1 l.±1 1,:1 1,:1 Dai:a are presented as mean.! SE. Abbreviai:ions used are i:he same as Table 1 * 1 p < 0.0S vs c011parable pre-hypoxia value**
1 p < 0.01 vs c0111parable pre-hypoxia value lsi: 2nd Pre- Post- Pre-Hyeoxia HyfOXia H>::fOXia 1.94,!.14 2.06,:t.16* 1.73,!.17 1.34,:t.14 1.20,:t.14* l.19,:t.17 .61,:t.05 • 86 .t . l)8!iHf • .54,±.05 31. 7,±3. 2 42.3,±4.l** 32.3,±3.8 148,!9 149,±10 150,±7 105,!7 102.!8 99!,7 lzl 2!.l 1,!.l 14,±l 19.tl** 13.tO 1.±0 2.±1 2.±0 3rd Posi:- Pre-H>::foxia Hr.foxia 1.84,:t.16 1.63,!.20 .97,:t.09 l .15,:t.18 .87,±.aa.i .48z.o6 47.4,±1.6** 30.2,±3.9 152,:t7 150,:t~ •. 93,:t9 96.t9 •. 2,:tl 0,±1 21,:tl** 13,±0 3.±l 2,±0 Posi:-Hnoxia 1.71,!.16 1.00,:t.09 • 41.2,±3.0- 150,!9 90,!13 22.±1**TABLE 4 8LOOO GAS QUNG£S AF.TER BILATERAL H'tP0XIC VENTILATION \ H:tpoxia Groue HCl + Huoxia Group 1st 2nd 3rd 1st 2nd 3rd Pre- Post- Pre- Post- Pre- Post- Pre- Post- Pre- Post- Pre-Huoxia Hypoxia Hypoxia Hypoxia Hypoxia Hypoxia Hypoxia Hypoxia Hypoxia Huoxia Hypoxia
PO/
523:,30 40,t3-490,t35 39,t2-505,t34 38.tl-301,±45 40,t3H! 333,t.58 37,t3H! 389,tSl F-oralPC!Ji
35,tl 32,tl 31;!1 31,t2 33.;tl 31.tZ 34.±2 34.±1 34.±2 33.±2 33.±2 Artery pH 7.35.t.02 7.40.:.03 7,38,±,03 7.41.±,04 7.37±,,04 7.40:,t.03 7.39,±.02 7.39,±.01 7.39.t.02 7 .41:,t. 03 7.39:,.02 P02 53,±4 27:,i?-51:,3 26;:2-50±,3 24;:2H! 39!,l 24.tl-38.tl 23±,lH! 37:,l Pul.Jaonary PaJ2 40!,l 38.tl 40;tl 35,t3 4l;t2 37±.2* 45.±2 44±.2 46±,2 40±,2 43!3 Artery pH 7.29;t.03 7,34,!..02 7.33±,.02 7 • .A;t.02 7.31,±.02 7.34.t,02* 7.31±,.02 7.32±,.01 7.30;t.02 7.33;t.Ol 7.29±,,03 Left P02 478:,31 47:,5-470;tl9 44.:3-485.:13 43,±4** 66:,16 31±4* 70±,21 27.±2 60;tl5 Pul.Jaonary PaJ 2 27,,t2 27.±l 26!,2 27±.l 27!,3 26.t2 39!,2 34.:3* 39,±4 38.±3 40.t5 Vein pH 7,40,:t.04 7.41.t,03 7.43,t.04 7.42,t.03 7.41,t.04 7.41.!,.04 7.35,::.03 7.39,::.04 7 .35,::.04 7.37,::.03 7.34,::.03 Right P02 534!,29 49.±2** 539:;23 45.tl** 547.t33 43!,3** 550:,9 52.t2** 533.t22 49,±4** 546,±43 Pullllonary PC0 2 Z6.:!;l 26.±.l 26.!l 25,!.l 27.!l 27.:!;l 27±2 26!,l 27!,2 25.tO 29,±4 Vein pH 7.40+.02 7.42+.03 7.42_:t:.02 7.43_:t:.04 7.41-+.02 7.43+.03 7.45_:t:.04 7 .44_:t:.02 7 .45_:t:.02 7 .45_:t:.02 7.43+.01 Data are presented as •ean .t SE.t
I torr*
, p < 0.05 vs c0111parable pre-hypoxia value -1 p < 0,01 vs c011parable pre-hypoxia valueLeft Lung Ventral or Non-Dependent Region Dorsal or Dependent Region Right Lung Ventral or Non-Dependent Region Dorsal or Dependent Region· · All data are mean·± SE TABLE 5 REGIONAL WET/DRY WEIGHT RATIOS Control Group Hypoxia Group 4.91 ± .11 4.99 ± .06 4.98 ± .11 5.03 ± .09 5.11 ± .13 5.11 ± .15 5 .15 ± .23 4.95 ± .07
*
Significantly different from control (p < .05)t
Significantly different from HCl group (p < .05) HCI Group HCI-Hypoxia Group 6.83 ± .33* 6.88 ± .22 * 7.08 ± .16* 7.74 ± .17 *t+
4.96 ± .13 5.02 ± .07 5.16 ± .07 5.12 ± .09+
Significantly different from HCl-hypoxia group, ventral or non-~ependent region (p < .05)PREPARATION Baseline
2
3
4 hr
!
;
Ii
IJ
I*
J30
PENTOBARBITAL
3
2
2
2
mg/kg
PANCURONIUM
0.15
0.05
0.05
0.05 mg/kg
CONTROL
(!)
®
©
®
@x
HCI
®i
@©
®
®X
0.1N HCI, 1.5 ml/kg info Leff Lung
HYPOXIA
•
• X
0.1
N HCI, 1.5 ml/kg info Leff Lung
40
20
Baseline
mean+ SEM
60
120
MINUTES
*
180
240
C
·-
E
'-..30
~20
:c
E
E
PVRL
PVRR
o---_._
_ __._
_ ___._
_ _.__
_ __.___
Baseline 60
120 180 240
MINUTES
50
40
~ 1-•0 ...• c,30
Baseline
60
mean± SEM
120
180
240
C