48-1
Building energy simulation towards developing a guideline for NZEBs in Egypt
1. Introduction
As a part of our research project to create a detailed strategy to achieve zero energy performance level in Egyptian office buildings, this research mainly focuses on optimizing building envelope design alternatives through integrating various passive and active solar strategies along with introducing energy efficient system technologies to the building. 213 case-studies were studied in 3 Egyptian cities
“Cairo, Alexandria and Aswan” in 3 different climatic zones.
Applying the proposed strategies could achieve around 65% energy savings in Cairo, 66% in Alexandria and 64% in Aswan. An active solar system was proposed and the building could achieve positive energy performance level. We also conducted a questionnaire to analyze the perception of Egyptian designers and academics towards ZEBs in which 50 Egyptian green building experts participated and the findings of the survey are presented and analyzed in this study.
2. Methodology.
The construction and laboratory experiments of zero energy buildings [ZEBs] are a costly way to explore the potential energy saving impacts of various building design alternatives. Computer simulations can provide an initial guide for early stages of design especially for those inexperienced about zero energy building design.
Providing a guideline or a strategy that suits the domestic situation is essential to implement and promote ZEBs. Since ZEBs can be defined in several ways, in this research we considered net zero source energy as the main target for this strategy.
3. Building model
A Sketchup model for a typical Egyptian office building was
created to run the simulations required for this research. Model details are shown inTable 1. A plan and an elevation of the building model are shown in Fig 1. The case studies implemented in this research are shown in Table 2. Recommended cases are highlighted in dark blue.
Fig.1.Building model.
Building area 1112 m2
Total floor area 6672 m2
Unconditioned
floor area 1073 m
2
Floor height 3m
No of floors 6
No of thermal
zones 78
Main use Office
Table1. Model characteristics.
Ahmed Shahin
Table 2. Research Case studies.
Research Case Studies
Step 1: Orientation North N.East East South S.west West
Step 2: Blinds Case 1 Case 2 Case 3 Case 4 Case 5 Case 6
Single SHGC_0.82_ U_5.8 SHGC_0.62_ U_5.8 SHGC_0.4_U_5.1 SHGC_0.26_U_4.7 Step 3: Window
types *1*2 Double SHGC_0.62_ U_3.1 SHGC_0.37_ U_1.5 SHGC_0.28_ U_1.3
Tripple SHGC_0.47_ U_0.79 SHGC_0.31_ U_1.21 SHGC_0.2_ U_1.2
Step 4: Wall
types Fired Clay 125 mm
Solid Cement Brick 200
mm Single Red Brick 125 mm Hollow Cement Brick 200
mm Limestone brick 250 mm Double Red Brick with AirGap 380 mm Double Red Brick with Glass wool 380 mm
Step 5: Roof Insulation No insulation Pertile 25 mm Expanded Polystyrene Extruded 12.5 mm Expanded Polystyrene Molded 25 mm
Expanded Polystyrene Molded 75 mm
Expanded Polystyrene Extruded 120 mm
Expanded Polystyrene Extruded 150 mm
Step 6: Daylighting sensors With Daylighting sensors No Daylighting sensors
Step 7: HVAC Cooling 22°c 23°c 24°c 25°c 26°c
setpoint Heating 22°c 21°c 20°c 19°c
HVAC system
Improvements Heat recovery ventilator
Improve fan belt
efficiency 3% COP4 Enable Demand controlled Ventilation
Step 8: PV No Pv 0.2 PV Roof 0.2 PV Roof +Blinds 0.4 PV Roof 0.4 PV Roof +Blinds
0.6 PV Roof 0.6 PV Roof +Blinds 0.6 PV Roof +Blinds 0.75 PV Roof 0.75 PV Roof +Blinds
Step 9: BIPV BIPV 1 BIPV 2 BIPV 3 BIPV 4
48-2
4. Results and discussion.
4. 1. Effect of shading system.
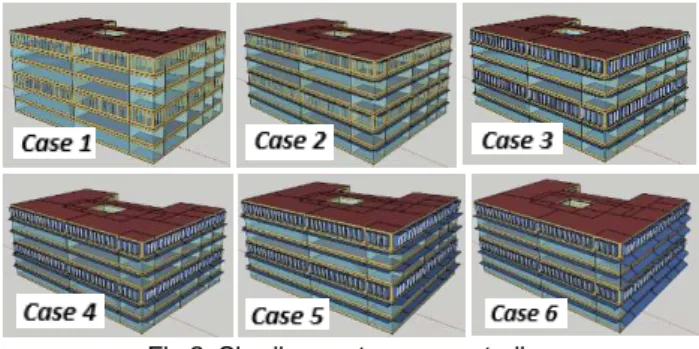
Using optimized shading systems plays a significant role in reducing the solar radiation effect on buildings which will reduce cooling demands and enhance indoor thermal comfort. In this research 6 shading scenarios were studied as shown in Fig 2 and Table 3. As illustrated in Fig 3. Around 14% cooling & heating load deductions were achieved in Cairo. Also around 15% in Alexandria and 16 % in Aswan through installing the proposed shading system.
4. 2. Effect of window type.
Façade configurations and window type has a huge impact on cooling, heating and lighting energy demands. It also influences the indoor thermal comfort and it can provide a pleasant work environment through daylighting. In thisresearch 10 window type scenarios were studied. The impact of window type on cooling and heating loads in Cairo is shown in Fig.4. Tinted double low-E glazing of the following characteristics SHGC 0.28, VT 0.41 and U-Value 1.33 W/m²K was chosen for our model since it confirms with the Egyptian code for both SHGC and VT requirements. In addition, it achieved the best simulation results.Cooling & heating loads dropped down more than 10% in Cairo, 9% in Alexandria and 14% in Aswan. Glazingcharacteristics are illustrated in Table 4.
4. 3. Effect of wall types.
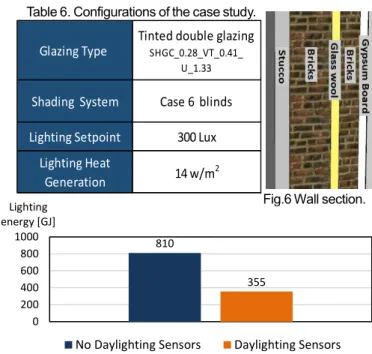
While the current situation in Egyptian building walls are rarely insulated , around 8% cooling and heating load deductions where achieved when using double red bricks with glass wool insulation and increasing wall R value to 3.1 [K. m²/W]. The proposed wall section is shown in Fig. 6. In this research 7 wall insulation scenarios were studied, the impact on cooling and heating loads in Cairo is shown in Fig.5. The findings clearly show the importance of wall insulation on reducing cooling and heating loads, thus reducing its energy usage and improving the building overall energy efficiency.Wall combinations analyzed in the case studies along with their thermal characteristics are
shown in Table 5. Recommended case is highlighted in dark gray.
*3 PF: Projection factor. [-] *4 VT: visible transmittance. [-] *5 A: Stainless steel coating. [-] *6 B: Titanium coating. [-] *7 H: High-transmittance coating. [-] *8 M: Medium-transmittance coating. [-]
*9 LoE: Low-emissivity metallic coating on one or more panes. [-]
Fig 2. Shading system case-studies.
Fig.4. Glazing impact on cooling and heating loads, Cairo.
Blinds *3
Case 1 No Blinds
Case 2 0.4 PF Overhangs
Case 3 3rd and 6th floors [0.25 PF+ Louvers]+
1st,2nd,5th floors [0.4 PF]
Case 4 3rd and 6th floors [0.25 PF+ Louvers]+
1st,2nd,5th floors [0.5 PF]
Case 5 3rd and 6th floors [0.4 PF+ Louvers]+
1st,2nd,5th floors [0.6 PF]
Case 6 3rd and 6th floors [0.45 PF+ Louvers]+
1st,2nd,5th floors [0.7 PF] 30° tilted on West and East
Table 3. Shading system characteristics.
Fig.3. Shading impact on cooling and heating loads, Cairo. 973
899 881 865 840 813
39 45 47 49 52 60
0 200 400 600 800 1000 1200
Case 1 Case 2 Case 3 Case 4 Case 5 Case 6
C
a
ir
o
Thermal load [MWh] Cooling Heating
1 813
794 769 750 781 741 727 752 732 715
60 64 67 69 58 57 59 53 61 61
0 200 400 600 800 1000
SHGC_0.82_U_5.78 SHGC_0.62_U_5.78 SHGC_0.4_U_5.07 SHGC_0.26_U_4.66 SHGC_0.62_U_3.12 SHGC_0.37_U_1.49 SHGC_0.28_U_1.33 SHGC_0.47_U_0.79 SHGC_0.31_U_1.21 SHGC_0.2_U_1.12
S
in
g
le
D
o
u
b
le
T
ri
p
le
Thermal load [MWh]
Cooling Heating
Glazing Type SHGC VT U- value
Clear 6 mm 0.82 0.88 5.78
Blue 6 mm 0.62 0.57 5.78
Single Ref-B-H Clear 6 mm 0.40 0.30 5.07 Ref-A-M Clear 6 mm 0.26 0.14 4.66 Green 3 mm /6 mm Air 0.62 0.74 3.12
Double LoE (e2=.1) Tint 6 mm /13 mm Argon 0.37 0.44 1.49
LoE Spec Sel Tint 6mm/13mm Argon 0.28 0.41 1.33
LoE (e2=e5=.1) Clear 3mm/13mm Argon 0.47 0.66 0.79
Triple LoE Film (55) Clear 6 mm/6mm Air 0.31 0.46 1.21 LoE Film (44) Bronze 6mm/13mm Air 0.20 0.22 1.12 *5 *6
*7 *8
*9
*4
Tripple
Table 4. Glazing type case studies.
48-3
4. 4. Effect of daylighting sensors.
The application of daylighting sensors and lighting controls not only reduces building energy consumption significantly through reducing the load on artificial lighting system and reducing heat generation in the room caused by artificial lighting equipment but also it improves visual comfort and well-being of building occupants. We simulated the effect of applying daylighting sensors to our modelwith automatic on/off Controls with lighting setpoint at 300 Lux as recommended by the Egyptian code for commercial buildings. Configurations of the case study are shown in Table 6. As illustrated in Fig 7. Around 56% energy savings for lighting in Cairo, 54% in Alexandria and, 48% in Aswan were achieved and cooling loads dropped by 17% in Cairo, 19% in Alexandria and 11% in Aswan while heating increased by 48% in Cairo, 44% in Alexandria and 36% in Aswan as shown in Fig 8. Although heating energy value is not significant in the case of the three cities.
4. 5. Effect of PV.
Using PV panels has a great potential since Egypt has 2,400 hours annually for potential solar operations. In this research 9 PV scenarios were studied, (1) No PV. (2) 20% of roof area covered with PV. (3) 20% of roof area plus blinds covered with PV. (4) 40% roof area. (5) 40% roof area with blinds. (6) 60% roof area. (7) 60% roof area with blinds. (8) 75% roof area. (9) 75% roof area with 60% blinds. On-site generation Vs total source energy and Net source energy/m2 in Cairo case are shown in Fig 10 and Fig 11. Fig 9. Illustrates the model with PV panels installed on its roof. The building could achieve nearly zero starting from 0.6 roof PV on its roof. However our main target is to reach Net zero so we explored the potential of BIPV application on the building south façade.
4. 6. Effect of BIPV.
Integrating PV in the building design can have significant impact on harvesting renewable energy from the sun and covering the building energy needs from environmentally friendly sources. We simulated the effect of integrating PV cells in the building south façade for 1 floor BIPV1 and two floors BIPV 2, 3 floors BIPV 3 and 4 floors BIPV 4 as shown in Fig 12 and calculated total source energy versus on-site generation and the building could reach positive energy performance level using this strategy as shown in Fig 13.
810
355
0 200 400 600 800 1000 Lighting energy [GJ]
No Daylighting Sensors Daylighting Sensors
Fig 7. Impact of daylighting sensors on lighting energy, Cairo Table 6. Configurations of the case study.
641
45
530
67 0
100 200 300 400 500 600 700
Cooling Heating
Thermal loads [MWh]
No Daylighting Sensors Daylighting Sensors
Fig 8. Impact of applying daylighting sensors on HVAC loads, Cairo
720 706 703 695 669 666 663
54 54 54 54 51 50 50
0 100 200 300 400 500 600 700 800 900
Clay SCB SRB Limestone HCB DRB
AirGap
DRB GW Thermal load
[MWh]
Wall type Cooling Heating
Fig.5. Effect of wall type on cooling and heating loads, Cairo Table 5. Wall type components
Wall type Components Color R-value
m2K/w
Clay 125 mm_ Clay Stucco 0.025 + Clay brick 0.125+ Gypsum board
0.012 Gray 0.35
Cement Brick Wall (Solid) 200 mm_SCB Stucco 0.025 + Solid cement brick 0.2+ Gypsum
board 0.012 Gray 0.42
Single Red Brick Wall 125 mm_SRB Stucco 0.025 + Red Brick 0.125+ Gypsum board
0.012 Red 0.47
Limestone Wall 250 mm_Limestone Stucco 0.025 + Limestone brick 0.25+ Gypsum
board 0.012 Sandy 0.53
Cement Brick Wall (Hollow) 200 mm_CBH Stucco 0.025 + Hollow cement brick 0.2+
Gypsum board 0.012 Gray 1.51
Double Red Brick Wall with AirGap 380 mm_DRB AirGap Stucco 0.025 + Red brick 0.25+ AirGap 0.025+
Red brick 0.125+ Gypsum board 0.012 Red 2.13
Double Red Brick Wall with GW 380 mm_DRB GW Stucco 0.025 + Red brick 0.25+ Glass Wool
0.1+ Red brick 0.125+ Gypsum board 0.012 Red 4.4
*10 PV: Solar Photovoltaic panel. *11 PV R: PV on the Roof.
Fig.6 Wall section.
Glazing Type
Tinted double glazing SHGC_0.28_VT_0.41_
U_1.33
Shading System Case 6 blinds
Lighting Setpoint 300 Lux
Lighting Heat
Generation 14 w/m
48-4
.
5. Conclusion.
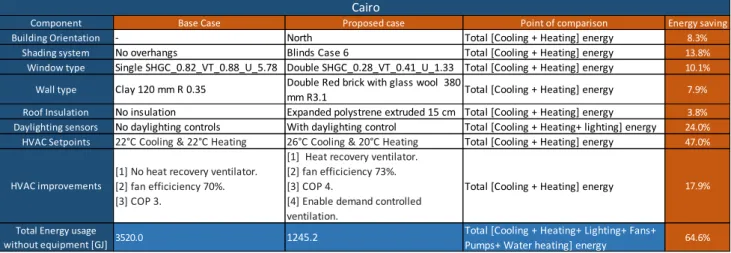
In this research certain design strategies have been developed to integrate passive and active solar design in order to achieve net zero energy level in Egyptian office buildings. Same methodology was applied for Alex and Aswan cases. Final proposed cases compared to the base case are shown in Table 7. Applying proposed strategies can achieve energy savings for total building energy usage except equipment [Heating+ Cooling+ lighting+ fans+ pumps+ water heating] by around 64.6 % in Cairo case, 65.9% in Alexandria case and 63.8 % in Aswan case.After achieving significant energy savings through passive strategies and system technologies, an active solar system was proposed to cover the building energy needs. Only Egyptian locally available materials were used in all simulations. We based our simulation on the actual situation and common lifestyles for the office occupants in Egypt and all configurations comply with the Egyptian energy code. The combinations provided in this research proves that achieving nearly zero, zero and even positive energy level in Egyptian office buildings can be possible if certain strategies were to be followed.
Fig 9. Building model with roof PV.
5372 5372 5372 5372 5372
4550 4797
5033 5291
5532
0 2000 4000 6000
No BIPV BIPV 1 BIPV 2 BIPV 3 BIPV 4
Energy [GJ] On-Site Generation [GJ] Total Source Energy [GJ]
Fig.13. Source energy vs PV energy generation, Cairo. *13
5372 5372 5372 5372 5372 5372 5372 5372 5372
0 -954 -1248
-1907 -2523 -2861 -3835
-3576 -4550
-6000 -4000 -2000 0 2000 4000 6000
No Pv 0.2 PV R 0.2 PV R+B 0.4 PV R 0.4 PV R+B 0.6 PV R 0.6 PV R+B 0.75 PV R 0.75 PV R+B
Energy [GJ] Total Source Energy On-Site Generation
Fig 10. Source energy vs PV generation. *10*11*12
*4
Fig.12. Position of PV, BIPV 4.
805 662
618 519
427 376 230 269
123
0 200 400 600 800 1000
No Pv 0.2 PV R
0.2 PV R+B
0.4 PV R
0.4 PV R+B
0.6 PV R
0.6 PV R+B
0.75 PV R
0.75 PV R+B [MJ/m2]
Fig 11. Net Source Energy MJ /m2
*12 PV R+B: PV cells on both roof and Overhangs. *13 BIPV: Building Integrated photovoltaic system
Table 7. Proposed cases Vs base case energy savings, Cairo. Cairo
Component Base Case Proposed case Point of comparison Energy saving
Building Orientation - North Total [Cooling + Heating] energy 8.3%
Shading system No overhangs Blinds Case 6 Total [Cooling + Heating] energy 13.8%
Window type Single SHGC_0.82_VT_0.88_U_5.78 Double SHGC_0.28_VT_0.41_U_1.33 Total [Cooling + Heating] energy 10.1%
Wall type Clay 120 mm R 0.35 Double Red brick with glass wool 380
mm R3.1 Total [Cooling + Heating] energy 7.9%
Roof Insulation No insulation Expanded polystrene extruded 15 cm Total [Cooling + Heating] energy 3.8%
Daylighting sensors No daylighting controls With daylighting control Total [Cooling + Heating+ lighting] energy 24.0%
HVAC Setpoints 22°C Cooling & 22°C Heating 26°C Cooling & 20°C Heating Total [Cooling + Heating] energy 47.0%
HVAC improvements
[1] No heat recovery ventilator. [2] fan efficiciency 70%. [3] COP 3.
[1] Heat recovery ventilator. [2] fan efficiciency 73%. [3] COP 4. [4] Enable demand controlled ventilation.
Total [Cooling + Heating] energy 17.9%
Total Energy usage
without equipment [GJ] 3520.0 1245.2
Total [Cooling + Heating+ Lighting+ Fans+