パラアスリートにおける車いすエルゴメーターを用いた
100m レースシミュレーション中の力発揮における
両側性対称性の特徴
Characteristics of Bilateral Symmetry of Force Outputs
during 100m Race Simulation Using Wheelchair Ergometer
in Para-Athletes
著者(共著者を含む)
柏木 悠
1),平野智也
2),相馬満利
3),藤戸靖則
4),袴田智子
5),船渡和男
4)Kashiwagi Yu
1),Hirano Tomoya
2),Soma Mari
3),
Fujito Yasunori
4),Hakamada Noriko
5),Funato Kazuo
4)抄 録
本研究の目的は,車いす 100m レースシミュレーション中の力発揮おける両側性対称性の特徴を明らかに することであった.被験者は,パラリンピックメダリストを含む T53,T54 クラスの男女パラアスリート 6 名であった(年齢:40.5 ± 7.2yrs,身長 :165.5±7.6cm,体重 55.5±8.7kg).被験者は,車いすエルゴメー ター(KEKU 社製)上で,100m レースシミュレーションを行った.レースシミュレーション中の時空間パ ラメーターおよび左右の車輪に加えられた力発揮の両側性対称性の分析を行った.車輪に加えられた力学的 変数の対称性指数(absolute symmetry index: ABS SI)は,車輪の Push time, Peak force および Force impulse を 10m 区間毎に平均値を求めた . Force impulse の両側性対称性指数の 95% 信頼区間は,レース全 体を通して 6.5-14.2% であった.100m レースシミュレーション中の 10-20m 区間(p=0.03, r=0.90)と 20-30m 区間(p=0.03, r=0.90)において,左右の車輪 Peak force には統計上有意な差がみられたが,車いす の推進力となる車輪 Force impulse の左右差は,左右の Push time と Peak force を相互に補償することで統 計的有意差はみられなかった.車いすプッシュ動作の力発揮の左右差は,障がいクラスによって影響し,筋 出力あるいは上肢の関節トルク発揮を相補的に代償させていることが示唆されると同時に,パラアスリート の個人差を考慮することの重要性が示された.Abstract
The purpose of this study was to investigate of the bilateral symmetry in wheelchair force during sprint racing the 100m race simulations using wheelchair ergometer. The subjects participated in this
1)専修大学スポーツ研究所(Senshu University Institute of Sport)
2)国士舘大学大学院スポーツ・システム研究科(Kokushikan University Graduate School of Sport System) 3)十文字学園女子大学(Jumoji University)
4)日本体育大学(Nippon Sport Science University)
study were six male and female para-athletes in the T53 and T54 classes (age: 40.5 ± 7.2 yrs, height: 165.5 ± 7.6 cm, weight 55.5 ± 8.7 kg) including Paralympic medalists. Subjects were performed 100m race simulation on the wheelchair ergometer system (1kHz, KEKU, Canada). Mechanical inputs of this system such as aerodynamic drag, rolling resistance, and internal friction were applied form primary re-search(Fuss, 2009). The spatio-temporal parameters during the race simulation and the symmetry of the force exerted on the left and right wheelchair were analyzed. The wheelchair push time, peak force and force impulse were calculated for each section by the symmetry index (ABS symmetry index: ABS SI) during 100m race simulation. The statistically significant difference in the peak force of the left and right wheelchair peak force in the 10-20m (p=0.03, r=0.90) and 20-30m (p=0.03, r=0.90) section during the 100m race simulation. The bilateral symmetry index of the wheelchair force impulse was 6.5-14.2% during the 100m race. The laterality of the force impulse, which is the propulsion force of the wheelchair, was not statistically significant by compensating for the left and right push time and peak force. This study suggested that the laterality of wheelchair push motion exertion of force is affected by the disability class and complementarily compensates for muscle outputs or joint torque exertion of upper limbs, and individual differences in para-athlete data were taken into consideration.
Keywords:Wheelchair racers, Wheelchair ergometry, Bilateral symmetry, Paralympic, Para Athletics
2 実 験 課 題
被験者は,実験前に十分なウォーミングアップを行っ た後に,車いすエルゴメーター上で 100m レースシミュ レーションテストを全力で行った.100m レースシミュ レーションテストは,各被験者の車いすを用いて実施し た.被験者には,エルゴメーターのモニター表示によっ て走行距離のフィードバックを行いながら 100m レース シミュレーションを実施した.3 100m レースシミュレーション中の力学的
変数の計測.
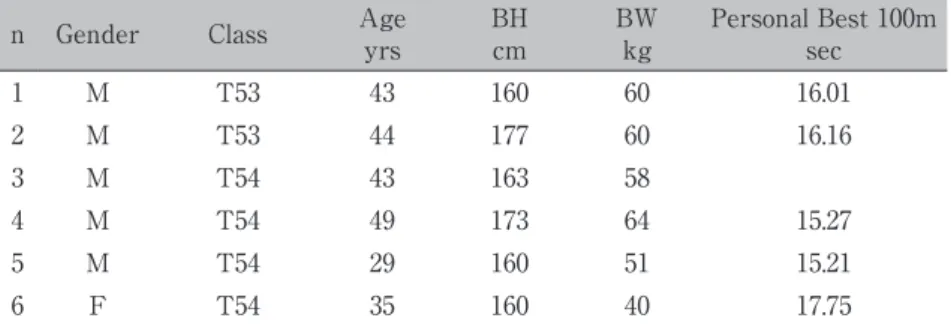
本研究は,レースシミュレーション中の車輪 Force を計測するために,車いすを固定して使用できる車いす 専用のエルゴメーター(KEKU 社製,Fig. 1)を用い た.データのサンプリング周波数は 1kHz で計測を行っ た.本エルゴメーターは,左右の車輪ローラーを一つの 剛体となった軸が制御する構造となっている.エルゴ メーターのローラーは,サーボモーターによって負荷抵 抗(トルク)を制御し,ロータリーエンコーダーによっ て車輪ローラーの速度を計測している.また,同時に右 側のローラーに取り付けられ歪ゲージによって右側のト ルクの計測を行なった.エルゴメーターの負荷抵抗の設 定は,実際のレース路面状況に近づけるために,選手に 加わる全ての抵抗を考慮した計測機のレースシミュレー ションモードを使用した.本研究における Push phase と Recovery phase の車輪 Force の運動方程式を示す (Fig. 2). ΣF = Mα ������������������① FA- FR - FD = Mα �������������② FA- FR - FD = FI (Push phase) �������③ - FR - FD = FI (Recovery phase) ������④ ここで,FAは選手が発揮した全ての力,FRは車いすTable 1. Characteristics of subjects (N=6)
n Gender Class Ageyrs BHcm BWkg Personal Best 100msec
1 M T53 43 160 60 16.01 2 M T53 44 177 60 16.16 3 M T54 43 163 58 4 M T54 49 173 64 15.27 5 M T54 29 160 51 15.21 6 F T54 35 160 40 17.75
の転がり抵抗,FDは空気抵抗,FIは慣性力を示す.FD (CdA 値 0.21-0.23m2, 時 速 範 囲 20-40km) お よ び FR は,先行研究の値を参照した(Fuss 2009).選手個々の 車いすの FRに関しては,計測前に被験者が静止した状 態で時速 20km から車輪が停止するまでのトルクデータ を多項式によってフィッティングして校正係数を算出し た. 左右の車輪 Force の計測は,サーボモーターによっ て制御された両輪の全トルクデータから右側ローラーに 取り付けられた歪ゲージによって計測された右側車輪ト ルクを両輪の全トルクデータから差し引くことによって 左側の車輪トルクを算出した.トルクデータは,最終的 にローラーの回転半径で除すことで,力データ(以下, 車輪 Force)に変換した.本研究は,エルゴメーターで 計測された車輪 Force は,選手がハンドリムに伝えた 力の接線方向への力を示す.本研究で用いた車いすエル ゴメーターのシステムの精度と妥当性は,Jean-Luc et al.(2013)によって報告されている.Fig. 1 に本研究 のデータサンプルを示す.ロータリーエンコーダーから 得られた車輪速度データと車輪 Force の積から最終的 に車輪パワーを算出した.
4 100m レースシミュレーション中の計測変
数の算出
車いすエルゴメーターから得られた車輪 Force デー タには,ノイズが含まれているため,5N をスレッシュ ホールドとして,ハンドリムのキャッチとリリースのタ イミングを同定し,Push time を算出した.Stroke fre-quency(Stroke/s)は,1 サイクル時間の逆数によって 算出した.Stroke distance は,1 ストローク中の車輪速度データを積分処理することによって算出した.また, 1 ストローク毎に左右の車輪 Force の Peak force(N) および Push phase の力積量(以下,Force impulse, N・s)を算出した.これらの計測変数は,10m 区間毎 で平均値を算出した.
5 両側性対称性指数の算出
車いすエルゴメーターから得られた計測変数の両側性 対称性指数(Symmetry index 以下 SI,Sadeghi et al. 2000)を算出した.SI は,対称性の絶対値(ABS SI) と左右差(LR SI)の優位性を示すために,2 つ式を用 いた.算出式を以下に示す.
ABS SI(%)= |Right-Left| × 100
(Right+Left)×0.5 � ① LR SI(%) = Right-Left × 100 (Right+Left)×0.5 � ② ここで,Right,Left は,左右の車輪の計測変数を示 す.ABS SI は,左右差の割合を絶対値で示す.また, 左右のどちらの車輪の計測変数が優位か同定するため に,①式の分子の絶対値を外した LR SI を算出した. LR SI は,正の値を示せば右側が優位となり,負の値を 示せば左側が優位を示す.ABS SI と LR SI は,100m 全体および 10m 区間毎で平均値を算出した.この 2 つ の変数の解釈として,ABS SI は,両側性対称性の程度 を示し,LR SI は,その左右差の優位性を表している.
6 統 計 処 理
全ての計測変数は,平均値(Mean)±標準誤差(SE)Fig 2. Free body analysis. Push phase, Recovery phase (Fuss, 2009).
ΣF = Mα
F
A– F
R– F
D= Mα
F
A– F
R– F
D= F
I(Push phase)
– F
R– F
D= F
I(Recovery phase)
; Force production by athlete
F
R; Rolling resistance force
で示した.また,得られたデータから 95% 信頼区間を 算出した.計測変数は,全て Shapio-Wilk test によっ て正規性の検定をおこなった.100m レースシミュレー ション中の計測変数の左右差の平均値は,対応ありの t 検定を行なった.10m 区間毎の計測変数の比較は,Wil-coxon の符号付き順位検定を行った.10 区間毎の対称 性指数の比較は,一元配置分散分析(対応あり)を行 い,有意性が認められた場合は,下位検定を行った.全 ての統計的有意性は,危険率 5% 未満で判定した.これ らの統計処理に加えて統計結果の差の大きさを検討する ために,効果量(Cohen 1998)を算出した.効果量の 大きさの評価は,水本・竹内(2008)を参考にして,t 検定および Wilcoxon の符号付き順位検定(r)は,0.2-0.5 を小,の符号付き順位検定(r)は,0.2-0.5-0.8 を中,0.8 以上を大とし,一元配置分散 分析(η2)は,0.01-0.06 を小,0.06-0.14 を中,0.14 以上 を大として評価した.統計分析には,統計分析ソフト SPSS statics ver 25(IBM 社製)を用いた.
Ⅲ 結 果
1 100m レースシミュレーション中の計測変
数の結果
Table 2 と Table 3 には,100m レースシミュレーショ ン中の平均の時空間パラメーター,Push time,Peak Force および Force impulse のおよび ABS SI の結果を 示した.100m レースシミュレーション中の左右の平均 Push time, Peak force および Force impulse には,統計 上有意な差は認められなかった(Push time;p=0.603, r=0.24,Peak force;p=0.115, r=0.65, Force im-pulse;p=0.340, r=0.43).ABS SI の 95% 信 頼 区 間 は, そ れ ぞ れ Push time が 4.5-19.3%,Peak force が 6.4-15.2%,Force impulse が 6.5-14.2% であった.
2 10m 区間毎の計測変数の結果
10m 区間毎の計測変数において,左右の Push time
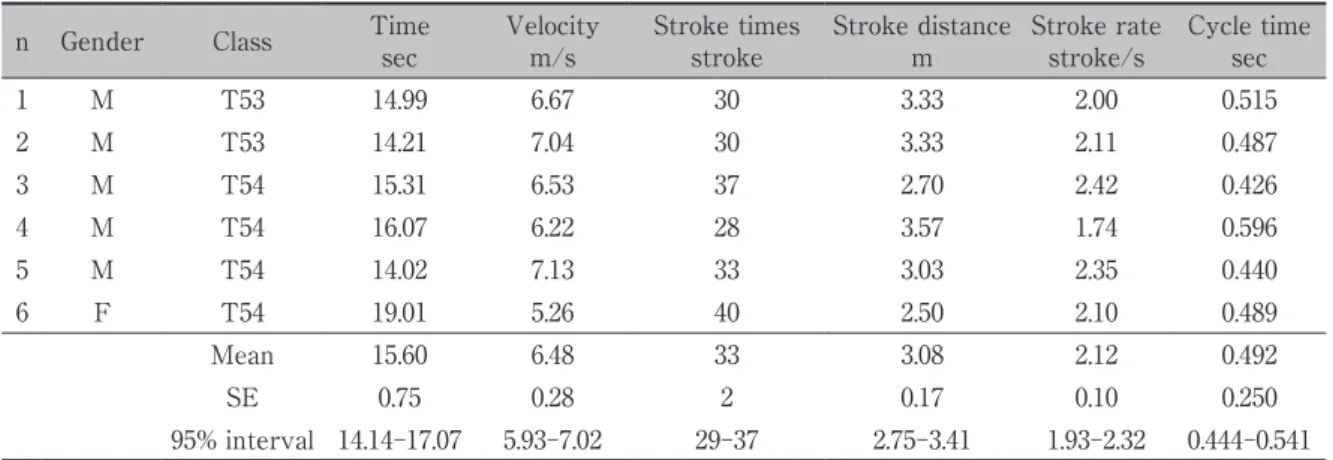
Table 2. Average spatio-temporal parameters during the 100m race simulation.
n Gender Class Timesec Velocitym/s Stroke timesstroke Stroke distancem Stroke ratestroke/s Cycle timesec
1 M T53 14.99 6.67 30 3.33 2.00 0.515 2 M T53 14.21 7.04 30 3.33 2.11 0.487 3 M T54 15.31 6.53 37 2.70 2.42 0.426 4 M T54 16.07 6.22 28 3.57 1.74 0.596 5 M T54 14.02 7.13 33 3.03 2.35 0.440 6 F T54 19.01 5.26 40 2.50 2.10 0.489 Mean 15.60 6.48 33 3.08 2.12 0.492 SE 0.75 0.28 2 0.17 0.10 0.250 95% interval 14.14-17.07 5.93-7.02 29-37 2.75-3.41 1.93-2.32 0.444-0.541
Table 3. Average push time peak forces, force impulse symmetry indexes during the 100m race simulation.
n Gender Class Push time right
と Force impulse には統計上有意な差がみられなかった が,Force impulse の効果量においては,3 区間を除い て,大きな値を示した.一方 Peak force においては, 0-10m 区間(p=0.03, r=0.90)と 20-30m 区間(p=0.03, r=0.90)において右側 Peak force が左側より統計上有
意 に 大 き な 値 を 示 し た(Fig. 3).Push time ABS SI は,スタートから 30-40m 区間まで上昇し,それ以降の 区間は 15% 前後で一定の値を示して ABS SI の距離間 で の 統 計 上 有 意 な 差 は み ら れ な か っ た(F=0.77, p=0.454, η2=0.13).Peak force と Force impulse は,
0.050 0.100 0.150 0.200 0.250 0.300 0.0 5.0 10.0 15.0 20.0 25.0 30.0 0-10 10 -2 0 20 -3 0 30 -4 0 40 -5 0 50 -6 0 60 -7 0 70 -8 0 80 -9 0 90 -10 0 40 50 60 70 80 90 100 110 120 0.0 5.0 10.0 15.0 20.0 25.0 30.0 0-10 10 -2 0 20 -3 0 30 -4 0 40 -5 0 50 -6 0 60 -7 0 70 -8 0 80 -9 0 90 -1 00 Force R Force L ABS SI 2 4 6 8 10 12 14 16 18 20 0.0 5.0 10.0 15.0 20.0 25.0 30.0 0-10 10 -2 0 20 -3 0 30 -4 0 40 -5 0 50 -6 0 60 -7 0 70 -8 0 80 -9 0 90 -10 0
Push time (sec) Peak Force (N) Force impulse (N•s)
Distance (m)
ABS SI (%) ABS SI (%) ABS SI (%)
* 2 2 2 * r =.90 r =.56 r =.90 r =.64 r =.13 r =.56 r =.64 r =.56 r =.56 r =.04 r =.73 r =.13 r =.21 r =.64 r =.56 r =.56 r =.47 r =.39 r =.81 r =.73 r =.30 r =.21 r =.21 r =.21 r =.30 r =.21 r =.13 r =.04 r =.04r =.04 -60 -50 -40 -30 -20 -100 10 20 30 40 -60 -50 -40 -30 -20 -100 10 20 30 40 -60 -50 -40 -30 -20 -100 10 20 30 40 -60 -50 -40 -30 -20 -100 10 20 30 40 -60 -50 -40 -30 -20 -100 10 20 30 40 -60 -50 -40 -30 -20 -100 10 20 30 40 T53 Sub.1 14.99s T54 Sub.5 14.20s T54 Sub.6F 19.01s T53 Sub.2 14.21s T54 Sub.4 16.07s T54 Sub.3 15.31s Push time Peak force Force impulse LR SI (%) Distance (m)
Fig.3 Changes in left and right push time, peak forces, force impulse, ABS symmetry index during the 100m race simulation. ABS SI shows the measurement variables in the upper row.
*; indicates the difference between left and right peak handle force at 10-20m interval (p<0.05). r and η2 indicates the effective size.
Fig.4 Changes in push time, peak force, and force impulse symmetry index of 10m section for each subject.
90-100m 区間で上昇がみられたが,10% 前後で一定の 値を示し,ABS SI の距離間での統計上有意な差はみら れなかった(Peak force;F=0.57, p=0.593, η2 =0.10,
Force impulse; F=0.73, p=0.537, η2=0.13).
3 LR SI の個人差の結果
Fig. 4 には,Push time, Peak force および Force im-pulse の 10m 区間毎の LR SI を被験者ごとに示した. T53 クラスの Sub. 1,2 の選手は,T54 の選手と比較す ると 100m レース全体を通して 10% の変化量の範囲で LR SI の変動がみられたが,T54 クラスの Sub. 3,5,6 選手は,LR SI の変動が大きくなる傾向を示した.パラ リンピックメダリスト T53 クラスの Sub. 1 と T54 クラ スの Sub. 4 選手は,すべての計測変数の LR SI の値が ほぼすべて正の値を示した.一方で,T53 クラスの Sub. 2 と T54 クラスの Sub. 3,5,6 選手は,Push time と Peak force の LR SI の値が逆転する傾向がみられた.
Ⅳ 考 察
1 10m 区 間 毎 の Push time, Peak force,
Force impulse の両側性対称性
本研究の 100m レースシミュレーション中の 10m 区 間毎の計測変数の結果をみてみると,Peak force にお いて,車いすのレースパフォーマンスに影響する(Bar-bosa and Coelho 2017)加速局面の 0-10m 区間(p=0.03, r=0.90) と 20-30m 区 間(p=0.03, r=0.90) で 右 側 Peak force が左側より統計上有意に大きな値を示した (Fig. 3).車いすのプッシュ動作の左右差を検討した先 行研究においては,結論として動作に左右差はみられな いと報告しており,本研究は異なる結果を示した(Goos-ey and Campbell 1998).つまり,動作には左右差がみ られなくても,力の伝達は異なることが示された.先行 研究と本研究結果が異なる理由として,先行研究(Goos-ey and Campbell 1998) の 実 験 条 件 は 4 分 間 の 時 速 14mph(6m/s)の一定速度条件で検討しており,最後 の 1 分間を分析対象としている.ハンドリムへ加えた 3 軸成分の力は,最終的に車輪の接線方向への力が車いす の推進力となり(Chénier et al., 2021),ハンドリムの キャッチからリリースまでの力の伝え方が車輪 Force の左右差に影響していると考えられた.車いすのプッ シュ動作の特徴に,速度領域によって動作の変動性や被 験者の技術差が生じることが報告されている(Sosnoff et al. 2010, Sosnoff et al. 2015).また,両側性運動の左
るが,左右差の大きさより,その差を補償する筋機能を 理解することの重要性を言及していることからも,パラ アスリートにおける左右差の検討は,障がいによる左右 差を補うための補償動作の機能を明らかにすることが競 技力向上と選手の怪我の予防においても重要であると考 えられる.更にパラアスリートの競技力やパフォーマン スの評価には,被験者全体の平均値と同時に,必ず個人 差を考慮した検討と議論が必要であるだろう.このよう なパラアスリートの事例研究は,競技力向上や公平性を 保った障がいのクラス分けのための科学的エビデンスと して役立つだけではなく,この特異的な能力や機能の理 解は,健常者の障がいやそのリハビリテーションへの応 用の可能性が期待されるであろう.
3 本研究の限界と今後の課題
本研究の選手のベストタイムと 100m レースシミレー ションタイムにはばらつきがみられた点においてはいく つかの原因が考えられた.実際の競技会では,タータン トラックであり,路面状況の差が生じたと考えられた. 2 つ目には,大会後や合宿の合間であったため,選手の コンディションが万全でなかった可能性がある. 本研究は,100m レースシュミレーション中の力学的 変数の左右差とパフォーマンスへの関係性について明確 にすることはできなかった.特に車輪 Force impulse の 左右差が,車いすの斜行や蛇行および推進効率にどれく らい影響するのかが今後の検討課題となる.更に障がい クラスによって左右差には個人差が大きく,その左右差 を補うための補償動作の機能を担っている上肢関節間の 発揮トルクや筋群間のシナジーの影響など,動きの原因 を探る検討が必要である.Ⅴ 結 論
本研究の目的は,車いす 100m レースシミュレーショ ン中の力発揮おける両側性対称性の特徴を明らかにする ことであった.その結果,加速局面の Peak force にお いては,左右差がみられたが,車いすの推進力となる Force impulse は,左右の Push time と Peak force を相 互に補償することによって,統計上有意な差がみられな かった.また,両側性対称性はレース全体を通して 6.5-14.2% の範囲を示した.車いすプッシュ動作の力発揮左 右差は,障がいクラスによって影響し,筋出力あるいは 上肢の関節トルク発揮を相補的に代償させていることが 示唆されると同時に,パラアスリートの個人差を考慮す ることの重要性が示された.Ⅵ 参考文献
Athletics WP (2020): https://www.paralympic.org/ athletics/rankingsBarbosa TM and Coelho E (2017): Monitoring the biomechanics of a wheelchair sprinter racing the 100 m final at the 2016 Paralympic Games. European Journal of Physics 38: 044001
Chénier, F, Pelland-Leblanc, J-P, Parrinello, A, Mar-quis, E and Rancourt, D(2021): A high sample rate, wireless instrumented wheel for measuring 3D pushrim kinetics of a racing wheelchair. Med Eng Phys 87: 30-37.
Chow JW and Chae WS (2007): Kinematic analysis of the 100-m wheelchair race. J Biomech 40: 2564-2568 Cohen J (1998):Statistical power analysis for the
behavioral sciences (2nd ed.). Lawrence Erlbaum Exell T, Irwin G, Gittoes M and Kerwin D (2017):
Strength and performance asymmetry during maxi-mal velocity sprint running. Scand J Med Sci Sports 27: 1273-1282
Fiok K and Mróz A (2015): How does lever length and the position of its axis of rotation influence human performance during lever wheelchair propulsion? J Electromyogr Kinesiol 25: 824-832
Fuss FK (2009): Influence of mass on the speed of wheelchair racing. Sports Engineering 12: 41-53 Goosey VL and Campbell IG (1998): Symmetry of the
elbow kinematics during racing wheelchair propul-sion. Ergonomics 41: 1810-1820
Goosey VL, Campbell IG and Fowler NE (2000): Effect of push frequency on the economy of wheelchair racers. Med Sci Sports Exerc 32: 174-181
Hadzić V, Erculj F, Bracic M and Dervisević E (2013): Bilateral concentric and eccentric isokinetic strength evaluation of quadriceps and hamstrings in basket-ball players. Coll Antropol 37: 859-865
Hsiao-Wecksler ET, Polk JD, Rosengren KS, Sosnoff JJ and Hong S (2010): A Review of New Analytic Techniques for Quantifying Symmetry in Locomo-tion. Symmetry 2: 1135-1155
Denis R(2013): Platform for racing wheelchair per-formance enhancement. Conference: XXIV Congress of the International Society of Biomechanics
Korff T, Romer LM, Mayhew I and Martin JC (2007): Effect of pedaling technique on mechanical effective-ness and efficiency in cyclists. Med Sci Sports Exerc 39: 991-995
Kuruganti U, Parker P, Rickards J, Tingley M and Sexsmith J (2005): Bilateral isokinetic training reduces the bilateral leg strength deficit for both old and young adults. Eur J Appl Physiol 94: 175-179 Learmonth YC, Kinnett-Hopkins D, Rice IM,
Dyster-heft JL and Motl RW (2016): Accelerometer output and its association with energy expenditure during manual wheelchair propulsion. Spinal Cord 54: 110-114
Limroongreungrat W, Wang YT, Chang LS, Geil MD and Johnson JT (2009): An instrumented wheel system for measuring 3-D pushrim kinetics during racing wheelchair propulsion. Res Sports Med 17: 182-194
Luk HY, Winter C, O’Neill E and Thompson BA (2014): Comparison of muscle strength imbalance in powerlifters and jumpers. J Strength Cond Res 28: 23-27
Maly T, Zahalka F, Mala L and Cech P (2015): The bilateral strength and power asymmetries in untrained boys. Open Med (Wars) 10: 224-232 Masson G, Begin MA, Lopez Poncelas M, Pelletier SK,
Lessard JL, Laroche J, Berrigan F, Langelier E, Smeesters C and Rancourt D (2016): Contribution of limb momentum to power transfer in athletic wheel-chair pushing. J Biomech 49: 2577-2583
McGrath TM, Waddington G, Scarvell JM, Ball NB, Creer R, Woods K and Smith D (2016): The effect of limb dominance on lower limb functional perfor-mance―a systematic review. J Sports Sci 34: 289-302 Melo CC, Carpes FP, Vieira TM, Mendes TT, de Paula
LV, Chagas MH, Peixoto GHC and Andrade AGP (2020): Correlation between running asymmetry, mechanical efficiency, and performance during a 10 km run. J Biomech 109: 109913
Sadeghi H, Allard P, Prince F and Labelle H (2000): Symmetry and limb dominance in able-bodied gait:
a review. Gait Posture 12: 34-45
Sosnoff JJ, DiBerardino LA, Park K, Rampurawala Z, Daigle S and Hsiao-Wecksler ET:(2010): Com-plexity and Variability in Manual Wheelchair Propul-sion. 16th US National Congress on Theoretical and Applied Mechanics.
Sosnoff JJ, Rice IM, Hsiao-Wecksler ET, Hsu IM, Jayaraman C and Moon Y (2015): Variability in Wheelchair Propulsion: A New Window into an Old Problem. Front Bioeng Biotechnol 3: 105
Steidl-Muller L, Hildebrandt C, Muller E, Fink C and Raschner C (2018): Limb symmetry index in com-petitive alpine ski racers: Reference values and inju-ry risk identification according to age-related perfor-mance levels. J Sport Health Sci 7: 405-415
Vandervoort AA, Sale DG and Moroz J (1984): Com-parison of motor unit activation during unilateral and bilateral leg extension. J Appl Physiol Respir Environ Exerc Physiol 56: 46-51
Vanlandewijck, Y, Theisen, D and Daly, D (2001): Wheelchair propulsion biomechanics: implications for wheelchair sports. Sports Med 31(5): 339-367 Yoshioka S, Nagano A, Hay DC and Fukashiro S
(2010): The effect of bilateral asymmetry of muscle strength on jumping height of the countermovement jump: a computer simulation study. J Sports Sci 28: 209-218
Yoshioka S, Nagano A, Hay DC and Fukashiro S (2011): The effect of bilateral asymmetry of muscle strength on the height of a squat jump: a computer simulation study. J Sports Sci 29: 867-877