首都大学東京 博士(理学)学位論文(課程博士)
論文名
。線による強磁場白色矯星における質量降{の研究(英文)
著者 林多佳由
審査担当者
主査大柄元々
委員 寸η予舳 委員石崎峠、も 委員 み} 手
上記の論文を合格と判定する
平成ユ『年3月Z㌻目
首都大学東京大学院理工学研究科教授会
研究科長旧灯音
DISSERTATION FOR A DEGREE OF DOCTOR OF PHILOSOPHY IN SCIENCE
TOKYO METROPOLITAN UNIVERSITY
TITLE :
X"ray Study ofMass Accretion onto Magnetic White Dwarfs
AUTHOR : Takayuki Hayashi
EXAMINED BY
Examinerinchief /eZ2/.f7,0fu`s4 Examiner V/EL-y;;[,xa-:el
Examiner (iJls7.vt.r.kg q4v,LllLÅía-d,v(4v<i
Examiner ZP7..!de'oCcz.?
Dean
Date
QUALIFIED BY THE GRADUATE SCHOOL OF SCIENCE AND ENGINEERING
TOKYO METROPOLITAN UNIVERSITY
a"tt oal..
IVNe.y-c.k 2S", 2Diz
X-ray Study of Mass Accretion onto Magnetic White Dwarfs
Takayuki Hayashi
DepaTtment of Physics, Tokyo Metropolitan UniveTsity 1-1 MinaM-0hsawa, Habhiol'i, Tokyo 192-0gy9Z Japan
Contents
1 Introduction 7
2 Inter' mediatePolars
2.1 Classification of CVs . . . . 2.1.1 Classical Novae . . . .
2.1.2 Recurrent Nova ....,...
2.1.3 Nova-like Variable. . . .
2.1.4 AM Canum Venaticorum star (AM CVn)...
2.1.5 DwarfNova ...,...
2.1.6 Polars...
2.1.7 IntermediatePolars...•.e•••••••-••••••••••
2.2 BinarySystems ...
2.2.1 RocheGeometry ...
2.2.2 Orbit al Period and System Size . . . . 2.3 Overview of lntermediate Polars . . . .
2.3.1 Mass-Radius Relation of the White Dwarf ...
2.3.2 Distance Determination . . . .
2.3.3 AccretionDisks...,...
2.3.4 Magnetism in White Dwarfs ...
2.3.5 Methods of Measuring Magnetic Fields in White Dwarfs ...
2.3.6 'Alfv6n Radius ... " ...
2.3.7 Accretion Column... v ...,...
2.3.8 Shock discontinuity of the accretion flow . . . .
2.4 Measurement of the White Dwarf Mass in CVs...
2.4.1 WD Mass Estimation with Temperature in mCV ...
2.4.2 Stellar M ass Esti m ation with Bin ary M otion . . . .
2.4.3 The WD Mass Estimation with Nova Light Curve ...
9 9 9 9
10 10 11 11 12 l2 12 13 14 14 l6 .17 18 19 23 25 25 26 26 27 28
3 Accretion Column Structure Models
3.1 History of Post-Shock Accretion Column Modelmg ...-. ...
3.2 Aizumodel ... ...
3.3 Croppermodel ...,...
31
31 32 35
4 X-ray Emission from Optically Thin Thermal Plasma
4.1 IonizationBalance ...,...
4.1.1 Ionization Process. . , . . . . 4.1.2 RecQmbination Process . . . . 4. 1.3 IQn iza. tion Equilibrium and Ionization Fr actions . . . .
4.2 LineEmission...,...
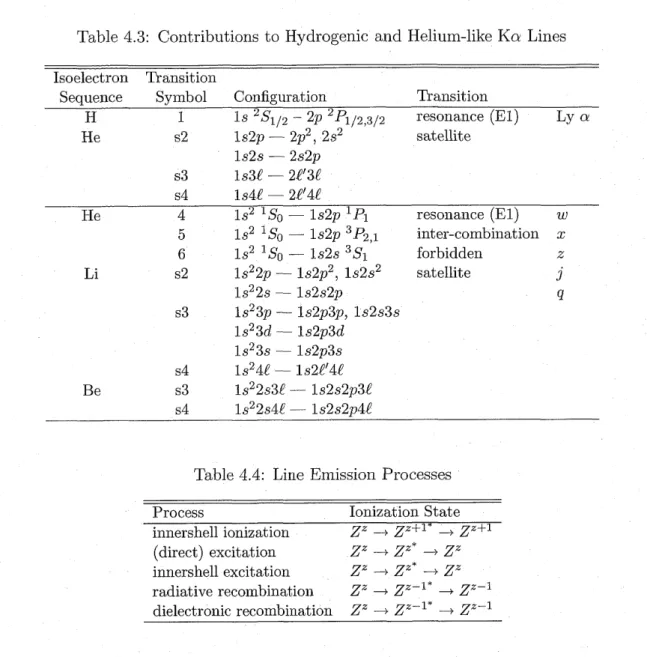
4.2.1 Hydrogenic and Helium-like Ka Lines . . . .
39 39 40 40 41 41 41 3
4
5
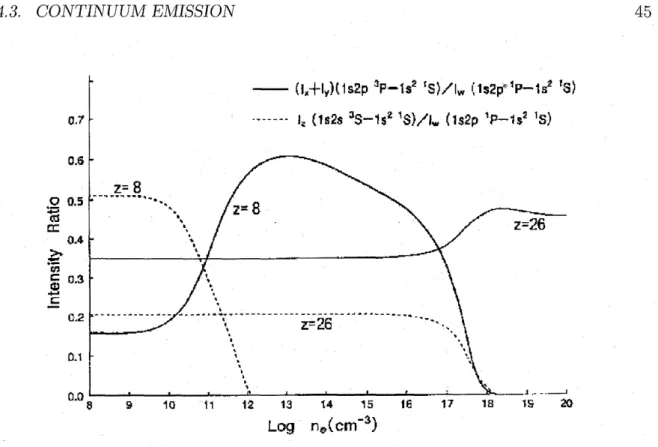
4.2.2 Line Emission from Optically Thin Thermal Plasma 4.2.3 Density Dependence of Line Intensity . . . .
4.2.4 Temperature Dependence of Line Intensity ...
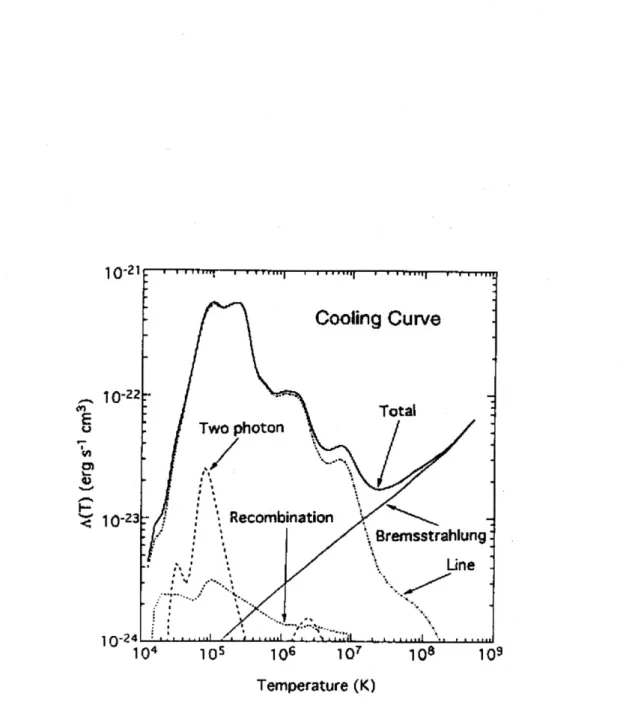
4.3 ContinuumEmission ...
Spectrum Models of the Accretion Column '
5.1 Optically Thin Thermal Plasma Model: cemekl and cevmkl 5.2 Reflection of the Plasma Emission . , . . . .
5.3 AccretionColumnSpectrumModels ...
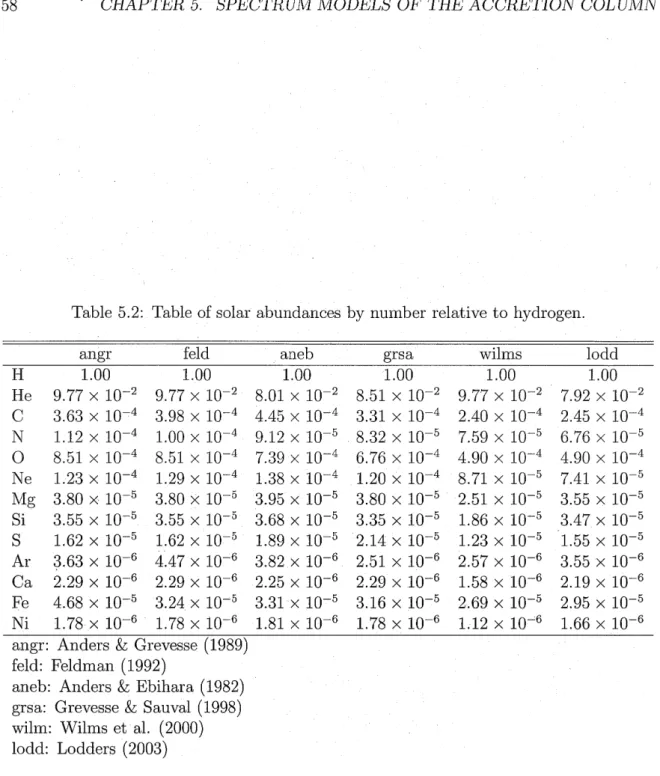
5.4 Definition of Solar Abundances . . . .
5.5 SPEXpackage..."...
CONTENTS ... 42
... 43
... 44
••••••v•• 45 51
Model .... 51
... 53
... 55
... 56
... 56
6 Problems of Accretion Column Structure Model 6.1 Discrepancy of WD Masses... 6.2 Prediction and Observation of Accretion Column Height ... 6.3 Geometry of Accretion Columns . . . , . . . . 6.4 Non-Equipartition between Ions and Electrons . . . . 59 59 60 61 64 7 Construction of New Accretion Column Model 7.1 Sp ecific Accretion Rate D ep endence of Accretion C olumn . . . . 7.2 Involving Dipolar Geometry ...'. ... 7.3 Construction of Spectral Model . . . . 67 67 76 86 8 InstrUme nt at ions 8.1 SzezakuMissionDescription ... 8;1.1 A Brief lntroduction of SuxakzL. . . .'. . . . 8.2 X-Ray Telescopes (XRTs) . . . , . . . . 8.2.1 Basic Components of XRT . . . . 8.2.2 XRT Perform ance in Orbit . . . . 8.3 X-ray Imaging Spectrometer (XIS) . . . , . . . . Overview ofthe XIS ... 8.3.1 8.3.2 Pulse Height Determination, Residual Dark--current Distribution, andHotPixels ...,... 8.3.3 Photonpile-up ...,... 8.3.4 XIS background rate . . . . 8.3.5 Radiation Damage and On-board Calibration of the XIS ... 8.3.6 On-ground event selection . . . . • . • • • , • • • • • • • • • • • t 8.3.7 Cont amination crrection . . . . 8.4 'Hard X-ray Detector ...' 8.4.1 PIN-SiDiodes...I... 93 . 93 . 94 . 96 . 97 . 98 . 102 . 102 . 103 . 104 . 104 . 104 . 105 . 106 . 107 . 108 9 0bservations and Analysis ' 111 9.1 Introduction of V1223 Sagittarii and EX Hydrae . . . , 111
9.2 SzLzakiL O bservations of V1223 Sagittarii and E X Hydrae . . . , 113
9.2.1 Observations ...113
9.2.2 DataReduction...113
9.3 Analysis of V1223 Sagittarii . . . 115
9.3.1 Spectral Analysis . . . , . . . 115
9.3.2 Estimation ofmqss ofWD and comparison with the other observations118 9.3.3 Height and fractional area of the post-shock accretion column ... 119
COIVTENTS
10 New Model Application
10.1 Spectral fitting with Acrad model . , . . . .
10.2Discussion...
10.2.1 Parameters of V1223 Sagittarii . . . .
10.2.2 Parameters ofEX Hydrae ...
10.3 Comparison with Cylindrical Model . . . .
5 121
121 122 125 128 129 11 Conclusion and Future Prospect
11.1 Conclusion... " ...
11.2FutureProspect...
11.3 Analysis and Results . . . .
11.3.1 Timing Analysis'... .,...
11.3.2 Phase-resolved Spectral Analysis for V1223 Sagittarii . . . .
11.4Discussion...
11.4.1 The Nature df the Fluorescent Iron Kcu'Line . . . .
11.5Conclusion...•,...
135 135 137 139 139 140 143 143 146
Chapter 1 Introduction
Mass aecretion is one of the most important mechanisms to power high energy astrophys- ical objects. Matter accreting onto a compact object, such as a black hole, a neutron star, and a white dwarf (WD) converts its gravitational energy into thermal energy and finally releases it by radiation. In strongly magnetized compact objects, the mass accre.- tion occurs via an accretion column which is the plasma accretion flow along magnetic field lines of the compact object. Various models of the accretion column in magnetized WD binary were proposed (H6shi 1973, Aizu 1973, Imamura & Durisen 1983, Frank et al.
1992, Cropper et al. 1999). The gravitational potential of the WDs has been measured by observations of X-ray radiated from the accretion columns and the WD masses were estimated using the models. In some WDs, however, their masses based on the X-ray observations confiict with those estimated by bindry motions and decaying nova Iight curves. In this thesis, we concentrate on a construction of a new accretion column model of the intermediate polar which reflects better the real accretion column structure, and its X-ray spectrum model.
Intermediate polars (IPs) are close binary systems consisting of a rather strongly
magnetized WD (O.1-10 MG) and a low-mass companion star fi11ing its Roche lobe, and are characterized by periodic variation of optical and X-ray light curves at periods in a
range of rv 30 - 4 Å~ 103 s which is associated with WD rotation. Mass accretion from the companion occurs via accretion disk up to around the Alfv6n radius and the accretion fiow is channeled by the WD magnetic field within the Alfv6n radius, The accretion flow forms a steady strong shock close to the WD. The accreting matter is heated up to rv 108 K in the shock, and the matter being ionized falls onto the WD with radiating X-ray.
Some post-shock accretion column structure model were constructed from 1970's.
H6shi (1973) and Aizu (1973) proposed the accretion column structure model for the first time under the assumption that the accretion column is negligibly low relative to the WD radius, that is, the change and the release of gravitational potential along the accretion column is neglected. Frank et al. (1992) involved the release of the gravita- tional potential into the •accretion column structure model and analytically calculated its temperature and density distribution with isobaric assumption. Cropper et al. (1999) numerical}y calculated the physical structure of the accretion column taking into account the gravitational potential release. Theoretical spectra based on the above models repro- duce well the observed X-ray spectra of IPs in general. However, even the most elaborate model of Cropper et al. (1999) has some problems. One of them is discrepancy of the WD masses compared to other estimation methods. Since the X-ray spectra refiects the depth of the WD gravitational potential, we can measure the WD masses in the IPs using the post-shock accretion column structure models. A part of the WD masses Measured by X-ray observation are significantly lighter than those measured with the binary motion
7
8 CHAPTERI. INTRODUCTION
which possesses higher reliability and the decaying nova light curve.
One of the common assumption of the post shock accretion column structure models so far are that for all IPs the accretion rate per unit area is 1.0 g cm-2 s-i which decides
the density of' the' accretion column yet is not verified by any observation. A lower density reduces the radiation cooling and, therefore, the Ionger time is needed for release of the entire energy of the accreting matter, which results in a higher shock height.This effect alters the accretion column structure and especially reduces its maximum temperature which leads to under estimation of the WD potential. The other common assumption is that the accretion column is cylindrical. Although this is a reasonable assumption if the shock height is low enough, the dipole field configuration should be taken into account for the higher shock. The theoretical X-ray spectrum is changed by the consideration of the dipole geoinetry because it raises the energy conversion between heat and bulk motion of the accreting gas due to Laval nozzle effect. The two assumptions provide a harder theoretical X-ray spectrum and may lead to underestimation of the WD masses.
We remove these assumptions and construct a more realistic post-shock accretion column structure model. Furthermore, we build a spectral model, based on the new accretion column model and apply to the S2Lzak2L satellite data of couple of IPs. XIS and HXD detectors onboard SiLzaku retain high throughput and moderate energy resolution at -the iron K-shell energy band and excellent X-ray sensitivity above 10 keV, respectiveiy, where the spectrum of the accretion column is directly obsetved without obstruction of the photoelectric absorption by pre-shock accreting matter.
This thesis is organized as follows; In Chapter 2, we briefly review WD binaries and IPs. In Chapter 3, we refer some of the past accretion column structure models which has been utilized for the WD mass estimation. In Chapter 4, we describe physics of optically thin thermal plasma required to model the observed X-ray spectra. In Chapter 5, we represent the spectrum.models of the thermal plasma and the accretion column. In Chapter 6, we point out some problems of the post-shock accretion column model. In Chapter 7, we construct the new post-shock accretion column structure model and its spectral model. In Chapter 8, we characterize the scientific instruments onboard Suzakze.
In Chapter 9, we review the two famous IPs, V1223 Sagittarii and EX Hydrae and apply the new spectrum model to the S2Lzaku data of •them. In Chapter 10, we discuss our new results in relation to the WD masses. Finally, ChaPter 11 summarizes conclusions of this
thesis and describes future prospects. '
Chapter 2
Intermediate Polars
2e1 Classification of CVs
Cataclysmic Variables (CVs), belonging to a kind of variable stars, are close binary star systems consisting of a white dwarf (WD) (primary star) and a Iow mass main-sequence star or red giant (secondary star or companion star). As the name, CVs vary their brightness drastically on time scale from as short as a few seconds to several years. These systems are very compact, fully fits inside the radius of the Sun (Ro rv 6.96 Å~ 10iO cm).
The WD has a radius as small a.s t•hat of Earth (Rrv5000 km).When the binary system evolves the secondary fills up the Roche-lobe, the secondary begins to be stripped and transferred onto the WD surface due to a strong gravitational field. This mass accretion releases large amounts of gravitational energy, which makes CVs powerfu1 emitters of radiation from infrared to X-ray wavelength and causes the variations either random or periodic. Today, over 800 CVs have been discovered, and a total number of CVs in our galaxy is believed to be approximately 106., CVs have divetse characteristics depending on the properties of WDsand mass accretion rate. In general, CVs are primarily classified by observational properties: strength of the magnetic field and the characteristics of the optical variations. Basic classification of CVs is shown in Figure 2.1.
2.1.1 Classical Novae
Classical novae are known as CVs in which a single nova eruption has recorded Nova eruptions are characterized by a rapid increase of the optical brightness by 6 to >19 mag and a decline lasting from <10 d to hundreds of days. In 1960's, cause of the classical nova eruptions was identified as a phenomenon that hydrogen accumulated from the companion on to the WD surface is compressed and heated due to strong gravity of the WD, and thermonuclear runaways are finally triggered. After an eruption, the ejected matter from the WD surface can be spectroscopically detected as an expanding shell, which helps to distinguish classical nova eruptions from dwarf nova outbursts discussed later. Frequency of the eruptions depends on the WD mass and the accretion rate from the secondary. A typical interval of the nova eruptions are thought to be order of 104-105 yr. Thus there is a single eruption historically recorded for classical novae.
2.1.2 Recurrent Nova
Recurrent novae are defined as the classical novae in which more than one nova eruption has been recorded. Their nova eruptions are also caused by thermonuclear runaways of hydrogen-rich material on the WD surface. Eruption is expected to recur in interval of
9
10 CHAPTER2. INTERMEDIATEPOLARS
cvs
Strong Magnetic Fieid (B > O.1 MG)
Weak
Magnetic Field (B < O.1 MG)
Polars or AM Herculis type (B = 10 •pt--- 230 MG)
Intermediate Polars or DQ Herculis type (B = O.1 --- 10 MG)
Classical Novae
Recurrent Novae Nova'like Variables
Dwarf Novae AM CVn Type
'
"ti igure 2.1: Classes of Cataclysmic Variabies '
'
'
20-80 yr, which is much shorter than the recurrence time scale in classical novae (rv 104 yr). Orbital period of recurrent 'novae (O.75-460 d) is much longer than that of other CVs. The secondary is known not to be a main-sequence star but to be 'a red giant that can provide hydrogen to the WD with larger rate than that of other CVs by an order of magnitude. Thus the hydrogen accumulation time can be much shorter and the time interval to recur eruption also becomes shorter. The mass. of the white dwarfs in recurrent novae are thought to be close to the Chandrasekhar limit. ,
2.1.3 Nova-like Variable
Nova-like variables include CVs similar to classical, recurrent or dwarf novae from which no outbursts have been observed.'Mass transfer rate in their disks is so stable that the , overall brightness varies only slightly around its mean level. In addition, since the mass transfer rate in disks is much higher than that of dwarf novae in quiescence, the outermost part of the accretion disk is kept in a high temperature state and thus very bright. Hence nova-like variables can be represented as a dwarfnova which stays in outburst at all time.
'
2.1.4 AM Canum Venaticorum star (AM CVn) ,
' '
'
'AM CVn was first discovered in 1967 (Smak 1967). AM CVn stars are characterized by a very short orbita! period at 5-65 min and the ab'sence of hydrogen features but of, helium lines. Since the primary is close to the secondary in such a short orbital period, the secondary should no longer be main-sequence star, There are two possibilities for the secondary, i.e. secondary is a degenerate (or semi-degenerate) WD, or a •the main- sequence star left after the end of hydrogen burnin"g. AM CVn stars are powered by the mass accretion from Roche-lobe fi11ing secondary to its companion star through the inner Lagrangian point. Currently, atotal of 13 objects are known (Nelemans 2005). '
2.1. CLASSIFICATIONOFCVS
2.1.5 DwarfNova
11
Dwarf novae have recurrent outbursts in which the optical brightness increases typically by 2-5 mag - a luminosity increase by a factor of 10-100, this increase is much smaller than that of classical novae. The outbursts last from a few days to several weeks and recur regularly on time scale from rvlO days to tens of years, which is well-defined for each object. In 1855, J.R. Hind discovered the first dwarf nova "U Gem", which is so famous and typical that it becomes a subclass name of dwarf novae. Over 400 dwarf novae are known at present. Based on the morphology of the light curve of optical outburst, dwarf novae are divided into three subclasses, named after the first star discovered of that class; the U Gem, SU UMa and Z Cam classes.
es
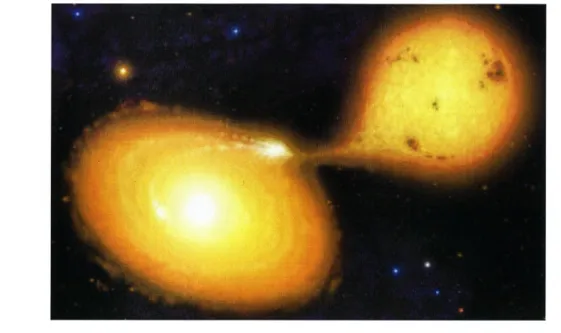
Figure 2.2: Schematic view of non-magnetic dwarf and a low mass main-sequence star.
http://www.space-art.co.uk/.
cataclysmic variable Image copyrighted
conslstlng
by Mark
of a white A. Garlick
2.1.6 Polars
Polars are categorized as Magnetic CVs (mCVs), called AM Herculis Type Stars, whose WD have a strong magnetic field (10-230 MG). The WD rotates synchronously with the orbital motion due to the strong magnetic field. Since matter fi11ing up the Roche lobe of
the secondary star is captured by the magnetic field lines and accretes onto the magnetic pole, the accretion disk can not be formed around the WD as shown in Figure 2.3. Hence, polars do not exhibit outbursts originating from the accretion disk. A shock standing close to the WD surface around the magnetic pole, called "accretion column", is formed.The shock heats the accreting matter up to more than 108 K, and consequently forms a hot plasma to radiate the hard X-ray emission. Although the hard X-rays originated from the hot plasma are intriguing to investigate, we refrain from the detail explanation as the polars are not main subject of this thesis because the cooling mechanism involving cyclotron cooling is too complex.
12 CHAPTER2. INTERMEDIATEPOLARS
2.1.7 IntermediatePolars
Intermediate polars, also called as DQ Her type stars, have a magnetic field as strong as O.1-10 MG. An accretion disk can exist, however the disk is truncated at the Alfven radius. The schematic view of intermediate polar system is shown in Figure 2.3. Because the outer part of the disk is present, outbursts occur sometimes. The magnetic field of the WD of the intermediate polar systems can not strap the rotation of the secondary star to their orbital motion due to mildly weaker magnetic field. Matter captured by magnetic field is funneled to the magnetic poles, and shock-heated near the white dwarf surface as in the case of polars.
Figure 2.3: Schematic view of magnetic cataclysmic variables, polar systems(left) and Intermediate polar systems(right).
2.2 Binary Systems
Binary systems are consist of two stars orbiting around their common gravity center. The WD is called the primary and the other star is called the companion star or secondary for CVs.
2.2.1 RocheGeometry
The effective potential energy of a binary system in a frame of reference rotating with the system can be written as (Frank et al., 2002).
Åëeff(r)=-1.G-M.i,1-1.G-M.2,t-i(wÅ~r)2 (21)
where ri and r2 are the position vectors of the primary and secondary, Mi and M2 are their masses, and cv is the angular frequency vector ofthe orbital rotation (lw1 = 2r/Porb).
The last term of the equation represents the centrifugal force due to the orbital motion.
Figure 2.4 shows a cross-section of the equipotential surface of <b.ff(r) drawn according to the equation (2.1) in the orbital plane for a binary with M2/Mi = O.25. The saddle point of the equipotential surface Åë.ff(T) between the two compact stars is called the
"inner Lagrange point Ll", and the volumes enclosed by the two equipotential surfaces segregated at Ll are called "Roche lobes". The effective forces from the two stars at Ll
in the rotating reference frame exactly balance. When the secondary star becomes larger and fiIls its Roche lobe, its material is transferred into the Roche lobe of the primary star
via the Ll. The stream of gas via the Roche lobe overflow initially moves on a ballistic trajectory and later, depending on the white dwarfs magnetic field, forms an accretion disk in case of the non-magnetic CVs which has a weak magnetic field.
24
ikLi
iiii:il
-•)]>
liiSSI
..s-xxx Ll
Ilssi,,,,IIII
Å~Åé5 )))))))
iiJJJJZf
Figure 2.4: A cross section in the orbital plane of the Roche equipotentials crossing the Lagrange point Ll (ipR), for binary system with mass ratio q=M2/Mi=O.25. Mark of CM indicates the center of mass. The saddle points of the potential are the inner and outer Lagrange points Ll-L3. L4 and L5 are indicative of the poles.
2.2.2 Orbital
The orbital period surable parameter.
Period and System
of CVs is usually the most, From Kepler's third law,
Size
and quite often, the only precisely mea-
(;.:,)2= G(M'.I M2) (2 2)
or a= 3sÅ~ lo'o (MMoi )i/3 (1 + q) '13 (;okb)2/3 cm, (2 3)
where G is the gravitational constant, P.,b is the orbital period, Mi and M2 are the masses of the primary (WD) and the secondary, respectively, q =- M2/Mi is the mass ratio, a is the semi-major axis ofthe orbit, and Mo represents the solar mass (1 Mo E 2.0Å~1033 g). Here we normalized the orbital period to 1 hour, a typical value for CVs. From equation (2.3), typical size of the CV system is rv Ro (1 Ro E 6.9 Å~ 10iO cm).
Because the secondary star in CVs fi11s its Roche lobe, its radius is determined by the geometry of the Roche lobe which many authors have calculated the approximate
14 CHAPTER2. JNTERMEDIATEPOLARS
formulas for (see e.g., Warner 1995 p.33). Here we adopt the formula for the secondary obtained by Paczyriski (1971), which is valid in the range of O < q < O.3:
!it' ==o462 (1\q) i/3 (2 4)
Then the mean density of a lobe-fi11ing secondary becomes
p'2= gÅí4#2 =1oÅ~lo2 (:Orhb)-2 gcm-3, (2 s)
which is in the range of the typical low mass main sequence stars. If the secondary is indeed a low mass main sequence star, the empirical mass-radius relation derived by
Patterson (1984), . ' •
so .. (MMo)088 (2 6)
can be used. Then, the mass of the secondary becomes
il4ig ==oo7(;orhb)i22 (2 7)
'
'Thus, we can estimate the mass of the secondary from its orbital period by using equation '
2.3 Overview of Intermediate Polars
In 1934, a amazingly short period of 71 sec was found in the study of the light curve of the remnant of Nbva Herculis (= DQ Herculis) (Walker (1954), Walker (1956)). Twenty years later, the discovery of the X-ray pulsars and s'uccess of the rotating neutron-star model in accounting for their properties led a suggestion that the pulsation in DQ Her also arose from the rapid rotation of an accreting compact star, with a WD replacing the usual neutron star. Since.radial accretion into the deep gravitational potential well of the WD ought to produce hard X-rays, a weak pulsed X-ray expected to be detected.
Actually, other pulsating X-ray sources had been discovered by the Einstein Observatory, with properties much more closely resembling cataclysmic variable than neutron star X- ray binaries (Cordova et al., 1981). Furthermore, the circular polarization was detected in BG Canis Minoris, which strongly suggest the presence of a rv 4 Å~ 106 G magnetic field (Penning et al., 1986). Polarization has also been observed in PQ Geminorum (Piirola et al., 1993). These studies have now finally established the basic correctness ofthe magnetic
rotator model for the lP class. ,, z
2.3.1, Mass-Radius Relation ofthe White Dwarf
WD supports itself against gravity by the pressure of degenerate electrons instead of the thermal pressure of nuclear burning. This fact, however, was not clear to astronomers before the development of quantum physics. In 1926, Dirac and Fermi formulated Fermi- Dirac statistics, and Fowler applied the statistics to compact stars that hold up them.- selves from gravitational collapse with electron pressure. Chandrasekhar (Chandrasekhar (1931), Chandrasekhar (1939)) calculated the structure of a zero-temperature star based
2.3. 0VERVTEWOFIIVTERMEDIATEPOLARS 15
on the equation of state for a Fermi-Dirac gas of non-interacting electrons; the mass- radius relation of WD a fundamental equation which describes the stellar structure. He also discovered a limit of white dwarf mass nv 1.4 Mo called "Chandrasekhar limit".
Hamada and Salpeter (1961) comprehensively treated white dwarf models, including the corrections to the equation of state derived by Chandrasekhar (Salpeter, 1961). Their corrections for the electrostatic interactions between electrons and nuclei, gave improve- ment to a status of white dwarf with smaller radii and larger central densities compared with Chandrasekhar's models of the same mass. In case of the model at low derisities and that inverse 6-decays alter the value of pa., the inverse of the number of electrons per unit atomic mass, at high densities, the model undergoes a significant change from Chandrasekhar's model. Since those correction are determined by ps., and atomic numb. er Z, the mass-radius relation depends on the composition of the white dwarf. Figure 2.5 shows the mass-radius relation derived by Chandrasekhar and Hamada & Salpeter (1961) together with three observational data, taken from Shapiro & Teukolsky (1983). Thus, if the mass and radius of the white dwarf can be precisely determined by observations, it constrains the composition of the white dwarf from this figure.
2.4 2,2 2.0 i.P 1.6 e 1.4 sc ce 1.2
8' 1.0 O.B e.fi D.4 O.2
MgX t" He NN Sx
N ,t ,
ks
x N s
Fe N
N N", Nx SN,.,
NN NN SN
N
4e Eri B xpt
N N s k
N{s
Stein 205t Ns
NNN s N s s
NNNN Sirius B
NN
xx -x NN NN NS NN NM
XM9 "s
eq Fe xCX
e,2S U,S e,75 1.0 1.25 1.S
M .t•V yM
Figure 2.5: The relation between mass M, and radius R, for zero-temperature stars com- posed of 4He, i2C, 24Mg, and 56Fe. The dashed curves denote Chandrasekhar models, the upper one for pa. = 2, and the lower one for pa. == 2.15. These curves are calculated by Hamada & Salpeter (1961). The figure also shows the measured data of Sirius B, 40 Eri B and Stein 2051 with la error boxes that derived from optical observations: Gatewood
& Gatewood (1978) for Sirius, Heintz (1974) for 40 Eri B, and Strand (1977) for Stein 2051. Figure' taken from Shapiro & Teukolsky (1983)
Ostriker & Hartwick (1968) determined the equilibrium structure of the white dwarf including an internal magnetic field, and found that a relatively small ratio of magnetic to gravitational energies will produce an appreciable increase in the radii of white dwarfs.
Nauenberg (1972) obtained an analytic approximation to the mass-ra.dius relation of the
16 CHAPTER2. INTERMEDIATEPOLARS
white dwarf at zero temperature, applying a variational principle. This can be witten as
RwD = O7sÅ~lo9 [(1.44Mo)2/3 - ( MwD
MwD 1.44Mo
)2/3 ]1/2 [cm],
(2.8)
which agrees excellently with the calculation by Hamada & Salpeter (1961) on the con- dition of pa, = 2. Figure 2.6 shows plots according to equation (2.8). Nauenberg (1972) also investigated the electrostatic correction, modifications due to rigid and differential rotation, and effect of a stored magnetic field, and obtained fairly good agreement with previous numerical results.
Koester & Schoenberner (1986) pointed out that the mass-radius relation significantly deviates from Hamada & Salpeter (1961) zero temperature model, especially at an effective temperature above 4 Å~ 104 K. Vennes et al. (1995) computed mass-radius relations for low-mass white dwarfs with non-zero effective temperature, which is strongly dependent on the effective temperature and the composition of the white dwarf (Figure 2.6).
cc!i'
ii2Z
O.03
O.02
O.Ol
o
ureCWD : :
-- t- e•- --
: ', pure He WD
-- --
Nauenberg (1972)
O 05 1 1.5
MIMo
Figure 2.6: Mass-radius relation for low mass white dwarfs with non--zero temperature, composed of 4He and i2C (Vennes et al., 1995). The relation for zero temperature WD by Nauenberg is drawn in black solid curve. Relations for pure He WD and pure C WD are also shown in red line and blue line, respectively. Solid curves and dashed curves correspond to the effective temperature of 4.9 Å~ 104 K and 6.1 Å~ 104 K, respectively.
2.3.2 DistanceDetermination
The distance to cataclysmic variables can be determined by measuring a stellar parallax which is the most precise method. Since accuracy of the parallax measurement depends on angular resolution, high-resolution telescope better than an arcsec is required. For
example, the Fine Guidance Sensors on the Hubble Space Telescope or Hipparcos can measured the distance farther than 1000 light year. Since the parallax of distant objects
is small, the estimation error increases with distance. Another method to measure the distance is to observe the proper motion of the CV and compare it with the proper motion of nearby stars. Warner (1987) used this method to estimate the distance to RU Pegasus.
2.3. 0VERVIEWOFINTERMEDIATEPOLARS 17
Other methods utilize the spectral properties of the secondary star. Bailey (1981) described a method for determining the distance to CVs based on the observed K (2.2psm) magnitudes and the surface brightness of the secondary star in the K-band which is only weakly dependent on the spectral type. Warner (1987) used Bailey's method to derive the distance to CVs as a function of only the secondary K-band magnitude and the orbital period of the system. The equation was given by
K
log d(pc) = g - O.93 + 1.0731og P(hr) P,< 6.5 hrs '
'K
= g-T2.14+2.561ogP(hr) 12>P>6.5 hrs,
where K indicates the K-band magnitude. However, since a contribution from the ac- cretion disk is assumed to be negligible, ,this method actually provide a lower limit of distance.
2.3.3 Accretion Disks
As the matter accretes into the accretion disk via the Ll, gravitational potential energy of the matter is converted into kinematic energy. The matter at a particular radius in the disk orbits the white dwarf with the Keplerian velocity at that radius,
v = v(llM
(2.9)
Viscous and a differential rotation in the disk generate the internal friction between a inner ring and outer ring of the disk. The internal friction converts kinematic energy of the matter into thermal energy. The viscosity also transports the angular momentum of the matter from inner to outer radius. The matter, hence, slowly drift toward the white dwarÅí The radial velocity in the disk is quite smaller than the Keplerian velocity. Since the velocity at the inner disk is higher than that at the outer, the disk is heated up to higher temperature at' inner radii. Temperature at the innermost radius of the disk reach roughly 105 K. If we assume an Qptically thick accretion disk, an annulus at a particular radius in the disk radiates a blackbody of temperature T.ff. The temperature T.ff at a radius R can be written by
T.ff = [3GsM..lililCiD (i-v/Il:l)]e, (2 io)
where M is the accretion rate, MwD the white dwarf mass, a the Stefan-Boltsmann constant, and Ri. the inner disk radius. The temperature is proportional to R-3/4 at a sufliiciently large radius. Above formulation of the accretion disk was developed by Shaku'ra & Sunyaev (1973), who assumed some ideal condition for the accretion disk as
follows;
e Ignore self-gravity of the accretion disk ) e The disk is in stable state
'
e Axial symmetrical disk,
e Geometrically thin disk (H/R) << 1,
18 CHAPTER2. IIVTERMEDJATEPOLARS
e Optically thick disk,
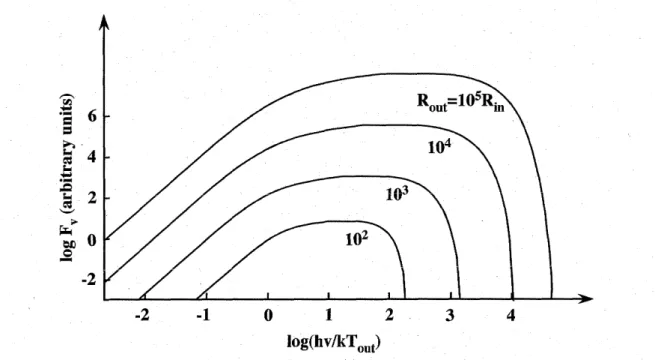
Here H and R denote a half thickness of the accretion disk and a radius of the disk, re- spectively. In addition to these assumptions, they introduced so-called cu parameter that connects the viscous stress to the gas and radiation pressure. The formulation of geomet- rically thin accretion disk was successfu1 to represent spectra from the accretion disks in CVs from infrared to ultraviolet wavelength. The emission from the disk represented by equatioh (2.10) is called "Disk Blackbody emission". Figure (2.7) shows an example of the disk blackb6dy spectrum summed up the contribution of each annulus.
Ate6
z, :.4
.w.
E2->
in. o
NO -2
Rout=105Ri.
103 104
102
-2 -1
log(hvlkT,.t)
3 4
Figure 2.7: The continuum spectrum F. of a steady optically thick accretion disk radiating Iocally as a blackbody, for disks with different ratios R..t/Rin.
2.3.4 MagnetisminWhiteDwarfs
Since the discovery of the first isolated magnetic WD (mWD) Grw+7008047, the number of stars belonging to this class has grown steadily. The isolated mWDs comprise rv 5%
of all WDs, while the mCVs comprise N 25oro of all CVs. The magnetic fields range from rv 3 Å~ 104 - 109 G in the former groUp with a distribution peaking at 1.6 Å~ 107 G, and N 107 - 3 Å~ 109 G in the latter group. The space density of isolated mCVs with fields in the range N 3 Å~ 104 -109 G is estimated to be N 1.5 Å~ 10-4 pc-3 (Wickramasinghe &
Ferrario, 2000). The mCVs have a space density that is about a hundred times smaller.
About 80% of the isolated mWDs have almost pure H atmospheres and show only hy- d-rogen lines in their spectra (the magnetic DAs), while the remainder show He I lines (the
magnetic DBs) or molecular bands of C2 and CH (magnetic DQs) and have helium as the dominant atmospheric constituent similar to the non-magnetic WDs. Mixed composition (H and He) might relate to the magnetic field of the mWDs. There is growing evidence based on trigonometric parallaxes, space motions, and spectroscopic analyses that the isolated mWDs tend as a class to have a higher mass than the non-magnetic WDs. The mean mass for 16 mWDs with well-constrained masses is S O.95 Mo. Magnetic fields
2.3. 0VERVIEWOFINTERMEDJATEPOLARS 19
may therefore play a significant role in angular momentum and mass loss in the post- main-sequence phases of single star evolution affecting the initial-final mass relationship, a view supported by work on cluster mWDs. The progenitors of the vast majority of the isolated MWDs are likely to be the magnetic Ap and Bp stars.
Zeeman spectro$copy and polarimetry, and cyclotron spectroscopy, have variously been used to estimate magnetic fields of the isolated mWDs and the WDs in mCVs and to place strong constraints on the field structure. The surface field distributions tend in general
to be strongly non-dipolar and to a first approximation can be modeled by dipoles that are offset from the center by rv 10-30oro of the stellar radius along the dipole axis. Other stars show extreme spectral variations with rotational phase which cannot be modeled by off-centered dipoles. More exotic field structures with spot-type field enhancements appear to be necessary.
The emission from mCVs is usually dominated by radiation from accretion shocks on the surface of the mWD, and most systems have therefore been detected from X-ray surveys.
The mWDs in the polars are magnetically phase locked to the companion star (P,pi.
= Porb). These systems do not have accretion disks. The magnetic nature of the polars is revealed by the strong circular and linear polarization of the optigal-to-near-IR radiation which is a defining characteristic of this class. The polarized radiation is thermal (T rv
2-30 keV) cyclotron emission from the accretion shocks, as was confirmed by the discovery of resolvab]e cyclotron lines in the optical spectrum of VV Puppis (Visvanathan & Wick- ij'amasinghe, 1979). While only a handful of isolated magnetic white dwarfs are known
to' rotate, all the magnetic white dwarfs in the polar systems have measured rotation periods in the range Ay80 minutes to rv8 hr. When the mass transfer rate drops below a certain level, the bare phQtosphere of the mWD is revealed. The Zeeman intensity and polarization spectra (when available) provide strong constraints on the surface averaged field (B N 107-108 G) and on field structure. In addition, cyclotron spectroscopy provides direct information on magnetic field strengths at the accretion shocks.
The spin periods of the mWDs in the IPs are shorter than orbital periods (typically Pspin rv (1/10)Porb), and an accretion disk is generally present. Their magnetic nature is generally deduced indirectly through the presence of a coherent modulation in the X-rays and/or the optical which is different 'from the orbital period, but a few systems also have measured optical-IR circular polarization arising from accretion shocks. The photosphere of the bare white dwarf has so far not been revealed, cyclotron lines also have not been measured from the accretion shocks. However, there are several lines of argument which suggest that IPs as a class have mWDs of lower fields (B S 107 G) than in the polars (Patterson, 1994).
2.3.5 Methods of Measuring Magnetic Fields in White Dwarfs
There are three methods to measure the magnetic field strength of WDss cyclotron har- monics, Zeeman splitting spectroscopy, and halo Zeeman lines. These measurements are all achieved in infrared to optical band. The former two metheds are used for both iso- lated WDs and mCV, although the cyclotron technique mainly used for mCVs and the Zeeman spectroscopy for isolated objects. The halo Zeeman method is applicable only to a limited subset of mCVs. ,
Cyclotron harmonics
The cyclotron harmonics appear when free electrons are placed in a magnet field. The
20 CIIAPTER2. JNTERMEDIATEPOLARS
'
kinetic energy of electrons perpendicular to magnetic field is quantized into Landau levels;
' '
Eeyc == htuc(n+5) (211)
= O12 (loB,G) (n+S) eV, (2 12)
where cv. !E iiltcB. is the cyclotron frequency, h is the Dirac's constant, and n is the prin-
cipal quantum number. For WDs, this can be observed as line emissions, emergent from optically thin hot atmospheres near their magnetic poles. 'For mCVs with typical field of rv 30 MG, the'fundamental harmonic corresponds to O.3 eV, and higher harmonics come into the optical band. For reference, neutron stars exhibit cyclotron harmonics in the hard X-ray band, since they have field strength of about 10i2 G. The resonance in neutron stars appears in absorption rather than emission, because plasmas on the neutron star surface are optically thick.
When bulk doppleic effect in the hot plasma is taken into account, the cyclotron har- monic energies become (Bekefei 1966)
wn(=' Ecyc/h) =" 1- s\/ ,o,oElli'L, (2 13)
where 6 is the electron bulk velocity in light units, the subscript ll means the parallel component to the field, e is the viewing angle to the field line , or = pm, and blc/7 is the fundamental cyclotron frequency for relativistic electrons of masses orm,. Since 5" changes significantly along the hard X-ray emisson region on the magnetic poles of an mCV, the cyclotron lines are generally broadened, although this effect vanishes if the accretion column is viewed nearly side-on (e rv 900). As a result, the cyclotron lines often smeared out when the magnetic poles of an mCV is viewed pole-on, a$ shown figute 2.8.
Even when the poles are viewed nearly side-on, the cyclotron lines are broadened by ther- mal Doppler effects (expressed by or in equation (2.13) in the hot plasmas of temperature 10- 30 keV. This broadening reach rv 1000 A in optical band.
Zeeman Spectroscopy
The Zeeman effect is caused by electrostatic interactions between ma' gnetic momenta of bound electrons and the external magnetic field. The splitting energy is described as
AEzeeman == 2ÅíIZ,B ==58Å~10-2 (loillG) eV (2 14)
Since we can resolve a splitting of some hundreds A(rv 10-2 eV) in the optical band, the Zeeman spectroscopy becomes a powerfu1 method for investigating the field structure of WDs. Usually, the Zeeman technique is applied to absorption lines, produced by hydrogen or helium in the atmosphere of WD. An example for isolated WD is shown in figure 2.9.
For mCVs, this method is usable during low state, when the photospheric emissions from the WD dominate over the accretion-powered radiation. Some mCVs show photospheric Zeeman lines and cyclotron lines simultaneously as in figure 2.10. This usually occurs when the system is in a state of intermediate activity so that the cyclotron component is strong but does not overwhelm the contribution from the photosphere of WD.
Halo Zeeman lines
The other method of measuring magnetic fields in the polar type systems is through
2.3. 0VERVIEWOFINTERMEDIATEPOLARS 21
o 16eo
v2
'E 16• se
oo cvooE
m
•,ct
17•50
17•OO
go 7- 1750
gE ls.eo .g co< 18•50
a Brightphase
b Faintphase
VV Puppis
'
l
3900 4500 5100 S700 6300
Wavetength in angstroms
Figure 2.8: Bright (Side-on) and faint (pole-on) phase spectra of VV Puppis in its 1979 low state of accretion (from Visvanathan & Wickramasinghe 1979). The bright-phase spectrum shows broad cyclotron emission features centered at 6300,5500,4800,and4100A corresponding to harmonic numbers 5, 6, 7, and 8, respectively, at a field of 32 MG.
to"
$R e! :
esato
i 5
th
se L9o"N
s g
.
t}o-ke:e MF"e ro !SF"-12p--Set•2 3!9•Sixt 2eO•3d-1
b""-
"
21X)-Sto
so-"-t
2pat-
ldO-5t.1
NN<P-S,O
N NN
y..../-=----
-4"
-.f-2t.tt..D
='-:'-'2T.ft-4-co--
N'4P't
ItP't'SeO
N x"t :
: 2p.t-3dO
10-e-e-
,:
,wy.h.,Nl""-"-'Vv""-ti'vh...x.th
to-::A, 7.Nvt";
r'vav'",...`".M,....rwN
io,te-paitvde
N'tx,,tv•'vvv•) :
T
.-L---.4ooo sooo GOOOWAVELENGTH roooIN ANGSTROMS eooo eooo
Figure 2.9: Bottom : intensity spectra of Grw+7008247. Top : Magnetically shifted component as a function of magnetic field strength in gauss. Wavelength coincidences of "turnaround" components with absorption feature in the spectra are indicated by vertical lines; dashed lines are used when component behavior has not yet been rigorously calculated. The obtained magnetic field strength is about 320 MG.(Angel et al., 1985)
22 CHAPTER 2.INTERMEDIATE POLARS
so
sg F 2Ss
:.
o
- - O.OS
gd
fi
l
:t 2.0
1.5
1.0
4soe 6000 ssoe eooo
Vaveteneth (A)
esoo ?oeo
4000' SOOO 6000 rm 8000 9000 VAVELENGTH
Figure 2.10: Top panel: Observations of V834 Cen showing both photospheric Zeeman (B, = 31 MG, a. = -O.1) and cyclotron lines (B. == 23 Å} 1 MG) obtained at phase O.55 compared with models from Ferrario et al. (1992). Bottom panel: Observations of IRXS JO12851.9-233931 showing a strong cyclotron line in the red band (B. = 45 Å} 1 MG) and a photospheric Zeeman spectrum with B = 36 Å} 1 MG (Schwope et al. 1999). Copyright Monthly Notices of the Royal Astronomical Society and Astronomy and Astrophysics, reproduced with permission.
2.3. 0VERVIEWOFIIVTERMEDIATEPOLARS 23
detection of "halo" Zeeman features of hydrogen. These features were first detected in absorption during a high state of V834 Cen (Wickramasinghe et al., 1987) at phases when cyclotron emission from the shock dominated in the optical band (figure 2.11). The halo Zeeman lines are seen only when the cyclotron continuum is strongest (i.e., when the shock is viewed nearly perpendicular to the field direction) and disappear at other phases. They can therefore readily be distinguished from photospheric Zeeman lines (cÅí the spectrum of V834 Cen in figure 2.10 obtained when the system was somewhat fainter).
The halo Zeeman lines are attributed to free-falling cool material in the vicinity of the shock (Wickramasinghe et al., 1987). Achilleos et al. (1992) modeled the thermal structure of this gas and showed that the required temperatures could be provided by hard X-ray heating due to radiation from the shock. There is generally very close agreement between fields determined using cyclotron lines and halo Zeeman features, and in the absence of cyclotron line field determinations, the halo field can be taken to be the field strength at the accretion shock, to within a few percent.
sseo tt60C} s4eo
• ANGsTftcms
52oo 7ooe 7soe
Figure 2.11: Observations of V834 Cen during a high state showing a Zeeman-split Ha line against a strongly modulated cyclotron continuum. The field strength BH = 23 MG deduced for the halo is very close to the cyclotron field strength B. = 23 M (Wickramas- inghe et al,, 1987). The "halo" lines are formed in cool gas very close to the accretion shock and are seen only at some phases.
2.3.6 Alfv6n Radius
As the magnetic pressure of the WD in a closed binary overcomes the ram pressure,'the accreting matter falls along the magnetic field. For a dipole-like magnetic field, the field
strength B varies roughly as
B r- -!!!
T3 (2.15)
at radial distance r from the WD radius RwD ; here pa = BwDRivD is a constant (the magnetic moment) specified by the surface field strength BwD at r = RwD Thus there is a magnetlc pressure
p-ag == (i/l) gl?ÅÄ = (II/t ) ps 2
8Tr6' (2e16)
24 CHAPTER2. INTERMEDIATEPOLARS
where pao is magnetic permeability, increasing steeply as the matter approaches the stellar surface. This magnetic pressure will begin to control the accreting matter and thus disrupt t'he infall at a radius rM where it first exceeds the ram pressure and gas pressures of the matter. For highly supersonic accretion, it is the ram p'ressure term pv2 which is important, with the velocity v close-to the free-fall value vff = (2GM/r)i/2 and lpvl given
with the accretion rateMbyM=4rr2pv: '
M
I,ovl =
4rr2' (2.17)
rll]hus setting P.ag(TM) = pv2ir. we find
(f/ ncsTrRf2 (2GM)i/2M4rrk/2 (2.18)
"
or
rM = 51Å~lo8 (MwDMo)-i/7 ( 1016 g s'1M ' -2/7
)(/ NI030
pa
G cm3
4/7>
cm.
1
(2.19)
When a WD has BwD f>t 104 G and RwD c>t 5 Å~ 108 cm, the order of magnitude of equa- tion (2.19) suggests that observable effects are quite possible in system's w-h-ere a,e.cretion
takes place onto a mWD. It is often convenient to replace M in equation (2.19) in terms of the accretion luminosity, which. is more direbtly related to the observational quantities, especially for X-ray sources. Thus, using L = GMwDM/RwDi
' ' '
TM = 55Å~108(MMWoD)hl/7(li]lgWcDm)-2/7 . (io33 eLrg s-i) -2/7 (io3o g cm3)4/7 cm (2 2o)
with parametrizations appropriate for WDs. Of course the estimates equation (2.19) and equation (2.20) of rM are rather crude. However, since P..g is such a steep function of radius (rv rin6) we may hope they are acceptable at least in an order-of-magnitude sense.
The quantity rM is known as the Alfv6n radius.'
For T S RA, the accretion stream is strongly affected by the magnetic pressure, and the accretion disk becomes distupted at O.5 RA. Sine this becomes comparable to the binary separation in the case of CVs equation (2.3), a polar sYstem generally lacks an accretion disk. In contrast, intermediate polars are thought to have accretion disks, because Alfv6n radii are much smaller than their binary separations. The schematic view of the mass accretion in polars and intermediate polars is shown in figure 2.12. Inside the Alfv6n radius, the infalling gas is guided along field lines to accrete radially close to the magnetic poies of the white dwarf, haVing a free-fall velocity as
..- 2GMWD (2'21)
f
= 3.6Å~
RwD
MWD(O.5 Mo)i/2 ( 109 cmRwD) -1/2 (2e22)
2.3. 0VERVIEWOFINTERMEDIATEPOLARS
Secotirlt7"v Aoctetloti Sttean)
25
N
---i:
x
'i-Å~' N-.t--.--.--t .
"'-.h..
Sko,,gtvMagtre Wttite Owatt tB-3xIo7G)
" ' ,-,. .,, .,, it'".(t;f,t"-,..
ii•,,/•is• ,Ei.,•li/l•i•,l'l,I,,,l.l.ii.lii,,,ic,.l,,11Illilli:'/,;''f•Li-
-JS' i HVt Ft •A•'
'
Figure 2.12: A schematic view of mass accretion in a polar system (top; Cropper (1990)) and an intermediate polar system (bottom; Patterson (1994))
2.3.7 AccretionColumn
The accretion column is accretion flow channeled by the strong magnetic field of WDs or neutron stars. In intermediate polars, in particular, the accretion disks are disrupted at Alfv6n radius and the accreting matter channeled by the WD's magnetic field within Alfven radius. The steady strong shock is formed and the accreting matter is heated up to rv 108 K by energy release of the WD gravitational potential. The shock surface is believed to be close to the WD surface. As the physical structure of the accretion column is main topics of this thesis, the structure will be described in detail in the next chapter.
2.3.8 Shock discontinuity ofthe accretion flow
In crossing the shock front, the well aligned bulk flow of pre-shock matter is randomized, so that its motional energy is converted into thermal energies to heat up the gas. Thus, the temperature T, the density p, and bulk velocity v change discontinuously there. Let us consider an ideal gas with specific heat ratio (or adiabatic index) of 7. The Rankine- Hugoniot relations describe the discontinuity conditions as
Povo = povo2+Po = 5vg+,!ifl/i =
PIVI, PIV? + Pl,
12 7
EVi + Pl
ty -1 pi
(2.23) (2.24) (2.25)
where subscript "O" and "1" represent pre- and post-shock, respectively. Writing
.= 71-g'•y=ft"
a3 = 7PO, ao = Y', ao po
(2.26) (2.27) (2.28)
26 CHAPTER2. INTERMEDIATEPOLARS
we can rewrite equation (2.24) and,equation (2.25) as
m,2 (1 - i) == Yi l, . . . . (2.2g)
• ms(,-f,)..2(y,x-lii), (23o)
where ao and a are pre-shock sound speed and Mach number, respectively. Assuming x : 1 and y ; 1, equation (2.29) and (2.30) give
pi vo (or+1)va,2
X=: T, ==q== (or-1)m,2+27 (2.31)
' ' P, 27a,2-(7-1)
. (2.32)
Y= TI == ty +1 .
With the equation of state,
Ti Pi po [2or vao2 - (7 - 1)] l(or - 1) vao2 + 2] , ,
E76'FPopi= (or+1)2va,2 ' (2t33)
'
'In the mass accretion onto mCVs, we assume the gas to be an ideal one with or = 5/3.
Because the pre-shock temperature (typicallyN50 eV), is much lower than the kinetic energy of its b,ulk motion (rv a few tens keV), the pre-shock stream is highly supersonic, and the shock must be a strong one, that is .ta(o >> 1. Therefore, equation (2.31), equation (2.32) a'-nd equ'ation (2.33) give
ty-1 1• . .
Vi = or+IV9f4VO, .. (2.34)
;l =='/2,ial,,i,==`P-,sOha,,.,, [2,3,Zi
T, ,= 2ry((tyor-+11))",aZo2T, == iilia,2T, (237)
' '
'2.4 Measurement ofthe White DwarfMass in < Vs
tt
'
In this thesis, we construct the certain WD mass estimation method using X-ray. There- fore some WD measurement methods are introduced in the sectibn.
2.4.1 WD Mass Estimation.with Temperature in mCV
The WD mass can be measured with temperature refiecting the gravitational potential of the WD. Since, in mCV referred in section 2.3.7 and 2.3.6, the pre-shock velocity reaches vff which is described by equation (2.22), the matter is shock-heated to a temperature of
kT,=.2(orty(or+-i)i,)(2GRM.gD/ag)kT, ' (2.3s)
' • 4(or - 1) GMwDpaMH
= (7+1)2 Rw. '. • (.2.39) 3GMwDpmH .
=g R..,, . (2•40)