i
Development for electrochemical modification
approaches of carbon and advances towards the
surface reaction of anions
Satrio Kuntolaksono
(Doctoral Program in Life Science and Green Chemistry)
Dissertation submitted to the Graduate School of
Engineering in partial fulfillment of the requirements for
the degree of Doctor of Philosophy in Engineering at
Saitama Institute of Technology
ii
Acknowledgements
First, the author would like to thank my beloved supervisor, Dr. Hiroaki Matsuura, for his academic guidance and devoted efforts during my doctoral degree in Saitama Institute of Technology, Japan. Pursuing doctoral studies in Japan was like a dream that the author had for several years ago and the author really appreciated and never forget that Dr. Hiroaki Matsuura who believed in me and gave me the amazing opportunity of joining his group which made that dream really come true. Dr. Matsuura is extraordinary, dynamic, energetic, good management planner, and an inspiring example as a scientist and researcher. Those are important for me to be a role model for my future career. While studying in his lab, the author found myself growing in academically, time-managed, and professionally. The author am truly grateful for all the lessons he taught me. Thanks to his guidance the author learns to be a more goal-oriented person and always put the best of myself into every task encountered. In addition, the author would like to thank him for his patience, time, discipline, hard work, and commitment to help me in the whole work during three years of my study.
iii
Prof. Uchida is a senior professor at Saitama Institute of Technology. The author would like to thank Prof. Sato for his guidance during X-ray Photoelectron Spectroscopy (XPS) observation. He teaches me a lot about this measurement. On the last, the author would appreciate and a lot of thank you to Prof. Uchida. He assistant and help me during Scanning Electron Microscope (SEM) measurement. He teaches me very closely, severely, and cautiously.
Next, the author would like thank to Prof. Junichi Takahashi (Emeritus Professor, Obihiro University of Agriculture and Veterinary Medicine) who introduce to me with (†) Prof. Osamu Hamamoto (formely SAIKO Inovation). Then, Prof Hamamoto introduces me to Prof. Shunichi Uchiyama (currently President of Saitama Institute of Technology). Finally, Prof. Uchiyama had introduced my name to Dr. Hiroaki Matsuura. In addition, the author would say thank you to Prof. Hiroshi Hamana for give me a support, the valuable advice about the defense of dissertation, gentleman smile to me, and other kindly thing.
iv through the last year my doctoral degree.
Last, this acknowledgement would not be complete without thanking my parent and family, who supported me throughout my entire study and living cost in Japan. Thanks to the loving support from my father, finally I was able to finish my study. Especially, my mother who in heaven, your son has been finished the study. The author really misses you mom. You are my main inspiration. Then, special to my future wife, thank you for your time, support, and every section accompanying me, the author really appreciates it.
The author hopes you will enjoy reading my doctoral thesis and have a nice day.
v
Dedication
vi
Declaration
This is to certify that to the best of my knowledge, the content of this dissertation is my own work under controlled with my supervisor. This dissertation has not been submitted for any degree or other purposes.
The author certifies that this dissertation is the product of my own work and that all the assistance received in preparing this dissertation and sources have been acknowledged.
vii
List of publications
1. Satrio Kuntolaksono and Hiroaki Matsuura, “Coulometric Analysis of Nitrite Using Electrochemically Activated Carbon Felt Electrode”, Sensors and Materials,
31(4), 1215-1224 (2019).
2 Satrio Kuntolaksono, Chihiro Shimamura, and Hiroaki Matsuura, “Electrochemical Detection for Sulfite Using Glassy Carbon Electrode Modified by Electrodeposition of Platinum Particles on Nitrogen-Containing Functional Groups”, Electrochemistry, 88(5), 441-443 (2020).
viii
Contents
Dedication
………. iiAcknowledgments
……… iiiDeclaration
………. viList of Publications
………. viiList of Figures
……… xiiList of Tables
………...xviiiChapter 1 General Introduction
1.1. Introduction of Carbon Materials ………. 11.2. Surface Modification of Carbon Materials……… 6
1.3. Application in Chemical Analysis………. 9
References……… 11
Figures and Tables………... 16
Chapter 2 Simple Electrochemical Modification of the Carbon
Electrode Surface with Nitrogen Atoms and Platinum Nanoparticles
2.1. Introduction of Nitrogen-Containing Functional Groups on the CF Electrode Surface ………. 212.1.1. Abstract………. 21
2.1.2. Introduction ………. 22
2.1.3. Experimental Section……… 24
ix
2.1.5. Conclusions ... 29
References ………... 30
Figures and Tables………... 32
2.2. Electrodeposition of Platinum Particles with Nitrogen-Containing Functional Groups on the Carbon Electrode Surface... 39
2.2.1. Abstract ……… 39
2.2.2. Introduction ………. 40
2.2.3. Experimental Section ... 42
2.2.4. Results and Discussion………. 44
2.2.5. Conclusions ………. 47
References……… 48
Figures and Tables……… 50
Chapter 3 Potential-Controlled Coulometric Analysis of Nitrite Using
Aminated Carbon Felt Electrode
3.1. Abstract ………. 583.2. Introduction ………... 59
3.3. Experimental Section ……… 62
3.4. Results and Discussions ……… 65
3.4.1. Electrochemical Performance of Nitrite ……….. 65
3.4.2. Analytical Performance Using Coulometry for Detecting Nitrite……… 67
3.5. Conclusions……… 70
References……… 71
x
Chapter 4 Electrochemical Performance of Pt Particles Deposited on
N-Containing Functional Groups: Application to Sulfite Detection
4.1. Abstract ………. 86
4.2. Introduction ……….. 87
4.3. Experimental Section ……… 90
4.4. Results and Discussions ……… 92
4.4.1. Electrochemical Behavior of PtNF-GC Electrode……… 92
4.4.2. Effect of Concentration of Sulfite and Scan Rate………. 94
4.4.3. Study of Spike Recovery ………. 95
4.5 Conclusions ………. 96
References ………. 97
Figures and Tables ………. 99
Chapter 5 Electrochemical Sensor of Sulfite Using Electrodeposition
of Pt Particles Nitrogen-Containing Functional Groups Prepared by
Stepwise Electrolysis
5.1. Abstract ……… 1085.2. Introduction ………... 109
5.3. Experimental Section ……… 112
5.4. Results and Discussions ……… 114
5.4.1. Sulfite Sensor Performance ………. 114
5.4.2. Interference Study ……… 115
xi
xii
List of Figures
Figure 1.1 Modification techniques for carbon materials ... 16
Figure 1.2 Method of modifying carbon electrode surface by covalent bonding ... 17
Figure 1.3 Method of modifying carbon electrode surface by electrolysis ... 18
Figure 1.4 The illustration of general schematic system at chemical sensor ... 19
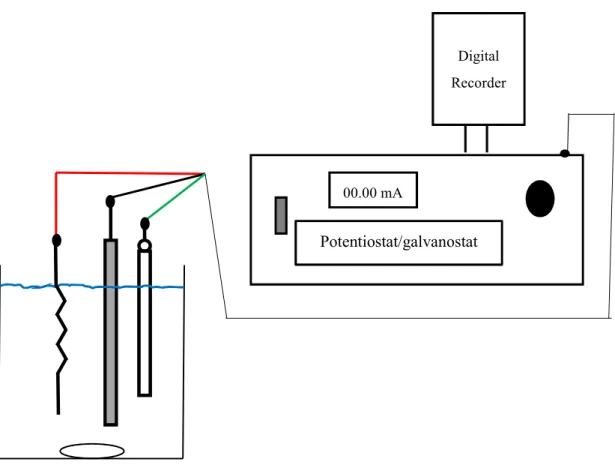
Figure 2.1 Schematic diagram between potentiostat/galvanostat consisting of three electrodes: a working electrode (black line), a counter electrode, (red line), and reference electrode (green line) which is connected with the digital recorder .... 32
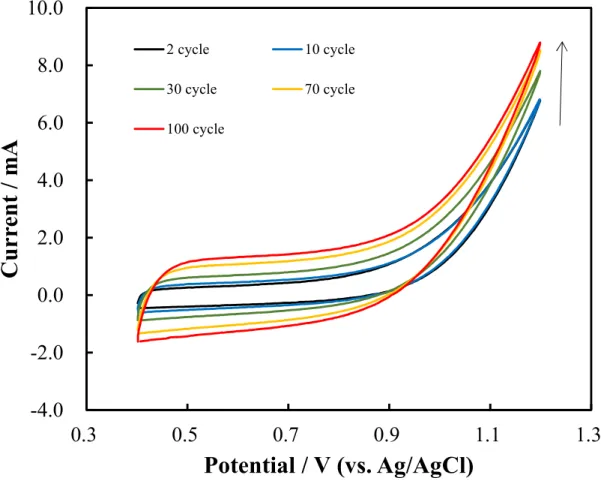
Figure 2.2. Cyclic voltammetry observed by using carbon felt electrode in 0.1 M ammonium carbamate (pH 9.3) aqueous solution at different number of cycles. Applied potential: +0.4 V to +1.2 V. Scan rate: 50 mV/s. ... 33
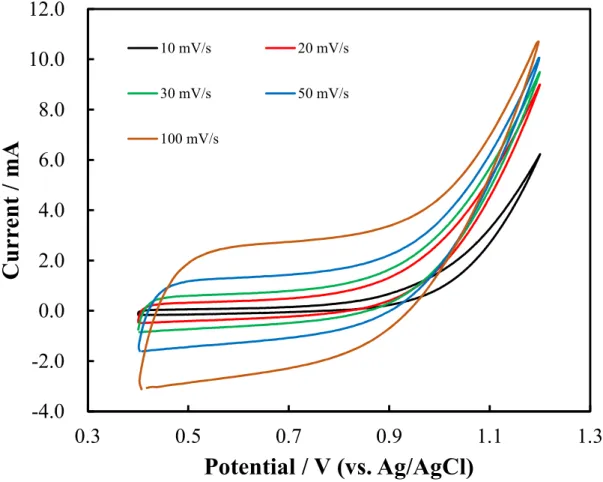
Figure 2.3. Cyclic voltammetry observed by using carbon felt electrode in 0.1 M ammonium carbamate (pH 9.3) aqueous solution at different scan rates ... 34
Figure 2.4. Observation best applied potential during electrode oxidation process correspond with time process by using a bare carbon felt electrode and recorded at digital recorder. The electrolyte solution: 0.1 M ammonium carbamate aqueous solution (pH 9.3) ... 35
xiii
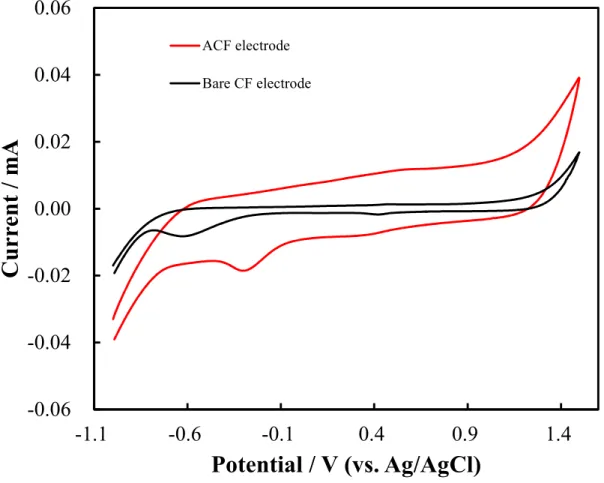
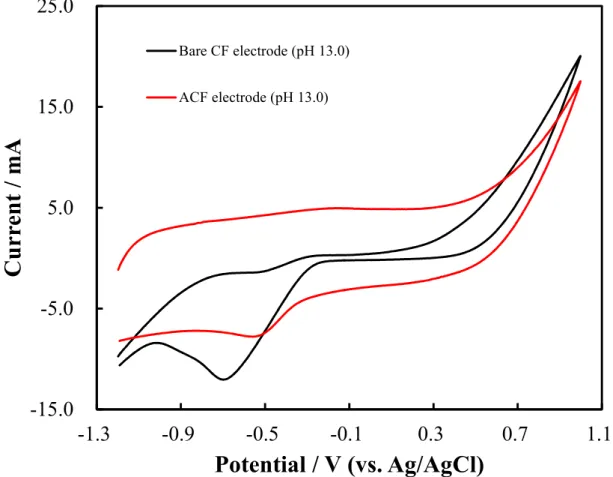
Figure 2.7. Cyclic voltammetry observed by using bare CF electrode (black color) and ACF electrode (red color) in 0.1 NaOH solution (pH 13.0). Scan rate: 50 mV/s. 38 Figure 2.8. Observation at digital recorder to select the best time in the electrode
reduction process using different electrode (red color: Pt-GC electrode) and (black color: Pt-NGC electrode). The supporting electrolyte solution: 1.0 M sulfuric acid and the applied potential: -1.1 V. ... 50 Figure 2.9. Scanning Electron Microscope (SEM) image of a bare CF electrode. .... 51 Figure 2.10. Scanning Electron Microscope (SEM) image of Pt-NCF electrode ... 52 Figure 2.11. XPS spectra of Pt 4f by using (a) Pt-NCF electrode and (b) Pt-CF electrode
with 10 minutes of ultrasonic treatment. ... 53 Figure 2.12. Cyclic voltammetry observed by using Pt-NGC electrode (blue line) and Pt
disk electrode (red line) in 0.5 M H2SO4 (pH 0.0). Scan rate: 50 mV/s... 54
Figure 2.13. Cyclic voltammetry observed by using Pt-NGC electrode (blue line) and Pt disk electrode (red line) in 0.1 M phosphate buffer solution (pH 7.0). Scan rate: 50 mV/s. ... 55 Figure 2.14. Cyclic voltammetry observed by using Pt-NGC electrode (blue line) and Pt
disk electrode (red line) in 0.1 M NaOH (pH 13.0). Scan rate: 50 mV/s. ... 56 Figure 3.1. Schematic illustration of the potential-controlled coulometric sensor. A:
sample addition; B: aminated carbon felt electrode; C: acrylic plate; D: ion exchange membrane; E: carbon felt electrode; F: Pt lead wire ... 76 Figure 3.2. Cyclic voltammograms of aminated carbon felt electrode with (solid line) 10
xiv
Figure 3.3. Cyclic voltammograms of aminated carbon felt electrode (solid line) and unmodified carbon felt electrode (dotted line) with 10 mM of nitrite. Supporting electrolyte: 0.1 M acetic acid buffer solution (pH 4.0), scan rate: 20 mV/s... 78 Figure 3.4. Cyclic voltammograms of aminated carbon felt electrode in various
concentration of nitrite. Supporting electrolyte: 0.1 M acetic acid buffer solution (pH 4.0), scan rate: 20 mV/s. ... 79 Figure 3.5. Cyclic voltammetry of aminated carbon felt electrode with 0.1 mM of nitrite
at different scan rates. Supporting electrolyte: 0.1 M acetic acid buffer solution (pH 4.0), scan rate: 20 mV/s. ... 80 Figure 3.6. Relationship between response time and electrical charge versus applied
potential with 1.0 mM of nitrite. Supporting electrolyte: 0.1 M acetic acid buffer solution (pH 4.0), sample volume: 10 μL ... 81 Figure 3.7. Relationship between current responses versus time curve obtained for
repetitive measurement of 1.0 mM of nitrite. Supporting electrolyte: 0.1 M acetic acid buffer solution (pH 4.0), working potential: +0.75 V, sample volume: 10 μL ... 82 Figure 3.8. Relationship between electrical charge and amount of sample addition.. 83 Figure 3.9. Current versus time curve obtained by measurement of nitrite, (a) 5.0 mM;
(b) 3.0 mM; (c) 2.0 mM; (d) 1.0 mM; (e) 0.5 mM; (f) 0.3 mM; (g) 0.2 mM; (h) 0.1 mM. Supporting electrolyte: 0.1 M acetic acid buffer solution (pH 4.0), working potential: +0.75 V, sample volume: 10 μL……… 84 Figure 3.10. Relationship between electrical charge and various concentration of nitrite.
xv
Figure 4.1. Cyclic voltammograms of Pt-NGC electrode; (red color) absence and (black color) presence of 5.0 mM sulfite. Supporting electrolyte: 0.1 M phosphate buffer solution (pH 7.0), scan rate: 50 mV/s ……….. 99 Figure 4.2. Cyclic voltammograms of different electrode materials in the presence of 3.0
mM sulfite. Supporting electrolyte: 0.1 M phosphate buffer solution (pH 7.0), scan rate: 50 mV/s ………... 100 Figure 4.3. Cyclic voltammograms with various concentration of sulfite at Pt-NGC
electrode. Supporting electrolyte: 0.1 M phosphate buffer solution (pH 7.0), scan rate: 50 mV/s ……… 101 Figure 4.4. Cyclic voltammograms with various concentration of sulfite at Pt-NGC
electrode. Supporting electrolyte: 0.1 M phosphate buffer solution (pH 7.0), scan rate: 50 mV/s.……… 102 Figure 4.5. The relationship between the concentration of sulfite and the oxidation peak
current at Pt-NGC electrode. Supporting electrolyte: 0.1 M phosphate buffer solution (pH 7.0), scan rate: 50 mV/s ……….. 103 Figure 4.6. Cyclic voltammograms containing of 5.0 mM of sulfite with varying scan
rates at Pt-NGC electrode. Supporting electrolyte: 0.1 M phosphate buffer solution (pH 7.0) ……… 104 Figure 4.7. The influence of (ν)1/2 on the peak current (Ip) of 5.0 mM of sulfite at
Pt-NGC electrode. Supporting electrolyte: 0.1 M phosphate buffer solution (pH 7.0) ……… 105 Figure 4.8. The influence of log(ν) on the peak potential (Ep) of 5.0 mM sulfite at
xvi
Figure 5.1. Selection the best-working potential in amperometric sensor containing 500 μM of sulfite at Pt-NGC electrode. Supporting electrolyte: 0.1 M phosphate buffer solution (pH 7.0), rotating speed: 550 ± 50 rpm ………. 121 Figure 5.2. Comparison of the amperometric response with the successive addition of
100 µM of sulfite at various electrodes. Supporting electrolyte: 0.1 M phosphate buffer solution (pH 7.0), working potential: +0.6 V, rotating speed: 550 ± 50 rpm …... 122 Figure 5.3. Calibration curve of the current response (ΔI) with different concentrations
of sulfite at Pt-NGC electrode. Supporting electrolyte: 0.1 M phosphate buffer solution (pH 7.0), working potential: +0.6 V, rotating speed: 550 ± 50 rpm ………... 123 Figure 5.4. The linear relationship between current response (ΔI) and concentrations of
sulfite at Pt-NGC electrode. Supporting electrolyte: 0.1 M phosphate buffer solution (pH 7.0), working potential: +0.6 V, rotating speed: 550 ± 50 rpm …………... 124 Figure 5.5. Amperometric response for 10 successive measurements of 80 µM of sulfite
at Pt-NGC electrode. Supporting electrolyte: 0.1 M phosphate buffer solution (pH 7.0), working potential: +0.6 V, rotating speed: 550 ± 50 rpm ……… 125 Figure 5.6. Amperometric measurement containing 100 μM concentrations for various
interference substances at Pt-NGC electrode. Supporting electrolyte: 0.1 M phosphate buffer solution (pH 7.0), working potential: +0.6 V, rotating speed: 550 ± 50 rpm ……….. 126 Figure 5.7. Amperometric response of two different sulfite concentrations with 100 µM
xvii
M phosphate buffer solution (pH 7.0), working potential: +0.6 V, rotating speed: 550 rpm ……… 127 Figure 5.8. Amperometric response of 200 μM sulfite in two different sample solutions
xviii
List of Tables
Table 1.1. Instrumentation method based on the chemical analysis ………... 20 Table 2.1. The atomic ratio for each element which consist on the Pt-NCF electrode and
Pt-CF electrode after 10 minutes ultrasonic treatment ... 57 Table 4.1. Analytical results of sulfite oxidation peak current and spike recovery of 5.0
mM of sulfite from test solution with different kinds of interference at Pt-NGC electrode……… 107 Table 5.1. Comparison of amperometric sensor for sulfite detection………. 129 Table 5.2. Recovery test results of sulfite from red wine with the various concentrations
1
Chapter 1 General Introduction
1.1. Introduction of Carbon Materials
Carbon is an element with symbol C and atomic number 6. It is nonmetallic and tetravalent, such that it forms four bonds to other atoms or can accept four electrons and become stable. Consequently, a new compound can be created by the formation of new bounds with carbon. One of the example is benzene, which is a cyclic hydrocarbon, where each carbon atom is a part of a ring with six members and bonded to only one hydrogen atom. All carbon-carbon bonds in the benzene molecule are identical in length. In addition, according to the molecular orbital theory, benzene involves the formation of three delocalized π – orbitals covering all six-carbon atoms, whereas the valence bond theory describes two stable resonance structures for the ring. One such representation includes the molecular structure of benzene as a superposition of the multiple benzene rings than single benzene ring. This type of structure is called the resonance hybrid of the benzene molecule. Benzene can be combined and connected with multiple benzene rings to form two or three layers, as well as spheres, ovals, or tubes. The various structures of formed with benzene are called carbon allotropes, which consist of fullerenes,1 carbon nanotube (CNTs),2 and graphene.3
In 1985, Kroto et al. discovered a new allotrope of carbon, called fullerene.1,4,5 Fullerene has sp2- and sp3- hybridized carbon.6 Fullerene is soccer ball-like molecule with a diameter of ~0.7 nm,6,7 which consists of 60 carbon atoms (C60), and contains no
2
pentagon-hexagon bonding (5-6 bonding).9,10 The lengths of 6-6 and 5-6 bonding have been calculated as 1.39 and 1.45 Å, respectively. The electrons are more localized on the 6-6 bonding than on 5-6 bonding.11 The addition of carbon atoms to the C60
spherical equator produces oblong molecules with formulas of C70, C76, C84, etc.12,13 The
fullerenes are commonly used as catalysts, lubricants, and biomedical.14In 1991, the second family formed by the carbon allotropes included the one-dimensional CNTs.15 CNTs have attracted significant interest because of their electronic and mechanical properties, as well as interesting physical properties such as metallic or semiconducting characteristics depending on the chirality of the carbon atoms in the tube. There are two types of CNTs. Single-walled CNTs (SWCNTs), consist of a single graphene sheet rolled seamlessly to form a cylinder with a diameter of 1 nm and length of up to centimeters.15 Multi-walled carbon nanotubes (MWCNTs) consist of an array of such cylinders formed concentrically and separated by 0.35 nm, similar to the basal plane separation in graphite.16 MWCNTs can have diameters from 2 to 100 nm and lengths of tens of microns.17 In addition, MWCNTs can occur in various morphologies such as hollow tube, bamboo, and herringbone. The morphologies of the CNTs depend on their mode of preparation.18 CNTs are prepared either by the arc-discharge method, which is used to prepare C60 and C70 fullerenes, or by chemical vapor deposition on metal
3
graphene was discovered as a new two-dimensional carbon allotrope24 with sp2 hybridization.25 Graphene is the thinnest known material and a basic building block for constructing many carbon materials. Graphene can be rolled into one-dimensional CNTs and assembled into graphite structure. If pentagons are added into the graphene structure, it can be wrapped into a spherical fullerene shape. Graphene has received significant attention because its unique properties, including high surface area, electronic conductivity, excellent mechanical, optical, thermal, and electrochemical properties, rendering it as an attractive topic in physics, chemistry, and material science.26 The excellent mechanical properties include a Young’s modulus of 1.0 TPa, stiffness of 130 GPa, and optical transmittance of ~97.7%.26
4
with carbon fiber. As it is similar to carbon fiber, CF is extensively employed in electrochemical, energy, and environmental sector. Another important member of the graphite family is GC. GC is prepared by heat-treating various polymers, often polyacrylonitrile. The polymer is heated under pressure in an inert atmosphere at 1000-3000 °C, the temperature range in which the heteroatoms evaporate until only carbon remains.15,30 The C-C bonds in the polymer backbone do not break at these temperatures, such that carbon can form graphitic planes of the only limited size with La
(layer sheet direction) and Lc (interlayer spacing and crystalline size along c-axis) in the
5
6
1.2. Surface Modification of Carbon Materials
Surface modification involves the modification of the surface areas of the carbon electrode materials to afford new surface structures. The main purpose of the surface modification of the carbon electrode material is to introduce specific catalytic centers in typically inactive and electron-conducting materials. This can be beneficial achieving high performances and improving both the selectivity and sensitivity.
7
generated at high pressure; however, it should start forming from a low pressure before entering argon to avoid contamination by the residual gases. To understand the principle of this method, several types of sputtering techniques have been utilized by the researchers, which include plasma sputtering,41-44 unbalanced magnetron sputtering,45-47 electron cyclotron resonance sputtering,48-53
Next, the top-down modification/chemical modification method is described. The principle of the top-down modification method involves the utilization of the carbon material whose the surface is modified by chemical process. Three types of modifications, including acidic modification, basic modification, and electrodeposition are employed. One example is the activated carbon material. The acidic modification of the activated carbon surface involves a typical wet oxidation technology using HNO3,
H2O2, H2SO4, citric acid, and other oxidant.40 The numbers and types of
8
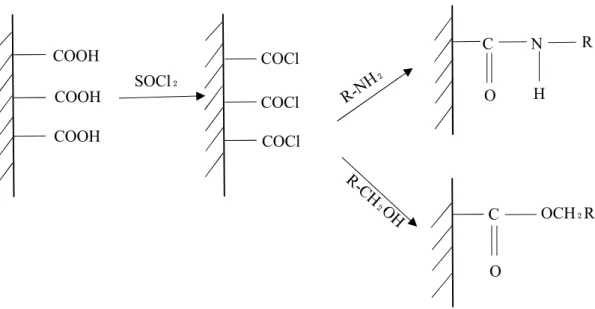
graphene/carbon material surfaces. Numerous methods for the modification of carbon material surfaces by introducing various functional groups on their surfaces are available. For example, by air oxidation (i.e., heating in air) or treatment with chromium acid solution, the carbon atoms can be modified into oxygen-containing functional groups such as carboxyl groups (-COOH), which can be further converted into amines (R-NH2), esters, and alcohols (R-CH2OH). Heating and refluxing in thionyl choride are
9
1.3. Application in Chemical Analysis
Chemical analysis is the study of the chemical composition and structure of a substance (physical properties). This involves the identification, characterization, and measurement of the chemical species in a sample. Analytical chemistry includes two types of analysis, qualitative and quantitative analyses. Qualitative analysis is the determination of the elements and compounds present in the sample of an unknown substance. Quantitative analysis is the determination of the amount (by weight) of each element or compound present.
There are two types of methods available in analytical chemistry: classical and instrumental methods.62 Classical methods are sometimes called wet-chemical methods. These methods are a group of analytical methods that only require the use of chemicals, balance, calibrated glassware, extraction, distillation, boiling or melting points, and gravimetric and titrimetric measurements. In contrast, the instrumental methods include analytical measurements (conductivity, luminescence, spectrophotometry, photometry, calorimetry, electrochemistry, light absorption, spectroscopy, fluorescence, chromatography, and electrochemistry) performed using instrumentation, as summarized in Table 1.1. The advantages of instrumental methods in comparison to the classical methods include higher sensitivity, higher accuracy, and rapid detection. For this reason, the instrumental methods are more popular than the classical methods.
10
11
References
1. R. E. Smalley, Rev. Mod. Phys., 69, 723 (1997).
2. S. Berber, Y. K. Kwon, and D. Tomanek, Phys. Rev. Lett., 84, 4613 (2000). 3. A. K. Geim and K. S. Novoselov, Nat. Mater., 6, 183 (2007).
4. B. S. Kademani, V. L. Kalyane, and V. Kumar, SRELS J. Info. Mana., 39(4), 409 (2002).
5. S. Ahmad, IETE Tech. Rev., 16(3-4), 297 (1999).
6. H. W. Kroto, J. R. Heath, S. C. O’Brean, R. F. Curl, and R. E. Smalley, Nature., 318, 162 (1985).
7. H. W. Kroto, A. W. Allaf, and S. P. Balm, Chem. Rev., 91, 1213 (1991). 8. F. Wudl, Acc. Chem. Res., 25, 157 (1992).
9. M. Buhl and A. Hirsch, Chem. Rev., 101, 1153 (2001).
10. E. H. L. Falcao and F. Wudl, J. Chem. Technol. Biotech., 82, 524 (2007). 11. H. P. Luthi and J. Almlof, J. Chem. Phys. Lett., 135, 357 (1987).
12. A. Astefanei, O. Nunez, and M. T. Galceran, Anal. Chim. Acta, 882, 1 (2015). 13. M. S. Dresselhaus, G. Dresselhaus, and P. C. Eklund, Science of Fullerenes and
Carbon Nanotubes: Their Properties and Applications, Academic Press, New York (2017).
14. G. G. Wildgoose, C. E. Banks, H. C. Leventis, and R. G. Compton, Electrochim. Acta, 152, 187 (2006).
15. S. Iijima and T. Ichihasi, Nature, 363, 603 (1993). 16. S. Iijima, Nature., 354, 56 (1991).
12
18. G. Lalwani and B. Sitharaman, Nano LIFe, 3(3), 1342003 (2013).
19. G. M. Jenkins and K. Kawamura, Polymeric Carbons, Carbon Fiber, Glass, and Char; University Press: Cambridge, England, (1976).
20. A. Bianco, K. Kostarelos, and M. Prato, Curr. Opin. Chem. Biol., 9, 674 (2005). 21. S. Polizu, O. Savadogo, P. Poulin, and L. Yahia, J. Nanosci. Nanotechnol., 6, 1883
(2006).
22. B. S. Harrison and A. Atala, Biomaterials, 28, 344 (2007).
23. M. Valcarel, S. Cardenas, and B. M. Simonet, Anal. Chem., 79, 4788 (2007). 24. K. S. Novoselov, A. K. Geim, and S. V. Morozov, Science, 306(5696), 666 (2004). 25. M. Inagaki and F. Kang, J. Matr. Chem. A., 2(33), 17 (2017).
26. H. Marsh, Introduction to Carbon Science, Butterworths, London (1989). 27. R. M. Wightman, Science., 311, 1570 (2006).
28. M. L. A. V. Heien, M. A. Johnson, and R. M. Wightman, Anal. Chem., 76, 5697 (2004).
29. T. X. H. Le, M. Bechelany, and M. Cretin, Carbon, 122, 564 (2017).
30. G. M. Jenkins and K. Kawamura, Polymeric Carbons, Carbon Fiber, Glass, and Char; University Press: Cambridge, England, (1976).
31. M. T. McDermott, C. A. McDermott, and R. L. McCreery, Anal. Chem., 65, 937 (1993).
32. C. A. McDermott and R. L. McCreery, Langmuir, 153(12), A2255 (2006). 33. D. T. Fagan, I. Hu, and T. Kuwana, Anal. Chem., 57, 2759 (1985).
13
35. H. D. Hutton, W. Huang, D. Alsmeyer, J. Kometani, R. L. McCreery, T. Neenan, M. R. Callstrom, Chem. Mater., 5, 1110 (1993).
36. G. M. Jenkins and K. Kawamura, Nature, 231, 175 (1971).
37. W. E. Van der Linden and J. W. Dieker, Anal. Chim. Acta, 119, 1 (1980). 38. G. N. Kanau, Anal. Chim. Acta, 207, 1 (1988).
39. E. Frackowiak and F. Beguin, Carbon, 39, 937 (2001).
40. M. Liu and C. Xiao, E3S Web of Conferences, 38, 02005 (2018).
41. S. Ohta, S. Shiba, T. Yajima, and O. Niwa, Electrochemistry, 88(5), 387 (2020). 42. S. Prantontep, S. J. Caroll, C. Xirouchaki, M. Streum, and R. E. Palmer, Rev. Sci.
Instrum., 76, 245103 (2005)
43. P. Braut, A. Caillard, A. L. Thomann, J. Mathias, C. Charles, R. W. Boswell, S. Escribano, J. Durand, and T. Sauvage, J. Phys. D: Appl. Phys., 37(24), 3419 (2004). 44. K. Takahashi, T. saito, A. Ando, Y. Yabuta, H. Mizuguchi, N. Yamamoto, R. Kamei,
and S. Hara, Vacuum., 171, 109000 (2020).
45. S. Ohta, S. Shiba, T. Yajima, T. Kamata, D. Kato, and O. Niwa, J. Photopol. Sci. and Tech., 32(3), 523 (2019).
46. T. Kamata, D. Kato, H. Ida, and O. Niwa, Diam. Relat. Mater., 49, 25 (2014). 47. D. Kato, A. Oda, M. Tanaka, S. Iijima, T. Kamata, M. Todokoro, Y. Yoshimi, and O.
Niwa, Electroanal., 26, 618 (2014).
48. O. Niwa, J. Jia, Y. Sato, D. Kato, R. Kurita, K. Maruyama, K. Suzuki, and S. Hirono, J. Am. Chem. Soc., 128, 7144 (2006).
14
50. D. Kato, N. Sekioka, A. Ueda, R. Kurita, S. Hirono, K. Suzuki, and O. Niwa, J. Am. Chem. Soc., 130, 3716 (2008).
51. D. Kato, N. Sekioka, A. Ueda, R. Kurita, S. Hirono, K. Suzuki, and O. Niwa, Angew. Chem. Int. Ed., 47, 6681 (2008).
52. D. Kato, M. Komoriya, N. Nakamoto, R. Kurita, S. Hirono, and O. Niwa, Anal. Sci.,
27, 703 (2011).
53. D. Kato, M. Sumimoto, A. Ueda, S. Hirono, and O. Niwa, Anal. Chem., 84, 10607 (2012).
54. M. S. Shafeeyan, W. M. A. W. Daud, A. Houshmand, and A. Shamiri, J. Anal. Appl. Pyrolysis, 89, 143 (2010).
55. C. A. Leon y Leon and L. R. Radovic, in: P. A. Thrower (Ed), Chemistry and Physics of Carbon, Marcel Dekker, New York, (1994), p. 213-310.
56. H. P. Boehm, Carbon, 32, 759 (1994).
57. A. Rehman, M. Park, and S. J. Park, Coatings, 9, 103 (2019).
58. C. Moreno-Castilla, F. Carrasco-Marin, E. Utrera-Hidalgo, and J. Rivera-Utrilla, Langmuir, 9, 1378 (1993).
59. M. V. Lopez-Raman, F. Stoeckli, C. Moreno-Castilla, and F. Carrasco-Marin, Carbon, 37, 1215 (1999).
60. M. F. R. Pereira, S. F. Soares, J. J. M. Orfao, and J. L. Figuiredo, Carbon, 41, 811 (2003).
61. A. Barhoum and A. S. H. Makhlouf, Emerging Applications of Nanoparticles and Architecture Nanostructures, Elsevier, (2018), p. 1-28.
15
63. A. J. Bard and L. R. Faulkner, Electrochemical Methods: Fundamentals and Applications. New York: John Willey & Sons, 2nd Edition, 2000
64. D. A. Skoog, D. M. West, and F. J. Holler, Fundamentals of Analytical Chemistry. New York: Saunders College Publishing, 5th Edition, 1988.
16
Figures and Tables
Figure 1.1. Modification techniques for carbon materials.
Surface Modification of Carbon Materials Chemical Modification / Top-Down Modifications 3. Electrodeposition Modification 2. Basic Modification 1. Acidic Modification
Physical Modification / Bottom-Up Modifications
3. Sputtering Modification 2. Plasma Modification
17
18
19
Figure 1.4. The illustration of general schematic system at chemical sensor.
Analyte
Signal
Transducer
20
Table 1.1. Instrumentation method based on the chemical analysis.
Instrumental method
Measuring principle
Electrochemical method
Potentiometric sensors Voltammetric sensors Amperometric sensors Coulometric sensor
Spectroscopic methods Atomic spectroscopy
Nuclear magnetic resonance spectroscopy
Optical methods
Fluorescence Light scattering
21
Chapter 2
Simple Electrochemical Modification of the Carbon Electrode Surface
with Nitrogen Atoms and Platinum Particles
2.1. Introduction of Nitrogen-Containing Functional Groups on the CF Electrode Surface.
2.1.1. Abstract
22
2.1.2. Introduction
Carbon electrode materials for electrochemistry and sensing have been studied extensively in recent years. Two types of carbon electrode materials were used, CF and GC electrodes. The CF and GC electrodes have advantages such as wide potential windows, physical and chemical stabilities, low cost,1-4 and large surface areas.5 Before applications in the fields of electrochemistry, electroanalysis, and sensing, the two electrode surfaces must be modified via physical or chemical modification. Chemical modification methods are of significant interest in electroanalytical chemistry, electrochemistry, and electrocatalysis.6 Electrochemical modification methods are examples of the chemical modification. There are many techniques for introducing a variety of functional groups containing non-metallic elements such as nitrogen,7-10 oxygen,11-14 and fluorine-containing functional groups.15-17 These functional groups have been incorporated onto the carbon electrode surfaces to improve the electrode surface properties, increase the catalytic performances, and expand the potential applications of the resulting electrodes.
23
introduction to the carbon surfaces. Based on the prior reports, the introduction of amine groups was accomplished using the ammonium carbamate solution via a simple electrochemical treatment,20 where the GC electrode was used.20 Nitrogen-containing functional groups such as amines can be easily introduced on the GC electrode surface by the electrochemical oxidation of ammonium carbamate.21,22 The surface of the GC electrode contains primary amine groups (aromatic amine groups such as aniline), but other nitrogen-containing functional groups such as the secondary amine groups containing pyrrole-type nitrogen and quaternary amine moieties containing graphitic quaternary nitrogen may also be introduced on the carbon electrode surface (GC electrode).23,24 This modified carbon electrode with amine groups is AGC electrode or ACF electrode.
24
2.1.3. Experimental Section
Ammonium carbamate (H2NCOONH4) was purchased from Merck KGaA,
Darmstadt, Germany, while dipotassium hydrogen phosphate and potassium dihydrogen phosphate were acquired from Fujifilm Wako Pure Chemical Industries, Ltd., Osaka, Japan. These solutions were used to prepare a phosphate buffer solution (0.1 M; pH 7.0). Sodium hydroxide (NaOH) (0.1M; pH 13.0) and sulfuric acid (0.5 M; pH 0.0) were purchased from Fujifilm Wako Pure Chemical Industries, Ltd., Osaka, Japan. The GF-20-5F CF electrode with 20 mm diameter and 5 mm thickness was obtained from Nippon Carbon Co., Ltd., Japan. All reagents were of analytical grade and used without further purification. The solutions were prepared with deionized water (Millipore Milli-Q System, Japan).
An ultrasonic bath was purchased from Branson Ultrasonic, Emerson Japan, Ltd. A potentiostat/galvanostat (HA-151B, Hokuto Denko Co., Ltd., Japan) was used to perform the controlled potential electrolysis. Electrochemical (cyclic voltammetric (CV)) measurements were carried out using an automated polarization system (HZ-3000, Hokuto Denko Co., Ltd., Japan) with a three electrode cells consisting of a working CF electrode, aqueous Ag/AgCl (3 M NaCl electrolyte) as the reference electrode, and a platinum wire as the counter electrode. A digital recorder (Gr-3500, Keyence Co., Ltd., Japan) was used to record the time during the electrolysis process. A schematic of the potentiostat/galvanostat consisting of three electrodes, a working electrode, counter electrode, and reference electrode connected to at digital recorder, is shown in Figure 2.1.
25
26
2.1.4. Results and Discussion
Figure 2.2 and 2.3 show the CV data collected using a bare CF electrode. This is the first report describing the utilization of CF electrode for modifying its surface in 0.1 M ammonium carbamate. The potential range was from +0.4 V to +1.2 V, and the numbers of potential cycles were 100. A 0.1 M aqueous solution (pH 9.3) was selected for the experiments. CV was performed using a bare CF electrode in 0.1 M ammonium carbamate aqueous solution (pH 9.3; Figure 2.2). The CV data show that the oxidation current of ammonium carbamate increases with an increase in the number of potential cycle scans. Furthermore, the current window increases and changes significantly with an increase in the number of potential cycle scans. It is assumed that these results are related to the CF electrode with a large surface area.
27
current increases slowly to attain the best value, which corresponds to the time determined using the digital recorder. However, the oxidation peak current to reach the peak require more time. When the applied potential is +1.2 V, the peak oxidation current is rapidly attained in comparison to those at the other potential values (+1.0 V and +1.1 V). Interestingly, if the applied potential is +1.2 V, high noise and unstable performance are observed, possibly because the high potential can damage the CF electrode surface, leading to unstable performance during electro-oxidation. Therefore, a potential of +1.1 V was selected. After determining the optimal potential for the best results, the optimal time for applying +1.1 V in the electrode-oxidation process was determined. The time to attain the linear curve is within one hour processing. After one hour of processing, the oxidation peak start to decrease with time. Therefore, a duration of one hour and an applied potential of +1.1 V were selected.
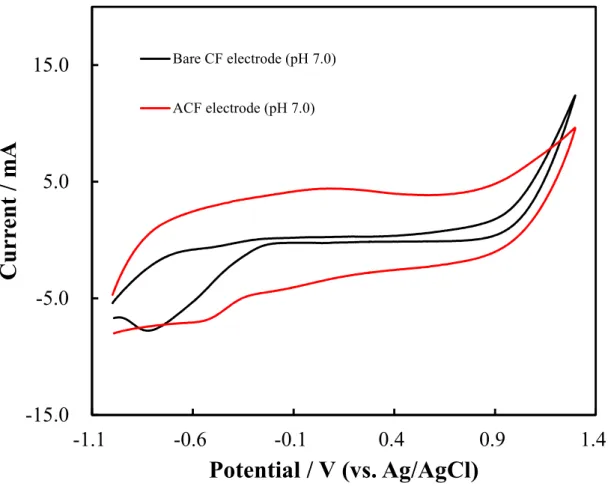
A wide pH range was evaluated using the CF electrode in the CV measurements. The experimental data are shown in Figure 2.5 to 2.7. Two electrodes, a bare CF electrode (red color) and an ACF electrode (black color) were used. Three types of pH electrolyte solutions containing 0.5 M H2SO4 (pH 0.0; Figure 2.5), 0.1 M
28
29
2.1.5. Conclusions
30
References
1. W. E. Van der Linden and J. W. Dieker, Anal. Chim. Acta, 119, 1 (1980). 2. G. N. Kanau, Anal. Chim. Acta, 207, 1 (1988).
3. R. L. McCreery, Carbon Electrodes: Structural Effects on Electron Transfer Kinetics. In Electroanalytical Chemistry: A Series of Advances; Bard, A. J.; Ed.; Marcel Dekker, Inc.: New York, 1991; Vol. 17, p. 221-374.
4. E. Frackowiak and F. Beguis, Carbon, 39, 937 (2001).
5. N. Kishimoto and N. Matsuda, Environ. Sci. Technol., 43, 2054 (2009).
6. R. W. Murray, Chemically Modified Electrodes, in Electroanalytical Chemistry, Vol. 13; A. J. Bard, Ed.; Marcel Dekker: New York, 1984; p. 192.
7. T. Kamata, D. Kato, and O. Niwa, Nanoscale, 11, 10239 (2019).
8. G. Yang, H. Chen, H. Qin, and Y. Feng, Appl. Surf. Sci., 293, 299 (2014).
9. S. A. Chernyak, A. S. Ivanov, E. A. Arkhipova, A. V. Shumyantsev, N. E. Strokova, K. I. Maslakov, S. V. Savilov, and V. V. Lunin, Appl. Surf. Sci., 484, 228 (2019). 10. Y. Yamada, J. Kim, S. Matsuo, and S. Sato, Carbon, 70, 59 (2014).
11. H. Notsu, I. Yagi, T. Tatsuma, D. A. Tryk, and A. Fujishima, Electrochem. Solid-State Lett., 2(10), 522 (1999).
12. M-C. Hsiao, S-H. Liao, M-Y. Yen, P-I. Liu, N-W. Pu, C-A. Wang, and C-C. M Ma, ACS Appl. Mater. Interfaces, 2(11), 3092 (2010).
13. E. Dsimoni, G. I Casella, A. Morone, and A. M. Salvi, Surf. Inter. Anal., 15(10), 627 (1990).
14. H. Oda, A. Yamashita, S. Minoura, M. Okamoto, and T. Morimoto, J. Pow. Sour.,
31
15. V. V. Tomina, G. R. Yurchenko, A. K. Matkovsky, Y. L. Zub, A. Kosak, A. Lobnik, J. Flu. Chem., 132(12), 1146 (2011).
16. T. Liang, C. N. Neumann, and T. Ritter, Angew. Chem. Int. Ed., 52(32), 8214 (2013).
17. F-L. Jin, H-Y. Kim, and S-J. Park, J. Flu. Chem., 128(3), 184 (2007).
18. B. Barbier, J. Pinson, G. Desarmot, and J. J. Sanchez, J. Electrochem. Soc., 137, 184 (2007).
19. A. J. Doward, Electroanalysis, 12, 1085 (2000).
20. S. Uchiyama, H. Watanabe, H. Yamazaki, A. Kanazawa, H. Hamana, and Y. Okabe, J. Electrochem. Soc., 154(2), F31 (2007).
21. H. Watanabe, H. Yamazaki, X. Wang, and S. Uchiyama, Electrochim. Acta, 54, 1362 (2009).
22. Y. Yamawaki, K. Asaka, H. Matsuura, and S. Uchiyama, Bunseki Kagaku, 63, 411 (2014).
23. A. Kanazawa, T. Daisaku, T. Okajima, S. Uchiyama, S. Kawauchi, and T. Ohsaka, Langmuir, 30, 5297 (2014).
32
Figures and Tables
Figure 2.1. Schematic diagram between potentiostat/galvanostat consisting of three
electrodes: a working electrode (black line), a counter electrode, (red line), and reference electrode (green line) which is connected with the digital recorder.
Digital Recorder
Potentiostat/galvanostat
33
Figure 2.2. Cyclic voltammetry observed by using carbon felt electrode in 0.1 M
ammonium carbamate (pH 9.3) aqueous solution at different number of cycles. Applied potential: +0.4 V to +1.2 V. Scan rate: 50 mV/s.
34
Figure 2.3. Cyclic voltammetry observed by using carbon felt electrode in 0.1 M
ammonium carbamate (pH 9.3) aqueous solution at different scan rates.
35
Figure 2.4. Observation best applied potential during electrode oxidation process
36
Figure 2.5. Cyclic voltammetry observed by using bare CF electrode (black color) and
ACF electrode (red color) in 0.5 M H2SO4 solution (pH 0.0). Scan rate: 50 mV/s.
37
Figure 2.6. Cyclic voltammetry observed by using bare CF electrode (black color) and
38
Figure 2.7. Cyclic voltammetry observed by using bare CF electrode (black color) and
ACF electrode (red color) in 0.1 M NaOH solution (pH 13.0). Scan rate: 50 mV/s.
39
2.2 Electrodeposition of Platinum Particles with Nitrogen-Containing Functional Groups on the Carbon Electrode Surface.
2.2.1. Abstract
40
2.2.2. Introduction
Nanoparticles are characterized by different physical and chemical properties depending on their sizes, shapes, and structural forms.1,2 Catalysis is one of the most popular applications of transition metals, particularly noble metals, owing to their high catalytic activities in many reactions. Nanoparticles can facilitate electron transfer and may be easily modified using several biomolecules and chemical ligands.3 Moreover, such characteristics together with the benefit of miniaturization of sensing devices to nanoscale dimensions render the nanoparticles suitable for important applications in sensors (chemical and biochemical sensing). For this reason, studies on nanoscale materials have increased over time, particularly the metallic nanoparticles. Many metal nanoparticles such as palladium, ruthenium, copper, nickel, and iron are available, but silver, gold, and platinum are the most commonly used nanoparticles.
41
In recent years, significant advancement of the electrochemical deposition method has been achieved by the researchers. Electrodeposition, a short name of electrolytic deposition.10 Electrodeposition is a material production technology that employs an applied potential or current flow through an electrolytic solution containing metal ions. These metal ions are eventually reduced to atoms in an electrically conducting substrate, thereby forming metals, alloys, and metal-based compounds.11 Here, the platinum wire is used for electrodeposition through an electrochemical reduction process for the modification of the electrode carbon material surface. Based on the previous reports, the platinum wire is connected to the counter electrode, and treated with strong sulfuric acid solution during electrochemical reduction. The platinum wire produces platinum ions, which are transferred and absorbed into the carbon surface material. CF and GC electrodes were used in these experiments.
42
2.2.3. Experimental Section
The CF electrode (GF-20-5F) with 20-mm diameter and 5-mm thickness was purchased from Nippon Carbon Co., Ltd., Japan. The GC electrode with an inside diameter (ID) of approximately 3 mm was purchased from BAS Co., Ltd. (Tokyo, Japan). Ammonium carbamate was purchased from Merck KGaA (Darmstadt, Germany), while potassium dihydrogen phosphate (KH2PO4), sodium hydroxide, 0.5 M
sulfuric acid, and dipotassium hydrogenphosphate (K2HPO4) were purchased from
Fujifilm Wako Pure Chemical Industries, Ltd. (Osaka, Japan). Two solutions of potassium dihydrogen phosphate and dipotassium hydrogen phosphate were mixed together to prepare 0.1 M phosphate buffer solution (pH 7.0). All reagents were of analytical grade and used without further purification. The solutions were prepared using deionized water (Millipore Milli-Q System, Japan).
43
44
2.2.4. Results and Discussion
Figure 2.8 shows the optimal time of electrochemical reduction. Two different electrodes, Pt-GC (red color) and Pt-NGC (black color), were used. The Pt-GC electrode was prepared by directly electrodepositing platinum particles on the surface of a bare GC electrode. In contrast, for the Pt-NGC electrode, the platinum ions that were dissolved from the platinum wire as the counter electrode in strong acid were deposited on the nitrogen-containing functional groups of the GC electrode. This experiment was monitored using a digital recorder with an electrolyte solution of 1.0 M H2SO4. The data
obtained for the Pt-NGC electrode became gradually stable after 19-h, and after 20 h, the data became very stable. This was inversely proportional to the observation for the Pt-GC electrode, where stabilization started after22 h, and the noise was high. Therefore, the optimal duration of electrochemical reduction was 20-h. This could be the time limit for the platinum ions that dissolved from a platinum wire counter electrode and were electrodeposited on N-containing functional groups at 20-h.
45
those of the Pt-NCF electrode. It was confirmed that during the reduction of the N-GC electrode (Nitrogen-containing functional groups were introduced on the bare GC electrode), the platinum ions migrated from the platinum wire (counter electrode) to the electrolyte solution. These platinum ions were then deposited on the N-GC electrode to form platinum nanoparticles.
XPS is a sensitive and powerful tool for monitoring the structural changes in carbon-based materials. Herein, XPS was used to determine the binding energies of the sample (a) Pt-NCF electrode and (b) Pt-CF electrode. The fabrication of the Pt-CF electrode was similar to that of the Pt-GC electrode. These two electrodes were treated in ultrasonic bath with distilled water for 10 min. Table 2.1 include a summary of the percentages of the elements (carbon, nitrogen, oxygen, and platinum) at the Pt-NCF and Pt-CF electrodes. As shown in Figure 2.11, the high-resolution Pt-4f spectrum exhibits two peaks corresponding to the 4f7/2 and 4f5/2 doublet at 72.3 eV and 74.4 eV,
respectively, for the (a) Pt-NCF electrode, while two peaks corresponding to the 4f7/2
and 4f5/2 doublet at 70.6 eV and 73.4 eV for (b) Pt-CF electrode. The two peaks for 4f7/2
and 4f5/2 shift toward higher binding energies by approximately 1 eV compared to those
46
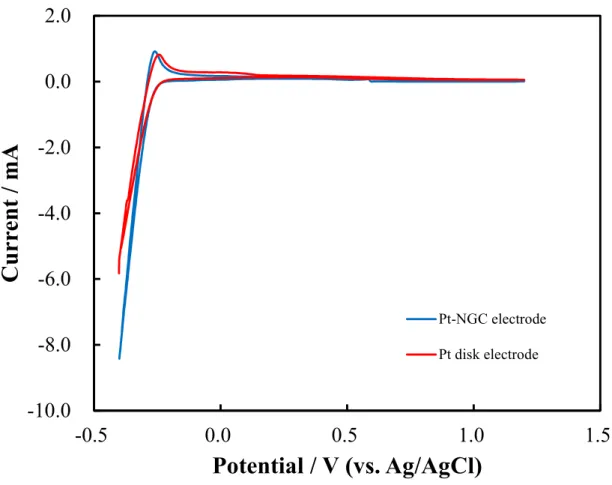
A wide pH range was employed to obtain the redox waves between a hydrogen ion (H+) and a hydrogen molecule (H2) at Pt-NGC electrode and conventional electrode
(Pt disk electrode). Here, 0.5 M H2SO4 (pH 0.0), 0.1 M phosphate buffer solution (pH
7.0), and 0.1 M NaOH (pH 13.0) were used. The results are shown in Figure 2.12 to 2.14, based on which, the Pt-NGC electrode is better than the conventional electrode. Furthermore, in three figures, the electrocatalytic redox (reduction-oxidation) waves between hydrogen ion (H+) and hydrogen molecule (H2) are observed in wide pH range
similar to the observation in the CV measurements.12 The hydrogen ion (H+) shows a reduction wave (reduction process) and the hydrogen molecule (H2) shows an oxidation
wave (oxidation process). This is represented by the following reactions: (1) 2H+ + 2e- H2
47
2.2.5. Conclusions
Two types of carbon electrodes, CF and GC electrodes, were used. A simple electrodeposition method was used to deposit the platinum particles that were connected to the nitrogen-containing functional groups on the carbon electrode surface (Pt-NGC electrode) and/or Pt-NCF electrode via electrochemical reduction. The structure, morphology, and composition of the Pt-NCF electrode were investigated using SEM and XPS. A digital recorder was used to determine the optimal duration of electrochemical reduction. The optimal time to achieve stability during electrochemical reduction was 20 h for the Pt-NGC electrode, which was better than that of the Pt-GC electrode. The sizes of the deposited platinum nanoparticles were <100 nm. The Pt-NGC electrode was superior to the conventional electrode (Pt disk electrode) in solutions with a wide range of pH values. Additionally, an electrocatalytic redox wave was observed between hydrogen ion (H+) and hydrogen molecules (H2) in solutions a
48
References
1. G. Vinci and M. Rapa, Bioengineering, 6, 10 (2019).
2. S. Hrapovic, Y Liu, K. B. Male, and J. H. T. Luong, Anal. Chem., 76, 1083 (2004). 3. A. L. Stepanov, A. N. Golubev, S. I. Mikitin, and Y. N. Osin, Rev. Adv. Mater. Sci.,
38, 160 (2014).
4. F. W. Campbell and R. G. Compton, Anal. Bioanal. Chem., 396, 241 (2010). 5. T. You, O. Niwa, M. Tomita, and S. Hirono, Anal. Chem., 75, 2080 (2003).
6. T. You, O. Niwa, T. Horiuchi, M. Tomita, Y. Iwasaki, Y. Ueno, and S. Hirono, Chem. Mater., 14, 4796 (2002).
7. L-B. Lai, D-H. Chen, and T-C. Huang, Mater. Res. Bull., 36, 1049 (2001).
8. J. Grunes, J. Zhu, E. A. Anderson, and G. A. Somorjai, J. Phys. Chem. B., 106, 11463 (2002).
9. P. Serp, R. Feurer, Y. Kihn, P. Kalck, J. L. Faria, and J. L. Figuiredo, J. Mater. Chem., 11, 1980 (2001).
10. S. Glasstone, The Fundamentals of Eelectrochemistry and Electrodeposition. Palisade, NJ: Franklin Publishing. (1960).
11. F. A. Lowenheim, Modern Electroplating. New York: John Willey & Sons. (1974). 12. H. Matsuura, T. Takahashi, S. Sakamoto, T. Kitamura, and S. Uchiyama, Anal. Sci.,
33, 703 (2017).
13. C. Shimamura, M. Jinnai, S. Kuntolaksono, S. Sato, and H. Matsuura, J. Surface Finish. Soc. Of Japan, Accepted. (in Japanese).
49
15. A. Kanazawa, T. Daisaku, T. Okajima, S. Uchiyama, S. Kawauchi, and T. Ohsaka, Langmuir, 30, 5297 (2014).
50
Figures and Tables
Figure 2.8. Observation at digital recorder to select the best time in the electrode
reduction process using different electrode (red color: Pt-GC electrode) and (black color: Pt-NGC electrode). The supporting electrolyte solution: 1.0 M sulfuric acid and the applied potential: -1.1 V.
51
52
53
Figure 2.11. XPS spectra of Pt 4f by using (a) Pt-NCF electrode and (b) Pt-CF electrode
with 10 minutes of ultrasonic treatment.
54
Figure 2.12. Cyclic voltammetry observed by using Pt-NGC electrode (blue line) and Pt
disk electrode (red line) in 0.5 M H2SO4 (pH 0.0). Scan rate: 50 mV/s.
55
Figure 2.13. Cyclic voltammetry observed by using Pt-NGC electrode (blue line) and Pt
56
Figure 2.14. Cyclic voltammetry observed by using Pt-NGC electrode (blue line) and Pt
disk electrode (red line) in 0.1 M NaOH (pH 13.0). Scan rate: 50 mV/s.
57
Table 2.1. The atomic ratio for each element which consist on the Pt-NCF electrode and
Pt-CF electrode after 10 minutes ultrasonic treatment.
Atomic ratio each element
C O Pt
Pt-NCF electrode 76.4 16.6 7.0
58
Chapter 3
Potential-Controlled Coulometric Analysis of Nitrite Using Aminated
Carbon felt Electrode
3.1. Abstract
59
3.2. Introduction
Nitrite (NO2-) is a nitrogen source for green plants,1 an inorganic compound
found in nature,1 an important component of the nitrogen cycle.2 Nitrite can be found and used in a wide area, for example in the industrial, environment, agricultural production, as food additives and food preservatives.3-5 Also, in the food industry, nitrite can able to inhibit the growth of some bacteria and give the meat an attractive color.6 Discharge of wastewater containing nitrite into the environment is a big source deterioration of lakes, rivers, and water sources, which may cause serious health hazards to humans. Also, it is another example of the use of nitrite as a dye agent, bleach, and corrosion inhibitor in the chemical industry.7-10
Despite the application of nitrite in various fields, nitrite has a negative effect on the nitrite itself. The disadvantage of nitrite consists of high toxicity at high concentrations, harmful to human health and the environment.11-14 As an example, if nitrite has in inside the human body, nitrite may react with amines and probably causes carcinogenic nitrosamines15,16 as well as oxidizes hemoglobin to methemoglobin which diminishes the oxygen carrying capacity.17 Furthermore, effect of nitrite in humans may cause hypertension, cancer, spontaneous abortion, birth defects, growth restriction,
etc.18-20 Consequently, the accurate determination of sulfite is very important in food,
chemical industries, and environmental monitoring application.
60
incessant. Colorimetric techniques have also been applied to determine the amount of nitrite in foods.23,24 This technique require lab-equipped spectrometers, large sample volumes, and glass consumables to house the reaction.23 Another example of traditional method for detection nitrite, such as high performance liquid chromatography,25,26 chemiluminescence,27,28 flow injection analysis,29 Raman spectrometry,30 spectrophotometry,31,32 and ion chromatography.33,34 Those technique have disadvantages including complicated pre-treatment of samples that consumes time, expensive,
In contrast, the above problems are overcome by electrochemical techniques that have been widely explored for nitrite quantification and direct detection through accurate, rapid response, low cost, high sensitivity, operational simplicity, and real time quantitative analysis.35-41 Although nitrite can be determined by either reduction of oxidation, the electrochemical oxidation of nitrite is usually preferred over reduction, in order to avoid major disturbance from oxygen molecules and nitrite.37,38 Electrochemical techniques for nitrite has mainly been determined using amperometry,42-44 anodic voltammetry,45,46 square wave voltammetry,47,48 differential pulse voltammetry,49-52 and cyclic voltammetry.53-55 Those techniques have disadvantages and ineffective for detecting nitrite due to the requires calibration.
61
droplet experiment.56,57 An alternative reason to be used in the potential-controlled coulometry is a very simple structure of the sensor cell.57 Then, the sensor does not need calibration during measurement process.57 However, there is no one paper regarding determine of nitrite by using this analysis technique. Due to the reason, the author was the first reporting paper for employing this technique to detection of nitrite.67
62
3.3. Experimental Section
The carbon felt (CF) electrode was acquired from Nippon Carbon Co., Ltd., and the types and size of GF-20-5F, 20 diameters, and 5 mm thickness were used. All chemical reagents were supplied from Merck KGaA., Darmstadt, Germany and Wako Pure Chemical Industries, Ltd., Japan. First, ammonium carbamate (H2NCOONH4) was
purchased from Merck KGaA., Darmstadt, Germany, and used without further purification. Second, the chemical reagents purchased from Wako Pure Chemical Industries, Ltd., Japan, consists of sodium nitrite (NaNO2), potassium hexacyanoferrate
(K3(Fe(CN)6), acetic acid (CH3COOH), and sodium acetate (CH3COONa). The
supporting electrolyte was used as an acetic acid buffer solution (pH 4.0)21 which were prepared of 0.1 M (M = mol/L) sodium acetate and 0.1 M (M = mol/L) acetic acid. The cation exchange membrane used was from Asahi Glass Engineering, Japan. Distilled water produced by a Millipore-Q system (Millipore, Japan) was used to prepare all solutions. All the experiments were conducted at room temperature.
63
Next, the author explained the preparation of the aminated carbon felt (ACF) electrode. The CF electrode was mixed with ethanol and distilled water, treated in an ultrasonic bath for 1 h. The aim of using an ultrasonic bath is to remove all traces of contamination that are firmly or merely attached to the surface of the CF electrode. Then, a three-electrode cell consisted of CF working electrode, an Ag/AgCl reference electrode, and a platinum wire counter electrode. CF electrode was electro-oxidized in 0.1 M ammonium carbamate aqueous solution (pH 9.3) at a constant potential of +1.1 V for 1 h (60 minute). All experiments were carried out at room temperature.
During experiment in the cyclic voltammetry, all data were observed under temperature room. The author used two types of CF as working electrode: an ACF electrode and unmodified (bare) CF electrode. An aqueous Ag/AgCl (3 M NaCl electrolyte) reference electrode, a magnetic stirrer, and a platinum wire used as a counter electrode were also employed. The supporting electrolyte solution was 0.1 M acetic acid buffer solution (pH 4.0). The conditions setting in cyclic voltammetry were explained as follows; the potential scan range was +0.4 to +1.1 V, the potential cycle was set on 100, and the potential scan rate was 20 mV/s.
64
65
3.4. Results and Discussion
3.4.1. Electrochemical Performance of Nitrite
The electrochemical properties of the nitrogen-containing functional groups deposited on CF electrode were investigated by cyclic voltammograms experiments in 0.1 M acetic acid buffer solution (pH 4.0) in with (solid line) and without (dotted line) of 10 mM nitrite. As described in Fig. 3.2, without the addition of nitrite in the ACF electrode, does not have oxidation wave was achieved from nitrite in the potential range from +0.4 to +1.1 V. In contrast, there is an oxidation wave generated when nitrite was added on ACF electrode. Then, the author found that the anodic peak potential was +0.95 V and that the oxidation peak current was 1.44 mA. The author also understands that the induction of the electrocatalytic activity of nitrite has inside in this process. This cyclic voltammogram shows the electro-oxidation product in the electro-inactive species. Then, these results indicate that the nitrite ion will oxidation to the nitrate ion according to Eq. (1).
NO2¯ + H2O NO3¯ + 2H+ + 2e¯ (1)
66
electrode based sensor in 10 mM of nitrite is approximately 7 times higher than unmodified (bare) CF electrode based sensor. Based on the results reported by Wang et al.,9 which used to nitrogen-contain functional groups modified on GC electrode, the oxidation peak current at aminated GC electrode was twofold larger than bare GC electrode.9 The multiple increases in oxidation peak current exhibit the function of active site from a nitrogen atom containing functional groups in the ACF electrode and also aminated GC electrode as a modified carbon electrode. In addition, it is indicating that using carbon felt electrode are better than GC electrode. There are two option reasons it, first, due to the dimensions from the electrode made of carbon material (CF; type of 3 dimensional and GC; type of 2 dimensional), and the second is about the factor of the surface area of electrode material which I used.
As shown in Fig. 3.4, the author initiated measurement of the various concentration of nitrite at ACF electrode in 0.1 M acetic acid buffer solution (pH 4.0). The oxidation peak current was increased with an increase in nitrite concentrations up to 1.0 mM. Furthermore, the relationship between the peak current versus the concentration of nitrite was proportional result. The linear regression coefficient was 0.9937 and the detection limit was determined to be 10 μM. These results illustrated the stability of ACF electrode for electrocatalytic applications in which successive detection of nitrite is performed.
67
the electrochemical oxidation of nitrite at ACF electrode surface is a diffusion control process. In addition, I tried to making other data about the correlation between the oxidation peak current and the square root of the scan rate have a good linear relationship; with the linear regression was 0.9865. It is also suggesting that the oxidation of nitrite at ACF electrode is a diffusion control process.
3.4.2. Analytical Performance Using Potential-Controlled Coulometry for Detecting Nitrite
Specifically, Fig. 3.6 will have explained how to decide and how to determine the optimal conditions which will applied to the potential-controlled coulometric sensor in sulfite detection. The author observed the connection between the applied potential and the electrical charge at various applied potential during the potential-controlled coulometric of nitrite. The result between the electrical charge (solid line) and response time (dotted line) are shown in Fig. 3.6. Before enter to the point subject, the author will describe one by one of the meaning of response time and electrical charge.
In this paragraph, the author will explain the response time as follow: response time is the time required to return into the baseline and remain constant when adding a sample to the electrolyte solution in the potential-controlled coulometry. The response time when the applied potential ranges from +0.3 to +0.9 V indicates a rapid measurement. But, when the applied potential was on the +0.9 and +1.0 V, the response was slightly slow. After knowing about the response time at potential-controlled coulometry, let`s move to the electrical charge at potential-controlled coulometry. For this, the author will explain it in the next paragraph.
68
charge through the Faraday constant. This means that the number of electrons can be estimated from the electric charge under the measurement to determine the concentration of the analyte. From the electrical charge data in Fig. 3.6, the author knows that the electron number of the electrode reaction was two-electron paths from the estimation of the electrical charge of nitrite detection. The high point of the electrical charge is when the applied potential is +0.5 V. However, in the applied potential range from +0.5 V to +0.8 V, the electrical charge was decreased. On the other hand, the electrical charge decreased significantly when the electrode potential exceeded +0.8 V. These results explain that the catalytic site on the surface of the ACF electrode was destroyed by electrode oxidation. With all the reasons mentioned above, the author decided that the optimal applied potential was +0.75 V.
The results data on the performance of potential-controlled coulometry using the ACF electrode will be explained in Fig. 3.7, 3.8, 3.9, and 3.10. In Fig. 3.7, showed a typical current relationship and time curve obtained by the repetitive measurement of 1.0 mM nitrite. The response time finished in a short time (~30 s) and no detectable residual current fluctuation appeared after the electrolysis had been completed. The tenth successive measurement of the relative standard deviation (RSD) was 2.2 %.
69 determination is very quickly realized.
Furthermore, Fig. 3.9 described the measurement of the nitrite concentration from high to low concentrations in a 10 μL sample volume. This data shown to us that`s the advantage of utilize potential-controlled coulometry. From this result, the author considers that the calibration curve changes when nitrite was added at various concentrations. It can be described that the high concentration solution (a) has a slow response. In contrast, the low concentration (h) has fast response.
70
3.5. Conclusions