心臓 MRI 位相画像法を用いた体血流量の 測定方法の確立について
―小児から成人まで―
昭和大学藤が丘病院小児科
西 岡 貴 弘*
抄録:心臓磁気共鳴画像診断法(Cardiac Magnetic Resonance Imaging; CMRI)において,
通常,体血流量(Qs)は上行大動脈通過血流量(Qaao)に相当するが,大動脈弁狭窄による 乱流や各種短絡などは Qaao の正確な測定の妨げとなる.本研究では心臓 MRI 位相画像法を 用いて体血流量の測定方法を検討した.2010 年から 2011 年まで CMRI を施行した 73 例.年 齢は 0 か月〜 72 歳(中央値 7 歳),体重は 2.0 〜 77.4 kg(中央値 21.8 kg),男女比は 37:36.
Qaao,下行大動脈血流量(Qdao),上大静脈血流量(Qsvc),および下大静脈血流量(Qivc)
について位相画像法を用いて計測し,Qs が Qsvc と Qdao の合計から推定可能かを検討した.
また CineMRI 法で測定した左室一回拍出量(LVSV)と Qaao の関連を検討した.撮影は 3.0T,
1.5TMRI 機器を,信号収集系列は Fastcard PC 法を,LVSV 測定は CineMRI 法を使用した.
LVSV と Qaao,LVSV と Qivc + Qdao,Qsvc + Qivc と Qaao,Qsvc + Qdao と Qaao は,
各相関係数 r = 0.98*,0.92*,0.93*,0.97*と強い相関を認め(*:p < 0.001),Bland-Altman 分析で一致を確認した.CineMRI 法を用いて LVSV を測定することで CMRI-PC 法で測定さ れた Qaao の正確性を確認した.CMRI-PC 法にて大血管各部位の血流量を正確に計測するこ とができた.Qs は Qsvc と Qdao の加算値に一致することが証明できた.心臓カテーテル検査 では測定困難な肺動脈閉鎖や大動脈弁狭窄などの疾患群でも,上大静脈と下大静脈または下行 大動脈の血流量を計測することで,Qs の計測が可能になり,各種疾患群への応用が期待でき ることが判明した.以上の結果から,Qaao が測定不可能な疾患群でも Qs を算出することが 可能であり,各種先天性心疾患手術前後の評価に応用が期待できる.心臓 MRI 位相画像法を 用いることにより上大静脈および下行大動脈の血流量測定をすることで体血流量の測定が可能 になる.
キーワード:心臓 MRI,位相画像法,体血流量
緒 言
循環器系疾患の診断,適切な治療とその後の評価 を行うためには,非侵襲的でかつ定量的血流情報の 取得が極めて重要である.近年,成人循環器領域で は 心 臓 磁 気 共 鳴 画 像 診 断 法(Cardiac Magnetic Resonance Imaging,以下 CMRI)による心機能評 価は心臓超音波検査,心臓カテーテル検査に代わる 標準的な診断方法になってきている1).また,先天 性心疾患に対しても標準的な診断方法の一つとされ ており,撮影プロトコールのガイドラインも報告さ れ て い る2).CMRI 位 相 画 像 法(Phase-Contrast,
以 下 CMRI-PC 法 ) に よ る 上 行 大 動 脈 の 血 流 量
(Qaao)から体血流量(Qs)を計測する報告がある が3),大動脈弁狭窄などの狭窄病変合併例では乱流 が生じるため CMRI-PC 法を用いた上行大動脈の血 流量から正確な体血流量計測は困難と考えられる.
また各種短絡や合併する心奇形があれば,Qaao が Qs に相当しない場合も多々認められる4).心臓カ テーテル検査による Fick 法での計測が不可能な疾 患や,CMRI-PC 法でも直接 Qs の測定が困難な大 動脈,肺動脈の狭窄病変をもつ疾患では,上行大動 脈以外の部位での測定が必要となる.上大静脈,下 大静脈,下行大動脈の通過血流量から間接的に Qs 原 著
*
責任著者
を算定することが可能であれば先天性心疾患におけ る血行動態の評価に非常に有用である.本研究では CMRI-PC 法を用いて上大静脈,下大静脈,上行大 動脈,下行大動脈の血流量を測定するとともに,
CineMRI 法によって左室一回拍出量(以下 Left ventricular stroke volume:以下 LVSV)を測定し,
上大静脈,下大静脈,下行大動脈の通過血流量から 体血流量を推定した.
対 象
2010 年 1 月 か ら 2011 年 12 月 ま で の 2 年 間 に,
昭和大学横浜市北部病院で CMRI を施行した心外 短絡のない症例を対象とした.そのうえで大動脈弁 閉鎖不全を合併した症例,不整脈を認めた症例を除 外した.疾患の内訳は心房中隔欠損症 25 例,心室 中隔欠損症 25 例,房室中隔欠損症 3 例,その他の 非短絡疾患 21 例(僧帽弁閉鎖不全 9 例,肥大型心 筋症 4 例,特発性肺高血圧 3 例,川崎病 2 例,拡張 型心筋症 1 例,心臓腫瘍 1 例)の合計 73 例で,年 齢は中央値 7 歳 (0 か月〜 72 歳),身長は中央値 123.6 cm(42.0 〜 176.0 cm), 体 重 は 中 央 値 21.8 kg
(2.0〜77.4 kg),男女比は37:36であった(Table 1).
新生児・乳幼児における鎮静はチオペンタールナ トリウム注腸およびトリクロホスナトリウム内服を 用いて,鎮静下に自然呼吸で撮影した.
方 法 1.使用機器
使 用 し た MRI は SignaHDxt3.0T お よ び Signa Twinspeed1.5T(GE Healthcare, Milwaukee, USA)である.体重 15 kg 以上は HD cardiac coil
(8 ch),8 kg 以 上 15 kg 未 満 は Head coil(4 ch),
8 kg 未満は Head coil(8 ch)の表面コイルを使用 した.
2.心臓 MRI 位相画像法(CMRI-PC 法)
1)CMRI-PC 撮影方法
PC 法の信号収集系列として Fastcard PC 法を使 用,TR(repetition time)3.0 msec,RR を 30 分割 し,3.0 T/1.5 T で TE(echo time):2.7/3.0 msec フリップ角:20 /20 matrix size256
×
128/256×
192 バンド幅:32/32,k-space segmentation は 1 または 2 を用い,心電図同期とした.また Velocity encoding(VENC)は大動脈,肺 動脈:2.5 m/s,上大静脈:2.5 or 1.5 m/s,下大静 脈:1.5 m/s と設定した.
2)CMRI-PC 法の大血管の計測断面設定
撮影断面は冠状断面,矢状断面および横断面のい ずれか 2 方向を基に各血管の走行に直交する断面を 設定した.上行大動脈は気管支分岐部位直下で肺動 脈分岐部のレベル,下行大動脈は左主気管支レベル
Table 1 Patient Characteristics Characteristics data
Males/Females 37/36
Age(years) 7 ± 16.3(range: 0 〜 72.7)
Weight(kg) 21.8 ± 21.6(range: 2.0 〜 77.4)
Height(cm) 123.6 ± 42.3(range: 42 〜 176)
Study group n: total = 73
Atrial septal defect 25
Ventricular Septal Defect 25
Atrioventricular septal defect 3
Mitral regurgitation 9
Hypertrophic cardiomyopathy 4
Idiopathic pulmonary arterial hypertension 3
Kawasaki disease 2
Dilated cardiomyopathy 1
Cardiac tumor 1
Data revealed median ± SD.
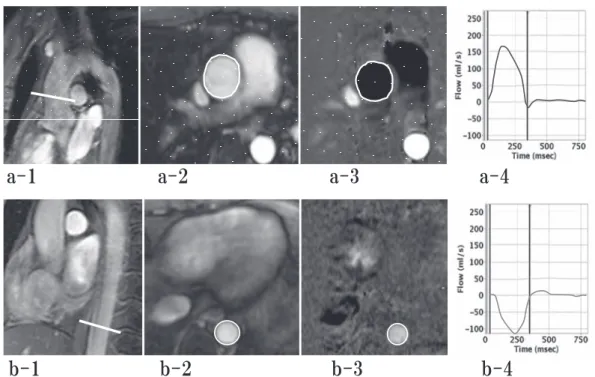
より下で横隔膜より上のレベル,上大静脈は肺動脈 分岐部位で奇静脈,半奇静脈合流後より下のレベ ル,下大静脈は肝静脈合流後より上部の横隔膜レベ ルの断面で計測した(Fig. 1,2).
3.CineMRI 法 撮影方法
信号収集系列は Steady state free precession
(SSFP)法,Fast imaging employing steady-state acquisition (FIESTA)法,または gradient echo 法 を用いた Fast-cine 法を採用し,1 心拍を 18 または 20 分割し,3.0T/1.5T で TE(echotime): 4.4/1.6 msec フリップ角:20 /45 matrix: 256
×
160/224×
224 バ ン ド 幅:32/125) を 使 用 し た.FOV(Field of view)と撮影断面の厚さは患者の大きさにより変化 し 3.0 T,1.5 T ともに小児では FOV180 〜 220 mm と撮影スライス厚を 6 〜 8 mm で成人では FOV350〜 450 mm と撮影スライス厚 10 mm とした.
4.画像解析
CMRI-PC 法による大血管の血流測定:解析ソフト GE ReportCard3.0(GE Healthcare, Milwaukee, USA)
を使用した.FastcardPC 法で得られた関心領域の 30 時相の各断面を計測することで,各心時相での平均 血流速度が計測され,流量‑時間曲線を表示し,1 心 拍あたりの目的の断面における血流量が測定される
(Fig. 1,2).
5.解析項目
1)計測方法の再現性と信頼性に関する解析 再現性と信頼性を確認する為,同一検者内にて 2 回計測を行った (intra-observer reproducibility).
対象中無作為に抽出した 30 例で同一検者による 2 回の計測を行い,その相関と系統誤差を解析した.
次に検者間の信頼性(inter-observer reliability)を 確認するため,上行大動脈 30 例,下行大動脈と上 大静脈 30 例,下大静脈 12 例を無作為に抽出し,2 人の検者(著者ならびに小児循環器医)による計測 結果の相関と系統誤差の解析を行った.
2)体血流量を求めるための前提についての解析 上行大動脈血流量(Qaao)以外の部位の血流量 から体血流量(Qs)を求めるための前提として,
心室内短絡,有意な房室弁逆流がない症例 25 例に ついて,CineMRI 法を用いて測定した LVSV と,
同一患者におけて同時に行った CMRI-PC 法を用い た上行大動脈血流量(Qaao)の相関と系統誤差の 検討を行った.
また 73 例について,下行大動脈血流量(Qdao)
と下大静脈血流量(Qivc)の相関と系統誤差の有 無を検討した.
3)各大血管の血流量測定から算出した体血流量 の一致についての検討
体血流量(Qs)の算定は,まず Qsvc + Qivc か ら算出した値が,CMRI-PC 法を用いて直接測定し た Qaao の測定結果と一致するかについて検討し,
次に Qaao と Qsvc + Qdao からの算出した値が一 致するかについて検討した.
倫理的指針
本研究における磁気共鳴画像診断法は診断の確定 と治療方針決定の一助として行い,その施行や鎮静 については本人または保護者の同意を得た.得られ た磁気共鳴画像診断法の情報の範囲内で本研究の解 析を行った.本研究については昭和大学横浜市北部 病院倫理委員会の承認を得た(昭和大学横浜市北部 病院倫理委員会 番号:1303‑09).
6.統計学的解析
統計学的解析は Dr SPSS Ⅱ 11.0 J for Windows
(IBM:米国ニューヨーク州)にて行った.相関の 解析は Spearman の順位相関係数を,系統誤差の解 析は Bland-Altman 分析を用い,危険率 5%未満を 有意水準とした.
結 果
1.同一検者内の計測再現性と検者間信頼性の結 果(Table 2)
同一検者による検定では,Qaao,Qdao,Qsvc,
Qivc すべてにおいて相関係数(r)は 0.9 以上の非 常に強い相関を得た.また 2 群間の系統誤差を求め る Bland-Altman 分 析 で は, 一 致 限 界(limits of agreement,LOA)は Qaao(
−
4.1 〜 3.3),Qdao(
−
6.2 〜 3.1),Qsvc(−
3.8 〜 3.2),Qivc(−
4.5〜 4.4)(いずれも単位は ml/beat)であり,LOA 範囲内にほとんどが入り一致していると考えられ,
再現性を確認した.
2 人の検者間の信頼性の検定では,Qaao,Qdao,
Qsvc,Qivc すべてにおいて r = 0.9 以上の非常に 強 い 相 関 を,2 群 間 の 系 統 誤 差 を 求 め る Bland- Altman 分 析 で は,LOA は Qaao(
−
11.5 〜 6.7),Qdao(
−
3.7 〜 2.7),Qsvc(−
3.8 〜 3.3),Qivc(
−
7.3 〜 4.4)(いずれも単位は ml/beat)であり信Fig. 1 (a-1)planning level for assessment of the ascending aorta(red line) (a-2)magnitude imaging of the pane of the ascending aorta (a-3) phase imaging in the plane of the ascending aorta (a-4)graph is showing the ascending aorta flow duaring one beat. (b-1)planning level for assessment of the descending aorta(red line) (b-2)magnitude imaging of the pane of the descending aorta (b-3)
phase imaging in the plane of the descending aorta (b-4)graph is showing the descending aorta flow duaring one beat.
Fig. 2 (c-1)planning level for assessment of the superior vena cava (red line) (c-2)magnitude imaging of the pane of the superior vena cava (c-3) phase imaging in the plane of the superior vena cava (c-4)
graph is showing the superior vena cava flow duaring one beat. (d-1)planning level for assessment of the inferior vena cava (red line) (d-2)magnitude imaging of the pane of the inferior vena cava
(d-3) phase imaging in the plane of the inferior vena cava (d-4)graph is showing the inferior vena
cava flow duaring one beat.
頼性を確認した.
2.体血流量を求めるための前提についての解析 の結果
LVSV と Qaao は,相関係数(r)= 0.98(p < 0.001)
と強い相関を認めた.Bland-Altman 分析で,LOA は
−
25.1 〜 18.5 ml/beat であった(Fig. 3).また Qivc と Qdao は,r = 0.92 p < 0.001 と強い相関を 認めた.Bland-Altman 分析では,LOA は−
16.3 〜 14.8(ml/beat)であった(Fig. 4).3.各大血管の血流量測定から算出した体血流量 の一致についての検討の結果
Qsvc + Qivc と Qaao は r = 0.93 p < 0.001 と 強い相関を認めた.Bland-Altman 分析で,LOA は
−
17.5 〜 23.5(ml/beat)であった(Fig. 5).Qsvc + Qdao と Qaao は r = 0.98 p < 0.001 と 強い相関を認めた.Bland-Altman 分析で,LOA は
−
11.1 〜 18.7(ml/beat)であった(Fig. 6).考 察
本 研 究 は Qs を 出 す こ と を 目 的 と し,Qsvc,
Qaao,Qdao がどのように相関するのかを検討した 研究である.
近年,MRI 機器およびソウトウェア面などの撮
像技術が格段に進歩に伴い,心室機能,心室容量な どの計測は CineMRI 法が標準的な診断法になりつ つある.Dele-Michael らは経胸壁エコーと MRI で5), McLure らはサーモダイリューション手技と MRI で6,7),Culham らは心臓カテーテルによる心室造影 と MRI,2 つの方法で計測した各種心機能の値は強 い相関があることを報告している8).
Buechel らは CineMRI 法における高速撮像法
(SSFP 法)を用いて心室容積について 8 〜 20 歳の 男女別に 114 名の測定を行い,各年齢別の正常値を 報告した9).
Kondo らは 12 人の健常成人に対して CineMRI を用いて測定した大動脈,肺動脈の駆出量と,位相 画像法で測定した心拍出量と容積に基づく心室拍出 量は極めてよい相関をもつと報告している10).しか し Kondo らは系統誤差の分析までは行っていない ため,本研究では同様に CineMRI を用いた LVSV の測定と CMRI-PC 法を利用した Qaao の相関関係 と,系統誤差を Bland-Altman 分析を用いて検討し た.その結果,LVSV と Qaao の両群間には強い相 関を示し,系統誤差は認めず,統計学的な正確性を 明らかにすることができた.
次に,われわれは小児から成人までの幅広い範囲
Table 2 Intraobserver and intraobserver reliability
Qaao
※ 1Qdao
※ 2Qsvc
※ 3Qivc
※ 4(a)intra-observer reliability
r-value
†0.98 0.99 0.98 0.99
p-value
††< 0.001 < 0.001 < 0.001 < 0.001
mean difference
†††0.38 1.55 0.31 0.08
limits of agreement
†††− 4.1 to 3.3 − 6.2 to 3.1 − 3.8 to 3.2 − 4.5 to 4.4
(b)inter-observer reliability
r-value
†0.98 0.99 0.98 0.98
p-value
††< 0.001 < 0.001 < 0.001 < 0.001
mean difference
†††2.41 0.49 0.23 1.46
limits of agreement
†††− 11.5 to 6.7 − 3.7 to 2.7 − 3.8 to 3.3 − 7.3 to 4.4 Intraobserver(a) and intraobserver(b) reliability is summarized in Table 2.
†
)r-value is correlation coefficient(Spearmanʼs rank correlation coefficient)
††
)p-value is analyzed by studentʼs t-test
†††
)mean difference and limits of agreement are determined by Bland-Altman analysis
※ 1 Qaao: blood flow through the ascending aorta
※ 2 Qdao: blood flow through the descending aorta
※ 3 Qsvc: blood flow through the superior vena cava
※ 4 Qivc : blood flow through the inferior vena cava
での上大静脈(SVC),下大静脈(IVC),上行大動 脈(aAo),下行大動脈(dAo)のそれぞれの血流 量 を CMRI-PC 法 か ら 求 め た. 今 回 の 検 討 で は Qaao を冠動脈分岐後の部位で計測しているため,
血流を過小評価しているが,冠血流量に異常がない 病態では,Qaao から体血流量を近似することが可
能と考えられた.
CMRI-PC 法を用いた大血管各部位の正確な血流 測定の報告が多く認められている.Lotz らは CMRI- PC 法を用いて大血管各部位について測定し,大血 管測定における同法の測定誤差は経胸壁心臓超音 波,心臓カテーテル検査などと比較して 10%未満で
Fig. 3 Comparison of LV stroke volume(LVSV) versus ascending aortic flow(Qaao)
(a)Pearson correlation confficient
Data shows regressions line, Yaxis: Qaao(ml/beat) versus X axis: plot of LVSV
(ml/beat) by CMRI-PC method, displayed plot data of 25 patients.
(y = 0.87x + 1.73 r
2= 0.97, r is correlation coefficient )
(b) Data shows Bland-Altman plots, Y : axis shows difference between LVSV and Qaao(ml/beat), X axis shows average of LVSV and Qaao(ml/beat).
Difference mean: − 3.3(ml/beat) Upper and lower limits of agreement: mean ± 1.96 SD = − 25.1 to 18.5(ml/beat).
Fig. 4 Comparison of inferior vena cava blood flow(Qivc) versus descending aortic blood flow(Qdao)
(a)Pearson correlation confficient
Data shows regressions line, Yaxis : Qdao(ml/beat) versus X axis : plot of Qivc(ml/beat) by CMRI-PC method, displayed plot data of 73 patients.
(y = 0.98x + 1.33 r
2= 0.84, r is correlation coefficient )
(b) Data shows Bland-Altman plots, Y: axis shows difference between Qivc and Qdao(ml/beat), X axis shows average of Qivc and Qdao(ml/beat).
Difference mean: − 0.7(ml/beat) Upper and lower limits of agreement: mean
± 1.96SD = − 16.3 to 14.8(ml/beat).
あり臨床的には有用レベルであると述べている11). Brenner らは 11 名の心房中隔欠損症(ASD)の成 人を対象として,肺血流量(Qp)と体血流量(Qs)
の比である Qp/Qs に関して CMRI-PC 法を用いて測 定しカテーテル検査における Fick 法と比較し,よ
い相関を認め,臨床的に使用可能と報告している.
このようにカテーテル検査における Fick 法によ る Qp/Qs の測定などと比較し,非侵襲的な MRI の 有用性が多数報告されるようになり12‑16),CMRI- PC 法は血流測定においては Fick 法に代わる「標
Fig. 5 Comparison of superior vena cava blood flow(Qsvc)+inferior vena cava blood flow(Qivc) versus ascending aortic blood flow(Qaao)
(a)Pearson correlation confficient
Data shows regressions line, Yaxis: Qsvc + Qivc(ml/beat) versus X axis: plot of Qaao(ml/beat) by CMRI-PC method, displayed plot data of 73 patients.
(y = 1.04x + 4.24 r
2= 0.90, r is correlation coefficient )
(b) Data shows Bland-Altman plots, Y : axis shows difference between Qsvc+Qivc and Qaao(ml/beat), X axis shows average of Qsvc + Qivc and Qaao(ml/beat).
Difference mean: 3.0(ml/beat) Upper and lower limits of agreement: mean ± 1.96SD
= − 17.5 to 23.5 (ml/beat).
Fig. 6 Comparison of superior vena cava blood flow(Qsvc)+ descending aortic blood flow(Qdao) versus ascending aortic blood flow(Qaao)
(a)Pearson correlation confficient
Data shows regressions line, Yaxis: Qsvc + Qdao(ml/beat) versus X axis: plot of Qaao(ml/beat) by CMRI-PC method, displayed plot data of 73 patients.
(y = 1.03x + 2.90 r
2= 0.93, r is correlation coefficient )
(b) Data shows Bland-Altman plots, Y: axis shows difference between Qsvc + Qdao and Qaao(ml/beat), X axis shows average of Qsvc + Qdao and Qaao(ml/beat).
Difference mean: 3.8(ml/beat) Upper and lower limits of agreement: mean ± 1.96SD
= − 11.1 to 18.7(ml/beat).
-30 -20 -10 0 10 20 30 40
0 20 40 60 80 100
Diffrencebetween (Qsvc+Qdao) and Qaao(ml/beat)
average of (Qsvc+Qdao) and Qaao(ml/beat)
y = 1.03x + 2.90 r² = 0.93
0 20 40 60 80 100 120 140
0 20 40 60 80 100 120
Qaao(ml/beat) Qsvc+Qdao(ml/beat)
Mean+1.96SD
Mean-1.96SD Mean
(a) Pearson correlation confficient (b) Blant-Altman plot
準的な検査法」17)になったといわれてきている.た だし CMRI-PC 法では,狭窄病変で生じる乱流に伴
う誤差や18,19),それぞれ任意の血管に応じた VENC
を設定する必要がある点が問題点としてあげられる が17),Fick 法による Qp/Qs の測定非侵襲的で任意 の流速をすることで臨床的意義が大きいと考えられ る.Goo らの健常成人 12 名に対する類似の検討報 告はあるが,症例数が少なく , 対象が健常成人例の みでの報告であった20).撮像部位の選択に関して,
SVC に関しては奇静脈流入部位より下部で,IVC は肝静脈流入部位より上部での測定が多く採用され ている11).
われわれも同様に上大静脈は奇静脈,半奇静脈の 流入部分より右房近位側で計測している,つまり下 半身からの血流の一部を上大静脈の血流として計測 していることになる.また下大静脈の計測部位は 様々な断面での計測が可能であるが,左右腸骨静脈 合流部位,左右腎静脈合流部位,奇静脈分岐部位,
肝静脈合流部位での値は変化しやすく呼吸条件で変
動しやすいことから,今回は測定部位を肝静脈の合 流部位より上部の横隔膜レベルとした1,2,21).Qsvc は前述のように奇静脈や半奇静脈より下の断面で血 流量を計測しており,Qivc は奇静脈,半奇静脈の 分岐部位より上部で血流量を計測している.体血流 量を Qsvc + Qivc で推定する場合にはこれらの計 測部位の影響はないと考えられる.しかし,下行大 動脈への血流の一部は奇静脈や半奇静脈を介して上 大静脈に還流し,その血流量の差は心拍出量のおお むね 2 〜 4%と報告されている22,23).従って,Qivc を Qdao で代用する場合には誤差要因となる可能性 がある.
本研究での Qivc と Qdao は強く相関し,Bland- Altman 分析でも系統誤差は認めずほぼ一致してい た. そ の こ と か ら Qivc を 呼 吸 性 変 動 が 少 な い Qdao で代用することは可能と考えられた.また撮 影 断 面 の 設 定 が 容 易 で あ る こ と か ら も Qivc を Qdao で代用することが妥当であると考えられた.
次に,本研究で Qsvc と Qivc との関係および
Table 3 Statistical comparison
N mean ± SD(ml/beat) range(ml/beat)
LVSV
※ 125 37.2 ± 27.3 4.2 〜 112.0
aAoFlow 25 35.4 ± 26.2 3.9 〜 109.0
Qaao
※ 273 37.1 ± 27.2 2.8 〜 130.1
Qdao
※ 373 24.6 ± 19.7 1.1 〜 73.2
Qsvc
※ 473 16.3 ± 10.0 1.0 〜 39.1
Qivc
※ 573 23.9 ± 18.5 1.5 〜 64.8
Qsvc + Qivc 73 40.2 ± 27.4 2.7 〜 90.8
Qsvc + Qdao 73 41.4 ± 28.9 2.1 〜 107.0
Pearson correlation confficient Blant-Altman plot(absolute: ml/beat)
Flow comparison n r-value p-value mean Lower LOA Upper LOA
LVSV vs Qaao 25 0.98 < 0.01 − 3.3 − 25.1 18.5
Qivc vs Qdao 73 0.92 < 0.01 − 0.8 − 16.3 14.8
Qsvc + Qivc vs Qaao 73 0.93 < 0.01 3 − 17.5 23.5
Qsvc + Qdao vs Qaao 73 0.97 < 0.01 3.8 − 11.1 18.7
All data is summarized in Table 3.
※ 1 LVSV: Left ventricular stroke volume
※ 2 Qaao : blood flow through the ascending aorta
※ 3 Qdao : blood flow through the descending aorta
※ 4 Qsvc : blood flow through the superior vena cava
※ 5 Qivc : blood flow through the inferior vena cava
Qivc と Qdao との関係は,統計学的に強い相関関 係が明らかになった.即ち,心内シャントが存在し た場合でも,静脈還流量(Qsvc + Qivc)は大動脈 血流量に相関するが,上述したように断面設定の容 易さや,呼吸性変動に伴う値の変化を考慮すると Qivc は Qdao で代用するとより正確な値となる.
今回の目的である体血流量を算出するには Qsvc と Qdao を測定することで求めることができると考え られる.
Beerbaum らは心内奇形のある 50 人の小児(心 房中隔二次孔欠損症 40 名,3 名の部分肺静脈還流異 常,4 名の静脈洞型心房中隔欠損症:sinus venosus type ASD,3 名の心室中隔欠損症)のうち正常静 脈還流がある 37 名に CMRI-PC 法を用いて血流測 定を行い Qsvc と Qivc の合計と大動脈血流量の比 較をおこない非常に強い相関があること,Blant- Altman 法を用いた系統誤差でも認めなかったこと を報告している.しかし,Qdao の測定には触れて おらず,Qivc と Qdao との関連性も述べていない24). 小児の複合心奇形での報告は,Grosse-Wortmann らは主要体肺側副動脈を合併するファロー四徴症も しくは肺動脈閉鎖の患児 10 名に対して Qs は Qsvc と Qdao の和で Qp は肺静脈の左房への還流の合計 で算出し,Qp/Qs を求めて報告している25).しか し症例数が少なく,系統誤差などの統計学的に詳細 な検討ができていないと考えられる.
心臓カテーテル検査では測定ができない肺動脈閉 鎖などの肺血流の測定,大動脈弁狭窄などで心拍出 量の計測が難しい場合でも,上大静脈と下大静脈ま たは下行大動脈の血流量を計測することで,Qs の計 測が可能になり,各種疾患群への応用が期待される.
本研究の限界としては,CineMRI 法を用いた LVSV の測定と CMRI-PC 法を用いた各血管の血流 量の測定は,同一検査時間内には施行したが同時測 定でない.従って,時間差による心拍数の変化が結 果に及ぼす影響については分析できていない.
結 語
CineMRI 法を用いて LVSV を測定することで CMRI-PC 法で測定された Qaao の正確性を確認し た.CMRI-PC 法にて大血管各部位の血流量を正確 に計測することができた.Qs は Qsvc と Qdao の加 算値に一致することが証明された.
以上の結果から,Qaao が測定不可能な疾患群で も Qs を算出することが可能であり,各種先天性心 疾患手術前後の評価に応用が期待される.
謝辞 本研究の策定についてご指導を頂いた昭和大学横
浜市北部病院循環器センター上村茂前教授,昭和大学病 院小児循環器・成人先天性心疾患センター教授富田英教 授,そして論文執筆に対しご指導,助言をいただいた昭 和大学藤が丘病院小児科磯山恵一教授に深謝いたします.
利益相反
開示すべき利益相反はありません.
文 献
1) Finn JP, Nael K, Deshpande V, . Cardiac MR imaging : state of the technology.
. 2006;241:338‑354.
2) Fratz S, Chung T, Greil GF, . Guidelines and protocols for cardiovascular magnetic res- onance in children and adults with congenital heart disease: SCMR expert consensus group on congenital heart disease.
. (Internet). 2013;15:51.(accessed 2014 Aug 1)https://jcmr-online.biomedcentral.com/
articles/10.1186/1532-429X-15-51
3) Kozak MF, Yoo SJ, Mertens L, . Assessment of ductal blood flow in newborns with obstructive left heart lesions by cardiovascular magnetic resonance.
. (Internet). 2013;15:45.
(accessed 2015 Aug 1) http://link.springer.
com/article/10.1186/1532-429X-15-45
4) Rittgers SE, Fei DY, Kraft KA, . Velocity profiles in stenosed models using magnetic
resonance imaging. .
1989;15:43‑53.
5) Dele-Michael AO, Fujikura K, Devereux RB, . Left ventricular stroke volume quantification by contrast echocardiography - comparison of linear and flow-based methods to cardiac
magnetic resonance. .
2013;30:880‑888.
6) McLure LE, Brown A, Lee WN, . Non- invasive stroke volume measurement by cardiac magnetic resonance imaging and inert gas rebreathing in pulmonary hypertension.
. 2011;31:221‑226.
7) Culham JA, Vince DJ. Cardiac output by MR imaging: an experimental study comparing right ventricle and left ventricle with thermodilution.
. 1988;39:247‑249.
8) Nikitin NP, Constantin C, Loh PH, . New generation 3-dimensional echocardiography for left ventricular volumetric and functional measurements : comparison with cardiac
magnetic resonance. .
2006;7:365‑372.
9) Buechel EV, Kaiser T, Jackson C, . Normal right- and left ventricular volumes and myocardial mass in children measured by steady state free precession cardiovascular
magnetic resonance. .
(Internet). 2009;11:19.(accessed 2014 Aug 1)
https://jcmr-online.biomedcentral.com/
articles/10.1186/1532-429X-11-19
10) Kondo C, Caputo GR, Semelka R, . Right a n d l e f t v e n t r i c u l a r s t r o k e v o l u m e measurements with velocity-encoded cine MR imaging : in vitro and in vivo validation.
. 1991;157:9‑16.
11) L o t z J , M e i e r C , L e p p e r t A , . Cardiovascular flow measurement with phase- contrast MR imaging : basic facts and implementation. . 2002;22:651‑671.
12) Hundley WG, Li HF, Lange RA, . Assessment of left-to-right intracardiac shunting by velocity-encoded, phase-difference magnetic resonance imaging. A comparison with oximetric and indicator dilution techniques. . 1995;91:2955‑2960.
13) Mohiaddin RH, Underwood R, Romeira L, . Comparison between cine magnetic resonance velocity mapping and first-pass radionuclide angiocardiography for quantitating intracardiac shunts. . 1995;75:529‑532.
14) Brenner LD, Caputo GR, Mostbeck G, . Quantification of left to right atrial shunts with velocity-encoded cine nuclear magnetic
resonance imaging. .
1992;20:1246‑1250.
15) Bell A, Beerbaum P, Greil G, . Noninvasive assessment of pulmonary artery flow and resistance by cardiac magnetic resonance in congenital heart diseases with unrestricted
left-to-right shunt. .
2009;2:1285‑1291.
16) Arheden H, Holmqvist C, Thilen U, . Left- to-right cardiac shunts : comparison of measurements obtained with MR velocity mapping and with radionuclide angiography.
. 1999;211:453‑458.
17) Bogaert J, Dymarkowski S, Taylor AM, . eds. Clinical cardiac MRI. 2nd. ed. Heidelberg:
Springer; 2012.
18) Petersson S, Dyverfeldt P, Gardhagen R, . Simulation of phase contrast MRI of turbulent flow. . 2010;64:1039‑1046.
19) OʼBrien KR, Cowan BR, Jain M, . MRI phase contrast velocity and flow errors in turbulent stenotic jets. . 2008;28:210‑218.
20) Goo HW, Al-Otay A, Grosse-Wortmann L, . P h a s e - c o n t r a s t m a g n e t i c r e s o n a n c e quantification of normal pulmonary venous return. . 2009;29:588‑594.
21) 山本和幸,堀江朋彦,小泉 淳,ほか.下大静
脈 の 血 行 動 態 MRI に よ る 観 察. .
2009;30:666‑668.
22) Nabeshima M, Moriyasu F, Nishikawa K, . Azygos venous blood flow: measurement with direct bolus imaging. . 1995;195:467‑470.
23) B o s c h J , M a s t a i R , K r a v e t z D , . Measurement of azygos venous blood flow in the evaluation of portal hypertension in p a t i e n t s w i t h c i r r h o s i s : c l i n i c a l a n d haemodynamic correlations in 100 patients.
. 1985;1:125‑139.
24) Beerbaum P, Korperich H, Barth P, . Noninvasive quantification of left-to-right shunt in pediatric patients : phase-contrast cine magnetic resonance imaging compared with invasive oximetry. . 2001;103:2476‑
2482.
25) Grosse-Wortmann L, Yoo SJ, van Arsdell G, . Preoperative total pulmonary blood flow predicts right ventricular pressure in patients early after complete repair of tetralogy of Fallot and pulmonary atresia with major aortopulmonary collateral arteries.
. 2013;146:1185‑1190.
ESTABLISHMENT OF A METHOD FOR MEASURING SYSTEMIC BLOOD FLOW USING CARDIAC MRI PHASE IMAGING, FROM CHILDHOOD TO ADULTHOOD
Takahiro N
ISHIOKA
Department of Pediatrics, Showa University Fujigaoka Hospital
Abstract Introduction : Systemic blood flow (Qs) is equivalent to blood flow through the ascending aorta (Qaao) measured by blood flow measurement methods using cardiac MRI (CMRI);
however, in various situations including aortic stenosis with turbulence flow and the existence of abnormal shunts, the result of direct measurement of Qaao is inaccurate. This study aimed to evaluate the accuracy of the indirect measurement in cardiac MRI (CMRI). We evaluated the CMRI data of 73 patients from 2010 to 2011. The median age was 7 years (range: 0 to 72 months) and the median weight was 21.8 kg (range : 2.2 to 77.4 kg). The male to female ratio was 37:36. Blood flow through the ascending aorta (Qaao), descending aorta (Qdao), superior vena cava (Qsvc), and inferior vena cava
(Qivc) was measured using phase imaging, and the possible correlation of Qs with Qsvc and Qdao was examined. Images were taken using a 3.0, 1.5 Tesla MRI system, signal sequences were processed using the Fastcard PC method. There was a strong correlation in the following parameters: LVSV and Qaao
[correlation coefficient (r) = 0.98*], Qivc and Qdao (r = 0.92*), Qsvc + Qivc and Qaao (r = 0.92), and Qsvc + Qdao and Qaao (r = 0.97*) (*: p < 0.001). There was also agreement between each data in the Bland-Altman analysis. This study demonstrates that Qs can be measured using phase imaging by Qsvc and Qdao by blood flow measurement methods using CMRI.
Key words: cardiac magnetic resonance imaging, phase-Contrast measurement, Qs(Systemic blood flow)
〔受付:2 月 9 日,受理:2 月 27 日,2018〕