Does Choice of Topic Affect Writing Fluency? :
A Quantitative Study of Japanese University
EFL Students
journal or
publication title
言語教育センター研究年報
number
16
page range
53-76
year
2013-03-28
URL
http://hdl.handle.net/10236/14781
Does Choice of Topic Affect Writing Fluency?:
A Quantitative Study of Japanese University EFL
Students
AndrewSOWTER Michael PARRISH
Fluency in a foreign language is often equated with speaking well, while less emphasis has been placed on writing fluency as it is often seen as a more solitary and reflective skill. However, with the proliferation of internet-based social media and high-stakes tests which focus on written expression under timed constraints, the ability to write quickly, clearly, and confidently is increasingly important. This study aims to assess whether allowing students the freedom to choose their own writing topic has an effect on writing fluency, defined here as being the type-token ratio of total number of words to number of unique words in a written text. Findings of this empirical study suggest that there was a significant increase in fluency when students were allowed to choose their own topics, compared to when the instructor assigned the topic. An additional finding was that there was no significant difference in writing fluency between students who wrote by hand and those who used a personal computer, for the same topics.
The issue of fluency is usually equated with speaking ability, but it also includes literacy, both reading and writing. With the proliferation of internet-based social media and high-stakes tests which focus on written expression under timed constraints, the ability to write quickly, clearly, and confidently in English (as a foreign language) is becoming increasingly important for students (ETS, 2011; Mohammadi & Barzgaran, 2012).
This study is partly the result of the authors’ collaborating in a larger professional development project for language teachers aiming to develop their skills in using quantitative research methods in
classroom-based research established by Greg Sholdt, at Kobe University (Sholdt, 2012a, 2012b). The present study is based, in part, on a similar study by Bonzo (2008) which investigated the written fluency in German of American university students. His study found that there was a
significant increase in the fluency and complexity of writing when students were allowed to choose their own topics. The aim of this study to see if the results of Bonzo’s study can be reproduced in the case of Japanese
university EFL students.
What is written fluency?
Wolfe-Quintaro, Inagaki and Kim (1998) assert that the various different ways in whichfluency in general, and writing fluency in particular, has been characterised has resulted in confusion over its definition. However, at its simplest, written fluency is the amount of writing done in a set amount of time, i.e., the number of words per minute. Using this concept as the basis for measuring writing fluency, a researcher could justifiably use total words as a measure of writing fluency. Many researchers have in fact used this method of calculation. However, Wolf-Quintaro et al., (1998) did an extensive review of the literature comparing the effectiveness of the various methods that have been used to measure writing fluency. In spite of the fact that some researchers had achieved significant results, Wolf-Quintaro et al. (1998) ultimately decided that using total words as a measure of writing fluency had serious
shortcomings in terms of accuracy, sensitivity, and reliability (p.16). Therefore, a more complete measure of fluency needs to be used, one which considers not only quantity but quality and complexity of writing. Short, repetitive, basic sentences [e.g., I like dogs. I like spaghetti, too.] might constitute a large volume of words, but certainly a student who used longer sentences or a greater variety of vocabulary would be considered
more fluent.
Other researchers use the more complex type-token ratio (TTR) which measures lexical density as the number of word types divided by the number of words. This ratio, while more complex, also has its
shortcomings as a measure of writing fluency, namely the fact that it does not consider the overall length of the writing produced. The pitfall of using this ratio (and similar ratios) to measure writing fluency was originally discussed by Carroll (1967) and analyzed at length by Wolf-Quintaro et al. (1998). Simply stated, the longer a piece of writing, the more negatively the fluency score is affected due to the increased repetition of word types. This adverse effect on fluency scores resulted in Wolf-Quintaro et al. (1998) recommending the alternative ratio advocated by Carroll (1967), which is actually a measure of lexical density. Defined as the Word Type (WT) count divided by the square root of two times the Total Words (TW), this ratio takes into consideration writing length and rewards greater production of words with higher scores. This rationale was supported by both Arthur (1979) and Bonzo (2006) who used this ratio as a measure of writing fluency in their own studies.
This study will utilize two methods for measuring writing fluency. For the reasons discussed above, the first measure will be the lexical
density ratio described by Carroll (1967) which is used as a proxy measure for writing fluency. To maintain consistency and comparability with other researchers in the Sholdt WFP research project, in particular in the area of data collection and analysis, we have used unique words (UW) in place of word types (WT) [The difference between the two measures is that ‘cat’
and ‘cats’ would be counted as two unique words, but as the same, single word type]. The second measure used will simply be the number of unique words produced by the student. This measure was selected as the method of determining writing fluency for all members within the collaborative research project. Therefore, in order to be able to compare the results of this study with studies conducted by other members collaborating on this research project, it was decided to use unique words in addition to the lexical density ratio.
The Effects of Mode of Writing
Writing is a complex process with both psychological and physiological components. Toft (2012) describes research that indicates there is a powerful connection between writing by hand and learning which may be inhibited when using a keyboard. In particular, recognition and recall of new characters in an unknown language is significantly enhanced when learned by handwriting rather than by typing on a keyboard.
Nevertheless, composing and writing on a computer and word processor has certain advantages in terms of ease of correction and review, especially for habitual computer users. This issue has become more salient to the field of English language learning since the launch in 2005 of the TOEFL-iBT computer-based test which in turn led to promulgation of computer-based versions of other testing regimes such as the TOEIC, and Cambridge IELTS, BULATS, PET, and KET (ETS, 2011; Mohammadi & Barzgaran, 2012). However the research is not clear. In the case of L2 writing under timed constraints, there is a great deal of contradictory results in the quantity and quality of production between paper-and-pencil based and computer-based modes of writing (Lee, 2002; Lee, 2004). Y.J. Lee (2002) compared essays written by hand and by computer and found that the average production was higher for computer users. However, H.K. Lee (2004) found that there was no significant difference in the holistic ratings of essays written by hand or by computer, but that computer-based essays were marked significantly higher for analytic components such as cohesion,
structure, or grammar. So, in light of these contradictory previous findings, the effect of handwriting versus computer use is of interest in this study.
RESEARCH QUESTIONS
In considering the above concepts, the following research questions were posed:
a. Does choice of topic affect overall written fluency?
b. Does writing mode (computer keyboard or handwriting) affect overall written fluency?
METHOD Participants
Participants (N=54; 23 males and 31 females) were second-year Japanese university students enrolled in three intact, intermediate-level, four-skills oriented classes in an intensiveEnglish program (IEP) at a large private university in the Kansai region of Japan. The classes have
competitive enrollment based on TOEFL-ITP scores; these groups’ scores ranged from 440 to 525. All students were of a similar age (18-19 years old) and each individual class was comprised of students from the same faculty: Group A was from the Sociology Department; Group B, Law; and Group C, Business. Neither gender, age, nor academic major were analyzed as variables in this study. All students signed consent forms agreeing to take part in the study.
Procedure
The three classes (Groups A, B & C) were counterbalanced in terms of topic control to minimize order of treatment as a confound. However, unlike Bonzo’s study where there were four sessions with the same condition, topics were alternated after each session with depending on the instructor, as depicted in Table 1.
As described previously, there are questions about the effect of writing by hand or typing on writing fluency. Therefore, it was considered
important to know what effect typing on a computer keyboard would have on students’ writing fluency and the condition of ‘using a computer to write’ (typing) was introduced to one of the classes. Group A were asked to compose and submit their writing samples on a personal computer in a discussion thread hosted on the campus-based, on-line learning
management system (LMS), called LUNA (based on the Blackboard™ system). The other participants (Groups A and C) used pencil and paper to compose and submit their writing samples.
TABLE 1
Design of the Counter-Balanced Study
Writing Activity Group A (PC) Group C (handwritten) Taught by instructor 1 Group B (handwritten) Taught by instructor 2
1 Free writing Life after graduation 2 Life after graduation Free writing 3 Free writing Favorite classes & subjects 4 Favorite classes & subjects Free writing
Depending on the schedule determined by the counter-balanced design (Table 1), the teacher either informed the students of the topic by saying it and writing it on the chalkboard (or computer screen) or announced that the topic was “free” or “open” and they were allowed to write about anything they wanted.
The class designated to use computers (Group A) was given one practice topic to familiarize them with the layout of the on-line discussion forum and with the method of inputting their writing sample. The topic chosen for the practice session was a series of questions about the students’ experience with and attitudes towards computers in general and
computer-mediated writing. The students wrote their responses in a dedicated discussion forum within the class’s LUNA page.
practice session to familiarize them with the writing procedure and the coding used on the writing sample papers. The practice session was comprised of writing for five minutes on a Teacher Assigned (TA) topic followed by five minutes of writing on a Student Selected (SS) topic. Before each writing activity, the students were given two minutes to prepare. In addition, in the practice session only, a short brainstorming activity was conducted to generate self-selected topics. However in accordance with Bonzo’s procedure, during the actual SS topic writing activities, no further instructions regarding topic choice were provided to the students. Topics used in practice sessions were not repeated in the main study.
After the practice activities were completed, the four writing activity sessions were then carried out over four consecutive weeks, following the alternating counterbalanced approach previously discussed (in Table 1). In each writing session the students were given two minutes to think about their topic and plan their writing. They were then requested to either circle ‘topic’ or ‘free writing’ on their answer sheet and to write down their topic title, either TA or SS topics. They were then given ten minutes to write as much as they could on the topic; this limit was strictly adhered to using a stop watch counting down from ten minutes with a time warning given at one minute.
To encourage experimentation and risk-taking, the students were explicitly told that the writings would not be graded or evaluated in any way for grammatical or spelling accuracy. Although they were allowed to use dictionaries for unknown words, they were also reminded of the time constraints. Students were encouraged to keep writing and to not worry about mistakes. The only requirements were that the sample be in English; there was no prescribed length or format. Similarly to Bonzo (2008), there was no feedback provided to the students in terms of error correction, however unlike Bonzo (2008), there were no general comments provided to the students regarding content.
The papers were collected at the end of ten minutes for
assessment. All handwritten texts from Groups B and C were transcribed into digital format as word processed documents. All student writing, Groups A, B and C, were then analysed for Total Words (TW) and Unique Words (UW), using an online text analyzer provided by UsingEnglish.com. Fluency was then measured in two ways. Firstly, the UW counts were analysed to determine if there was any significant difference in the amount of unique words produced by the students when self-selecting topics, compared to having topics assigned by the teacher. This was a simple look at the quantity of student writing produced; however, a second more sophisticated method was also used which measured the lexical density of the text as well as the quantity of writing produced. This was calculated using the lexical complexity ratio described by Carroll, (1967) and which in this paper will henceforth be referred to as Carroll’s Ratio (RC) where RC
= UW
y
, i.e., writing fluency equals the Unique Word (UW) count divided by the square root of two times the Total Word (TW) count. This ratio, originally designed to measure lexical density, has also been used successfully to measure fluency in previous studies and is useful because it is more sensitive than merely using UW or TW or the ratio of UW/TW alone (Bonzo, 2008; Wolfe-Quintero, et al., 1998).The resulting data sets for groups A, B and C, were then analysed with independent t -tests (two-tailed), using the online VassarStats
statistical software, to determine if choice of topic resulted in a change in student writing fluency.
The data sets for Groups A and C were also analysed to determine if there were any significant differences in fluency for students writing by hand compared with students typing on a PC. This was done by comparing the two groups’ mean fluency scores, both RC and UW, for each individual
TA topic, (activities TA2 and TA4) the combined SS topics (activities 1 and 3) and an overall combined mean (activities 1 -4). The null hypothesis used stated that using different methods of writing would not result in a change
in the groups’ fluency scores. Note that Group B was excluded because the different instructor and order of topics could have resulted in a confound.
RESULTS
Method of writing
Tables 2 and 3 show the results of the t-tests performed to determine if there was any difference in the writing fluency scores of the students typing their writing samples as opposed to the students who were writing them by hand.
TABLE 2
Effect of Writing Method on Fluency Using Carroll’s Ratio (RC)
Writing Activity RC Group A Typed (MeanA) RC Group C Handwritten (MeanC) MeanA – MeanC p (two-tailed) 2 (TA 1) 4.076 4.155 -0.079 0.721 4 (TA 2) 3.816 4.031 -0.2147 0.266 1 & 3 (SS) 4.213 4.275 -0.0618 0.728 Total 1-4 4.080 4.184 -0.104 0.514 *p< .05 TABLE 3
Effect of Writing Method on Fluency Using Unique Words (UW)
Writing Activity UW Group A Typed (MeanA) UW Group C Handwritten (MeanC) MeanA – MeanC p (two-tailed) 2 (TA 1) 50.571 56.200 -5.629 0.349 4 (TA 2) 42.000 51.933 -9.933 0.057 1 & 3 (SS) 54.786 55.867 -1.081 0.827 Total 1-4 50.536 54.967 -4.431 0.223 *p< .05
As observed in Tables 2 and 3, while all the results indicated a pattern of slightly better fluency for the hand written texts over typed texts, the p-values indicate that this result was not significant. This result strongly suggests that any differences are merely attributable to chance. Furthermore, as all t-test results failed to reject the null hypothesis, it can be inferred that the method of writing, either typing or writing by hand, did not affect the analysis of the choice of topic.
Effect of student selected (SS) versus teacher assigned (TA) topics
The mean writing fluency test scores, both UW and RC, for each
individual group and also the cumulative total of all groups (A, B & C), were analysed using independent t-tests to determine if there were any differences between the case where the topic is assigned by the teacher (TA) versus when it is self-selected (SS). Tables 4 and 5 describe the results of the t-tests for RC and UW respectively. All descriptive statistics
describing how the t-tests were constructed have been included in Appendix B for the readers’ review.
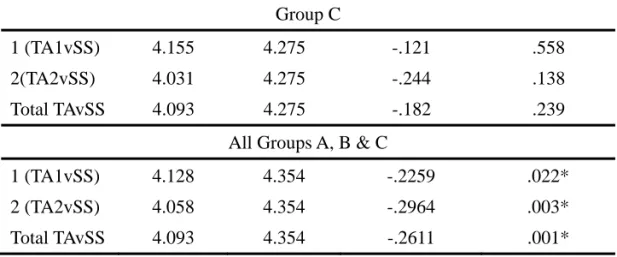
TABLE 4
Effect of Topic Choice on Fluency as Measured by Carroll’s Ratio RC
Activity for each class group (A-B) RC Teacher Assigned (MeanTA) RC Student Selected (MeanSS) MeanTA- MeanSS p (two-tailed) Group A 1 (TA1vSS) 4.076 4.213 -.137 .399 2(TA2vSS) 3.816 4.213 -.397 .025* Total TAvSS 3.946 4.213 -.267 .051 Group B 1 (TA1vSS) 4.167 4.583 -.4166 .003* 2(TA2vSS) 4.361 4.583 -.222 .113 Total TAvSS 4.264 4.583 -.3194 .006*
Group C
1 (TA1vSS) 4.155 4.275 -.121 .558 2(TA2vSS) 4.031 4.275 -.244 .138 Total TAvSS 4.093 4.275 -.182 .239
All Groups A, B & C
1 (TA1vSS) 4.128 4.354 -.2259 .022* 2 (TA2vSS) 4.058 4.354 -.2964 .003* Total TAvSS 4.093 4.354 -.2611 .001* *p< .05
Tables 4 and 5 describe the results of t-tests conducted to
determine if there were differences in fluency for each of the individual TA topic results (TA1 and TA2) compared to a combination of SS topics for each individual class (Groups A-C) and also the combined TA topic results versus the combined SS topic. A further set of t-tests TA was carried out that included the cumulative results from all three groups (Total TAvSS).
Table 4 shows that the sign of the difference in means (MeanTA- MeanSS) was in the predicted direction (i.e., negative) in every case. This
indicates that in this particular study the SS topics had resulted in greater fluency (RC). However, this was only found to be statistically significant in
six (of 12) cases. The most significant of these results was in the cumulative analysis of all the groups. These results were statistically significant for both the individual topics, TA1 (p=.042) and TA2 (p=.007) as well as for the overall comparison TAvSS (p=.004). This result supports the findings reported by Bonzo (2008), that writing fluency is positively affected by student selection of topic. A closer analysis of the individual topics (TA1 and TA2) suggests that in both cases, student writing fluency improved when the students were allowed to select their own topics. However, while both of these results were statistically significant, the larger difference in means for TA2 suggest that students found the teacher’s
suggested topic (favorite classes and subjects) particularly un-engaging in comparison to their self-selected topics.
At the individual group level, the difference in mean fluency scores (MeanTA- MeanSS) using the RC ratio between SS and TA topics was
not statistically significantly different for Groups A and C; however, they were statistically significant at the p< .05 level for Group B. Within each group the results of the t-tests comparing SS and TA topics for each individual topic (TA1 and TA2) indicated that the differences are
statistically significant at an individual topic level. For example, in Group A the comparison of TA2 (favorite classes and subjects) and SS resulted in a difference in fluency that was statistically significant (p=.025).
Interestingly, the result was markedly different for TA1 (Life after graduation), in which there was a much smaller difference in fluency between the two treatments, and one which was considered not to be statistically significant. A similar pattern occurred for Group B; however, in this case it was TA1 which registered a statistically significant difference in written fluency. In contrast, the TA2 topic, while still indicating that a greater level of fluency was achieved when the topic was student selected, the difference was found not to be statistically significant (p=.113).
TABLE 5
Effect of Topic Choice on Fluency as measured by Unique Words (UW)
Activity UW Teacher Assigned (MeanTA) UW Student Selected (MeanSS) MeanTA- MeanSS p (two-tailed) Group A 1 (TA1vSS) 50.57 54.79 -4.21 .372 2(TA2vSS) 42.00 54.79 -12.79 .009* Total TAvSS 46.29 54.79 -8.50 .026*
Group B 1 (TA1vSS) 56.61 69.64 -13.03 .005* 2(TA2vSS) 64.00 69.64 -5.64 .217 Total TAvSS 60.31 69.64 -9.33 .014* Group C 1 (TA1vSS) 56.20 55.87 .33 .945 2(TA2vSS) 51.93 55.87 -3.93 .358 Total TAvSS 54.07 55.87 -1.80 .654
All Groups A, B & C
1 (TA1vSS) 54.14 60.04 -5.89 .042*
2(TA2vSS) 52.09 60.04 -7.94 .007*
TAvSS 53.12 60.04 -6.92 .004*
*p< .05
These results, describing the change in writing fluency using Carroll’s measurement of lexical density (RC) in Table 4, are supported by
the unique word (UW) t-tests presented in Table 5. This is partly due to the fact that the UW value is included in the calculation of the RC ratio. Once
again, in all cases except for one (Group C TA1vSS), when the students were able to select their own topic, writing fluency increased, i.e., they produced more unique words. In the overall comparison, SS topics resulted in seven more unique words being produced per test than for the TA topics. This result was considered statistically significant (p=.004). In addition, a similar pattern was observed in the results for the individual topics in Groups A and B.
DISCUSSION
This section discusses and interprets the results of our study and their implications for future research.
Effect of Mode of Writing
Tables 2 and 3 showed the results of the comparison of writing fluency between Group A, who wrote their samples on a computer and Group C, who wrote them by hand. After reading the comments from Group A’s practice session which asked about students’ preferences for and experiences with computers, it was predicted that there would be a
significant difference in fluency between the two modes of writing. The reason for this prediction was that there were many negative comments made by students about the use of computers for timed writing. One student complained during free writing that she had written three sentences and then mistyped, erasing them and was unable to remember what she had previously written. She concluded, “So I think writing by hand is good.” Another student wrote, “I am not used to type on a keyboard. I do not like typing a keyboard. So, I am stressful now. I am angry now.” He argued that “if you continue to make us typing a keyboard, you cannot measure our English skill.” In spite of these negative attitudes, the mean fluency assessments of Group A, writing on a keyboard, compared to those of Group C, writing by hand, were not statistically different. This finding indicates, contrary to our predictions, that using computers for collecting writing samples does not significantly reduce writing fluency, and is therefore a viable and efficient method for future studies of this nature.
One possible problem with this particular part of this study is that although the groups compared were quite similar in many respects, the tests were not conducted on the same subjects—as they were for the analysis of the effect of choice of writing topic on fluency. A second problem is that the sample size was quite small (Group A, N=18 and Group C, N=15). A larger sample size would provide a more accurate estimate of the effect of writing mode on writing fluency. A future study would examine the effect of mode of writing on fluency using a counter-balanced research design as well as a larger sample size. Other ideas for
effects of using a pen instead of a pencil or of prohibiting erasers during the writing session. Similarly controlling for typing speed and levels of student computer fluency is also recommended.
Effect of Topic of Writing
The null hypothesis posed in all t-tests was that there would be no differences between writing fluency when the teacher assigned the topic, as compared to when the students selected their own topics. In all cases for RC
and all but one for UW, the negative difference in means (MeanTA- MeanSS) suggests that there was greater writing fluency when the topic was student selected. This result was significant for RC in the cases of Group B and the
cumulative group analysis (Groups A, B & C) and for Groups A and B as well as the cumulative group analysis (Groups A, B & C) in the case of UW. The other cases failed to reject the null hypothesis, indicating these results could have been chance events. However, it was clear that in the case of the total group analysis for both fluency measures, the p value was particularly significant, especially in the case of the RC for all groups, i.e.;
Total TAvSS (p = .001). This strongly suggests that the difference in fluency, and possibly lexical density, that was measured between the student choice of topic and the teacher assigned topic is unlikely to be due to chance. Therefore, any difference in fluency is more likely due to the student’s being able to choose the topic.
Similarly the p-value for the UW fluency measurement for all groups TAvSS (p =.004) indicates that the ability to choose the topic has resulted in more unique words being written by the students. For example, on average the students in Group A were producing almost 13 more unique words for SS topics than they did for the second TA topic (TA2: favorite classes & subjects). Similarly, in Group B, there is a 13-word difference favoring student selection; again, this difference occurs when compared to the first of the teacher assigned topics (TA1: life after graduation). These results follow the same pattern observed using Carroll’s ratio, displayed in Table 4. In both instances, these values are statistically significant. These
results suggest that students in these classes have found the teacher assigned topic to be un-motivating or un-exciting, which has resulted in fewer unique words being produced. By inference, this result also
strengthens the suggestion that allowing the students to choose will result in greater writing fluency; i.e., an increase in both quantity of writing and lexical density.
Some of the lack of difference in fluency, in contrast to previous studies such as Bonzo (2008) may be attributable to the relatively small sample size of each group, the smaller number of writing samples per student, and the relatively short duration of the project (four weeks versus eight weeks for Bonzo). Bonzo (2008) used a total of 81 participants who each wrote 8 writing samples, whereas this study examined only four writing samples from 54 students
In addition, Bonzo (2008) made an effort to provide
non-corrective feedback on all student writings (Interesting. That’s too bad.
Sounds fun!); whereas in the current study, feedback was not provided.
Such feedback may have encouraged students to write more as it would have created a meaningful exchange and a clear communicative purpose for writing (Wilson, 2006, p. 56).
CONCLUSION
The results of this study indicates that when students are given the freedom to choose their own topic, compared to when the teacher assigns a topic, it will result in improved writing fluency. This result could be an example of increased intrinsic motivation resulting in greater student learning, for as Ellis (1997) states, “…motivation involves the arousal and maintenance of curiosity and can ebb and flow as a result of such factors as learners’ particular interests and the extent to which they feel personally involved in learning activities” (p.76). Surely, self-selecting their topic for writing will result in an activity that is both personal and interesting to the students and therefore more likely to engage them. Language educators
could take advantage of this result by allowing their students more autonomy over their topic selection
ACKNOWLEDGEMENTS
The authors would like to acknowledge the guidance and support of Greg Sholdt and the members of the Writing Fluency Project 2012, and the student participants who agreed to share their writing samples. This project would not have been possible without their help.
REFERENCES
Arthur, B. (1979). Short-term changes in EFL compositions skills. In C. Yorio, K. Perkins, & J. Schachter (Eds.), On TESOL ’79: The learner in focus: Selected
papers from the thirteenth annual convention to teachers of English to speakers of other languages (pp. 330-342). Washington, DC: TESOL.
Bonzo, J. D. (2008). To assign a topic or not: Observing fluency and complexity in intermediate foreign language writing. Foreign Language Annals, 41(4), 722-735.
Carroll, J. B. (1967). Foreign language pro¿ciency levels attained by language majors near graduation from college. Foreign Language Annals, 1, 131–151.
Educational Testing Service. (2011). TOEFL iBT Research Insight, Series1, Vol. 6. Retrieved February 2, 2013 from
http://www.ets.org/s/toefl/pdf/toefl_ibt_insight_s1v6.pdf
Ellis, R. (1997). Second language acquisition (Vol. 2). New York, NY: Oxford University Press.
King, A. & Flynn, R. (2012). Text Analysis Tool [Computer software]. Hertfordshire, UK. Retrieved January 11, 2013 from
http://www.usingenglish.com/resources/text-statistics.php
Lee, H. K. (2004). A comparative study of ESL writers’ performance in a paper-based and a computer-delivered writing test. Assessing Writing, 9, pp. 4-26. Lee, Y. J. (2002). A comparison of composing processes and written products in
timed-essay tests across paper-and-pencil and computer modes. Assessing
Writing, 8, pp. pp. 135-157.
Lowry, R. (2013). VassarStats: Website for Statistical Calculation [Computer software]. Poughkeepsie, NY: Vassar College. Retrieved January 12, 2013 from http://vassarstats.net/
Mohammadi, M. & Barzgaran, M. (2012). Comparability of Computer-based and Paper-based Versions of Writing Section of PET in Iranian EFL Context.
Sheikhbahaee EFL Journal, 1(2), pp. 1-20. Retrieved February 1, 2013
Sholdt, G., Konomoto, B. Mineshima, M. & Stillwell, C. (2012a). Sharing
Experiences with Quantitative Research. In A. Stewart & N. Sonoda (Eds.),
JALT2011 Conference Proceedings. Tokyo: JALT, pp. 616-623.
Sholdt, G. (2012b). SOLAC WFP 2012 [Moodle website]. Retrieved January 17, 2012 from http://moodle.solac.kobe-u.ac.jp/course/category.php?id=19 Toft, T. E. (2012). Better learning through handwriting. University of Stavanger
website. Retrieved January 31, 2013 from http://www.uis.no/news/article29782-50.html
Wilson, L. (2006). Writing to live: How to teach writing for today’s world. Portsmouth, NH: Heinemann.
Wolfe-Quintero, K., Inagaki, S., & Kim, H.Y. (1998). Second language development
in writing: Measures of fluency, accuracy, & complexity. Honolulu, HI:
APPENDIX A: Glossary of Terms & Abbreviations Group A – Instructor 1 text entry was typed using a PC Group B – Instructor 2 text entry was handwritten Group C – Instructor 1 text entry was handwritten
RC – Carroll’s Ratio of lexical density (and fluency) = UW¸
SS - Student Selected Topic TA – Teacher Assigned Topic
T-unit– A main clause and all the subordinate clauses attached to it (often a sentence)
TW - Total Words, total number of token words UW – Unique Words
WT–Word types [NB Wolfe-Quintaro, et al. (1998) also use this abbreviation to describe the number of words in a T-unit in other analyses]
APPENDIX B: Descriptive Statistics for Tables 4 and 5
TABLE 6a
Descriptive Statistics for Group A using Carroll’s Ratio RC
RC Teacher Assigned Topics
(TA) RC Self-Selected Topics (SS) Class groups N M SS N M SS 1 (TA1vSS) 21 4.076 5.173 42 4.213 16.993 2(TA2vSS) 21 3.816 8.521 42 4.213 16.993 Total TAvSS 42 3.946 14.402 42 4.213 16.993 TABLE 6b
Descriptive Statistics for Group A using UW UW Teacher Assigned Topics (TA) UW Self-Selected Topics (SS) Class groups N M SS N M SS 1 (TA1vSS) 21 50.57 4315.1 42 54.79 14435.1 2(TA2vSS) 21 42.00 4846.0 42 54.79 14435.1 Total TAvSS 42 46.29 9932.6 42 54.79 14435.1
TABLE 7b
Descriptive Statistics for Group B using UW UW Teacher Assigned Topics (TA) UW Self-Selected Topics (SS) Class groups N M SS N M SS 1 (TA1vSS) 18 56.61 3992.7 36 69.64 8328.3 2(TA2vSS) 18 64.00 4416.0 36 69.64 8328.3 Total TAvSS 36 60.31 8899.6 36 69.64 8328.3 TABLE 7a
Descriptive Statistics for Group B using Carroll’s Ratio RC
RC Teacher Assigned Topics
(TA) RC Self-Selected Topics (SS) Class groups N M SS N M SS 1 (TA1vSS) 18 4.167 3.918 36 4.584 7.499 2(TA2vSS) 18 4.361 4.434 36 4.584 7.499 Total TAvSS 36 4.264 8.692 36 4.584 7.499
TABLE 8a
Descriptive Statistics for Group C using Carroll’s Ratio RC
RC Teacher Assigned Topics
(TA) RC Self-Selected Topics (SS) Class groups N M SS N M SS 1 (TA1vSS) 15 4.031 2.156 30 4.275 9.048 2(TA2vSS) 15 4.155 9.003 30 4.275 9.048 Total TAvSS 30 4.093 11.274 30 4.275 9.048 TABLE 8b
Descriptive Statistics for Group C using UW UW Teacher Assigned Topics (TA) UW Self-Selected Topics (SS) Class groups N M SS N M SS 1 (TA1vSS) 15 56.2 6112.4 30 55.87 5023.5 2(TA2vSS) 15 51.93 2744.9 30 55.87 5023.5 Total TAvSS 30 54.07 8993.9 30 55.87 5023.5
TABLE 9a
Descriptive Statistics for all Groups A-C using Carroll’s Ratio RC
RC Teacher Assigned Topics
(TA) RC Self-Selected Topics (SS) Class groups N M SS N M SS 1 (TA1vSS) 54 4.1282 18.190 108 4.354 36.457 2(TA2vSS) 54 4.058 18.008 108 4.354 36.457 Total TAvSS 108 4.093 36.331 108 4.354 36.457 TABLE 9b
Descriptive Statistics for all Groups A-C using UW UW Teacher Assigned Topics
(TA) UW Self-Selected Topics (SS) Class groups N M SS N M SS 1 (TA1vSS) 54 54.14 14860.8 108 60.04 32785.9 2(TA2vSS) 54 52.09 16698.5 108 60.04 32785.9 Total TAvSS 108 103.12 31673.4 108 60.04 32785.9