首都大学東京 博士(理学)学位論文(課程博士)
論 文 名
Structural studies of the multi-domain RNA binding protein Nrd1 and its interactions.
RNA結合性マルチドメインタンパク質Nrd1の構造と相互作用の研究(英文)
著 者 小林 彩保
審査担当者 主 査 委 員 委 員
上記の論文を合格と判定する
平成 年 月 日
首都大学東京大学院理工学研究科教授会 研究科長
DISSERTATION FOR A DEGREE OF DOCTOR OF PHILOSOPHY IN SCIENCE
TOKYO METROPOLITAN UNIVERSITY
TITLE:Structural studies of the multi-domain RNA binding protein Nrd1 and its interactions.
AUTHOR: Ayaho Kobayashi
EXAMINED BY
Examiner in chief
Examiner
Examiner
QUALIFIED BY THE GRADUATE SCHOOL OF SCIENCE AND ENGINEERING
TOKYO METROPOLITAN UNIVERSITY
Dean
Date
Contents
Contents
Abbreviations and Acronyms
1. General introduction 1
1-1 Multidimensional NMR 2
1-2 X-ray crystallography 5
1-3 Small angle X-ray scattering 6
1-4 Structural analysis of multi-domain proteins 7 2. Structural studies of full-length Nrd1 9
2-1 Introduction 10
2-1-1 Biological background 10
2-1-2 Aim of this study 11
2-2 Materials and methods 13
2-2-1 Expression and purification of Nrd1 13 2-2-2 NMR spectroscopy and chemical shift assignment 15
2-2-2-1 Nrd1 RRM2 15
2-2-2-2 Nrd1 RRM1-2 16
2-2-3 RNA binding analysis 18
2-2-4 SAXS experiments 19
2-2-5 Reconstruction of Nrd1 using sortase 20 2-2-6 Expression and purification of GST-Pek1DD/
GST-pPmk1 22
2-3 Results 23 2-3-1 Preparation and characterization of each RRM domain 23
2-3-2 RNA binding analysis 32
2-3-3 Interaction among RRMs 35
2-3-4 Structure determination of Nrd1 RRM2 37 2-3-5 Structure determination of Nrd1RRM1-2 39 2-3-5-1 Structure of Nrd1 RRM1-2 derived NOEs 39
2-3-5-2 RDC 42
2-3-5-3 PCS 43
2-3-6 SAXS experiments 44
2-3-7 Reconstruction of Nrd1 using sortase 48
2-3-8 Phosphorylation of Nrd1 49
2-4 Discussion 52
2-4-1 Features of Nrd1 RRM2 52
2-4-2 Structure comparison of Nrd1 RRM2 and Nab3
RRM-RNA 54
2-4-3 Structure comparison of Nrd1 RRM1 and Nab3
RRM-RNA 57
2-4-4 Region of Nrd1 suggested to be involved in RNA
binding 57
2-4-5 The model of regulation of Nrd1 by the phosphorylation 57
The list of primers 59
The list of plasmids 65
3. Structural studies of Cpc2 72
3-1 Introduction 73
3-1-1 Biological background 73
3-1-2 Aim of this study 74
3-2 Materials and methods 74
3-2-1 Expression and purification of Cpc2 74 3-2-2 NMR spectroscopy and chemical shift assignment
of Cpc2 76
3-2-3 Crystallization of Cpc2 76
3-2-4 X-ray diffraction data collection of the crystals of
Cpc2 77
3-2-5 Structural determination and refinement of Cpc2 78 3-2-6 SPR analyses for Cpc2 with phosphorylated peptides
of Nrd1 78
3-3 Results 79
3-3-1 Preparation of Cpc2 79
3-3-2 Structure determination of Cpc2 in crystallization 82 3-3-3 Interaction between Nrd1 and Cpc2 85 3-3-4 SPR analyses for Cpc2 with phosphorylated peptides
of Nrd1 89
3-4 Discussion 90
3-4-1 Structure comparison of Cpc2 and RACK1 90 3-4-2 Structure comparison of Cpc2 with Fbw7-pCycE
complex and WDR5-Histone H3 complex 93 3-4-3 Structural implications for interaction of Nrd1
with Cpc2 96
3-4-4 The model of regulation of stress granules 96
The list of primers 98
The list of plasmids 99
4. Conclusion 100
References 103
Acknowledgements 113
Abbreviations and Acronyms
3D 3 dimension Amp ampicillin
Cp chloramphenicol
DEAE diethylaminoethyl D2O deuterated water (2H2O) DTT dithiothreitol
EDTA ethylene diamine tetra-acetic acid 2Na E. coli Escherichia coli
GSH reduced glutathione GST glutathione S-transferase
HEPES 4-(2-hydroxyethyl)-1-piperazineethanesulfonic acid HRV3C human rhinovirus 3C
HSQC hetero-nuclear single quantum coherence IPTG isopropyl--D-thiogalactopyranoside
Kan kanamycin
LB Luria–Bertani
NMR nuclear magnetic resonance NOE nuclear overhauser effect NOESY NOE spectroscopy
Nrd1 negative regulator of differentiation 1 O. D. optical density
PAGE polyacrylamide gel electrophoresis PCR polymerase chain reaction
PEG polyethylene glycol RDC residual dipolar coupling SAXS small angle X-ray scattering SDS sodium dodecyl sulphate
Tris tris(hydroxymethyl) aminomethane
TROSY transverse relaxation-optimized spectroscopy
1
1. General introduction
2
1. General introduction
【1-1 Multidimensional NMR】
Multidimensional NMR is a powerful technique used for determining the solution structure of proteins, nucleic acids and complexes (kanelis et al., 2001). Using the uniform labeled samples with 13C and 15N, a series of triple resonance experiments for obtaining chemical shift assignments. Three-dimensional experiments utilizing the J-couplings between 13C and 15N. HNCACB, CBCA(CO)NH, HNCA, HN(CO)CA, HN(CA)CO and HNCO experiments are useful for backbone assignments. HNCACB correlates the 1HN and 15N shifts of residue i with the 13C and 13C shifts of residues i-1 and i. By contrast, CBCA(CO)NH correlates the 1HN and 15N shifts of residue i with the 13C and 13C
shifts of residues i-1. HNCACB and CBCA(CO)NH may be used as a pair of experiments.
For samples provide low sensitivity, HNCA and HN(CO)CA are quite useful for obtaining the correlation of intra- and inter residue 13C and 15N nuclei. HN(CA)CO correlates the
1HN and 15N shifts of residue i with the 13CO shifts of residues i-1 and I, and HNCO correlates the 1HN and 15N shifts of residue i with the 13CO shifts of residues i-1.
HN(CA)CO and HNCO may be used as a pair of experiments. Each strip of the spectra can be linked to the next strip of peaks from an adjacent residues, allowing the strips to be connected sequentially. For side-chain assignments, H(CCO)NH and C(CO)NH
3
spectra provide the hydrogen and carbon side-chain chemical shifts for the residue preceding each NH group. HCCH-TOCSY and 4D HC(CO)NH provide combinations of
13C and 1H assignments. In the next step, a number of short-range distances between protons which can be estimated from the signal intensities in the 2D NOESY, 3D 15N- NOESY-HSQC and 3D 13C-NOESY-HSQC spectra for structure calculation. NOE depends on the distance between two nuclei i and j, according to: NOEij ~ 1/rij6.
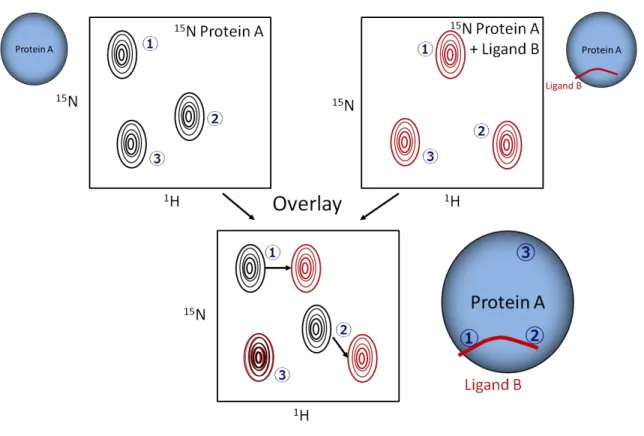
Chemical shifts perturbation experiments is useful method for examine the interaction between biomolecules. In Fig. 1, chemical shifts are changed in position ① and ②, but chemical shift is not changed in position ③. Chemical environment changes in position ① and ② indicate that position① and ② are potential ligand binding site.
Chemical shift perturbation can be used to map the binding sites.
4
Fig. 1 Schematic drawing of the chemical shifts perturbation experiment.
Chemical shifts are changed in position 1 and 2, but chemical shifts are not changed in position 3, indicate chemical environment changes in position 1 and 2 indicate that position 1 and 2 are ligand binding sites.
5
【1-2 X-ray crystallography】
X-ray crystallography is a major technique for structure determination of biomolecules (Smyth et al., 2000), an excellent method for structure determination especially for rigid proteins in terms of precision, speed and robustness. As a first step, however, it is necessary for the suitable crystals of biomolecules to obtain x-ray diffraction data. The nucleation and growth of crystals depend on many parameters such as pH, concentration of reagents, temperature, the solubility and concentration of biomolecules. To achieve laborious and trial-and-error manner crystallization, many automation instruments are recently developed. Statistical values defined the quality of the diffraction data are shown as following. Rmerge is an internal error estimation of the data set. It comes from the difference between identical reflections that should have same intensity. In general, the value of Rmerge less than 50% are regarded as good data. I/(I) is the ratio of intensity to
of intensity. The sigma of reflection intensity represents an error of individual
measurements. The way to determine the sigma value depends on each program package.
If I/(I) is less than 2.0, a reflection is often rejected as being unreliable. The percentage
of completeness represents the number of measured unique reflections over the total unique reflections for judging whether the structure calculation is sufficient. R-factor (Rwork) is the most common indicator of the accuracy of the crystal structure. If structure
6
refinement is succeeded, the value will close to 20%. R-factor (Rfree) is calculated for 5.0% of the total reflections that were chosen randomly and omitted from refinement process. A high value of this Rfree indicate an inaccurate model, since this indicator is independent for the refinement, and provides the cross-validation of data interpretation.
【1-3 Small angle X-ray scattering】
Small angle X-ray scattering curve can be described as a spherically averaged molecular envelope. The scattered intensity I(q) is measured as a function q (q=4πsinθ/λ, where 2θ is the angle between the incident and scattered radiation).
I(q)= I0 exp(-q2Rg2/3) q = 4πsin(θ) / λ.
I0 : the primary beam intensity, Rg : the radius of the gyration of the protein.
The intensity of scattering from only the solvent is subtracted. The solution conformation of large full-length or complexes can be deduced from SAXS data. When domain structures are available from X-ray crystallography or NMR, fitting the domain structures to SAXS data provides a model which is useful for interpreting the domain assembling.
7
【1-4 Structural analysis of multi-domain proteins】
A domain of protein is distinct structural and functional unit. A domain forms a compact structure and has a role of a particular function. Multi-domain protein consists of several domains. The length of domains is from between 25 amino acids up to 200 amino acids.
As completely sequenced genomes became available, the distribution of domains of proteins in different genomes was analyzed using different approaches by several groups.
(Apic et al., 2001 ; Ekman et al, 2005 ; Gerstein, 1998 ; Liu et al., 2004 ; Teichmann et al., 1998). It is likely that more than 70% of eukaryotic proteins consist of multi domains, which play regulatory roles by using inter-domain interactions (Han et al., 2007). There is a probability that neighboring domains affect each other, thus, understandings of the domain orientation and its change caused by signal transduction are quite important to account for biological functions. Multi-domain protein is very flexible because domains connect like a rosary. Therefore, flexible linkers among the domains often hamper crystallization, and thus conventional straightforward approach is difficult to apply to the structure determination of multi-domain protein (Fig. 2). Although multi-domain proteins can be difficult to study, we need to overcome this problem to understand the important function as the full length proteins. Here, we are trying to determine the structure of multi- domain proteins using solution techniques such as NMR and SAXS, and domain selective
8
labeling (Fig. 2).
Fig. 2 Schematic drawing of motivation of the structure determination of multi- domain proteins.
There is no crystallization problem in NMR technique. Using long range distance information can be useful for structure determination. SAXS experiments give information of global structure. The combination approach both NMR and SAXS can be useful for structure determination of multi-domain proteins.
9
2. Structural studies of full-length Nrd1
10
2-1 Introduction
【2-1-1 Biological background】
Negative regulator of differentiation 1 (Nrd1), also known as multicopy suppressor of sporulation abnormal mutant 2 (Msa2), is a negative regulator of sexual differentiation in fission yeast. Nrd1 blocks the onset of sexual differentiation by repressing a series of Ste11-regulated genes essential for conjugation and meiosis. Sequence analysis suggested that Nrd1 consists of four RRM domains, and biochemical analysis showed that Nrd1 preferentially binds poly(U) sequences, although the cellular target mRNA is unknown (Tsukahara et al., 1998). One mammalian functional counterpart identified is regulator of differentiation 1 (ROD1), which suppresses lethality of the temperature-sensitive Pat1 (a protein kinase inhibits sexual differentiation by phosphorylating the meiotic inducer Mei2 and the transcription factor Ste11) mutant (pat1-114ts) (Iino et al., 1985 ; Li et al., 1996 ; Yamamoto et al., 1999). ROD1 is a protein with four RRM domains with its ability to repress Ste11-regulated genes and to inhibit conjugation upon overexpression. Recently, it has been revealed that Nrd1 is a regulator of cytokinesis. Physical separation of the cell is achieved by a contractile ring comprising many proteins including actin and myosin.
Among these, Cdc4 is known as an essential myosin II light chain in fission yeast and is required for cytokinesis (Guertin et al., 2002 ; Hou et al., 2002 ; McCollum et al., 1995).
11
Nrd1 has been identified as a multicopy suppressor of the temperature-sensitive cdc4+ mutant (Satoh et al., 2009). Nrd1 regulates cytokinesis by enhancing myosin mRNA stability through direct binding and stabilization of cdc4+ mRNA (Satoh et al., 2009).
Importantly, Pmk1, a MAPK in fission yeast (Toda, et al., 1996), phosphorylates Nrd1.
Thr40 in the N-terminal region and Thr126 in the first RRM domain of Nrd1 are known to be phosphorylated by Pmk1, and these Pmk1-dependent phosphorylations significantly reduce its RNA binding activity (Satoh et al., 2009)(Fig. 3). Pmk1 MAPK signaling thus regulates cytokinesis by posttranscriptional level regulation of cdc4+ mRNA (Satoh et al., 2009). The UCUU motif in the cdc4+-coding region of the mRNA is a candidate for the Nrd1 target RNA binding sequence, the mutation of which resulted in a significant reduction in Nrd1 binding affinity (Satoh et al., 2009).
【2-1-2 Aim of this study】
In an effort to delineate the relationship between Nrd1 structure and function, I took the combination approach that utilize NMR and SAXS (small angle X-ray scattering) and crystallographic study.
12
Fig. 3 Biological background.
(Top) Schematic drawing formation of stress granules.
(Bottom) The domain organization of Nrd1. Four RRMs and threonine residues (Thr40 and Thr126) phosphorylated by Pmk1 are indicated in the schematic cartoon of Nrd1.
13
2-2 Materials and methods
【2-2-1 Expression and purification of Nrd1】
RRM1, RRM2, RRM3, RRM4, RRM1-2, RRM2-3, RRM3-4, RRM1-2-3, RRM2-3-4, RRM1-2-3-4 and full length comprising Nrd1 residues 108–191, 188–284, 309–412, 397–501, 108-284, 188-412, 309-501, 108-412, 188-501 and 1-529 respectively, were each cloned into the plasmid pRSF-1b (Merck) and expressed in E. coli BL21 star (DE3) cells as fusion proteins containing GST and HRV3C cleavage sites at the N-terminus. To achieve stable isotope labeling of the protein E. coli was grown in LB or M9 medium or (in the case of 15N or 13C, 15N labeling samples) (Lemaster, 1994). At autoclave step, the phosphate buffer and divalent metal ions were prepared independently in each solution, because they tend to form toxic chelate complex when they are mixed at high temperature.
Separated two solutions were following; One is a Salt solution containing the phosphate buffer and the other is Vitamin solution with dissolved divalent metal ions. After autoclave, these two solutions were mixed, 20 mL of 100×trace element, 4 mL of 50 mM CaCl2, 3ml of 75% glycerol and 2 mL of 25 mg/ml Kanamycin. The salt solution contains 14.2 g of Na2HPO4, 6 g of KH2PO4, and 1 g NaCl were 1.5 l of water. The vitamin solution contains 40 mg of thiamine, adenosine, cytidine, thymine, guanosine, biotin, 2 mL 1M MgSO4 and 50 mM MnCl2 were added in 500 mL of water. In order to achieve uniform
14
15N labeling (and 13C labeling), the bacteria were grown at 37ºC in M9 minimal media with 15NH4Cl (and 13C-glucose) as sole source of nitrogen (and carbon). When the OD660
of the cell culture reached 0.5, IPTG was added to a concentration of 1mM to induce expression of the protein. Cell were grown at 20ºC for an additional 16 hours following IPTG induction. Harvested cells were washed 140 mM NaCl and stored at -80ºC. The cells were suspended in lysis buffer containing 50 mM Tris (pH 8.0), 400 mM KCl, 1 mM DTT, 0.1 mM EDTA and 10% glycerol. The suspension was sonicated on ice, and was cleared by centrifugation for 40 min at 35000 rpm. The supernatant was passed through DEAE Sepharose Fast Flow (GE Healthcare) anion exchange column which was equilibrated with lysis buffer. The solution passed DEAE loaded onto a Glutathione Sepharose Fast Flow (GE Healthcare) affinity column. Then, the fusion protein was eluted from glutathione column by addition of elution buffer containing 50 mM Tris (pH 8.0), 400 mM KCl, 1 mM DTT, 0.1 mM EDTA, 30 mM glutathione (GSH) and 10%
glycerol. After concentration by Amicon-Ultra 10,000 M.W. cutoff (Millipore), the fusion protein was cleaved with HRV3C overnight at 4ºC. The cleaved sample was purified by chromatography using Superdex 75 (26/60) with 30 mM HEPES (pH 7.5), 100 mM KCl, 5 mM DTT, 0.1 mM EDTA. The purified sample homogeneity was checked by SDS–PAGE and concentrated using Amicon-Ultra 3,000 M.W. cutoff.
15
【2-2-2 NMR spectroscopy and chemical shift assignments】
2-2-2-1 Nrd1 RRM2
The RRM2 samples employed for structural determination by NMR were dissolved in 50 mM K-phosphate (pH 6.0) buffer containing 100 mM KCl, 0.1 mM EDTA and 1 mM TCEP in either 93% H2O / 7% 2H2O or 99.8% 2H2O. The final protein concentrations were 0.35–0.9 mM. NMR spectra were acquired at 30ºC on a Bruker AVANCE III 600 NMR spectrometer equipped with a TCI cryogenic probe. Data were processed using NMRPipe (Delaglio et al., 1995), and NMR spectra were analyzed using Sparky (Goddard and Kneller, 1999). The 1H, 13C and 15N assignments were mainly obtained from standard multidimensional NMR methods, HNCACB, CBCA(CO)NH, HN(CA)CO and HNCO for mainchain assignments, and C(CO)NH, H(CCO)NH, HCCH-TOCSY and 4D HC(CO)NH for side-chain assignments (Sattler et al., 1998, Clowes et al., 1993).
Aromatic 1H and 13C assignments were obtained from 3D 13C edited NOESYHSQC.
Methyl groups of Leu and Val residues of RRM2 were assigned in a stereospecific manner using a 1H–13C constant-time HSQC spectrum of a 15% 13C randomly enriched protein sample (Neri et al., 1989). Stereospecific assignment of -methylene and 1 rotamer were determined from HNHB and HACAHB (Archer et al, 1991, Grzesiek et al., 1995). Inter- protondistances were derived from 3D 15N edited NOESY-HSQC, and 3D 13C edited
16
NOESY-HSQC. Backbone dihedral / and w angles were derived from TALOS+ (Shen et al., 2009). The program CYANA using the CANDID protocol was used for structural restraint collection (Herrmann et al., 2002). An ensemble of 100 structures were calculated using the program CNS version 1.2 by a standard simulated annealing protocol (Brunger et al., 1998). Finally, structures were refined using a water refinement protocol (Linge et al., 2003). The final 20 ensemble structures with the lowest energy were checked by PROCHECK- NMR (Laskowski et al., 1996) and MolProbity (Chen et al., 2010).
Molecular graphics were generated using PyMOL (DeLano 2002). The lowest energy structure among the ensemble was used as representative in order to compare structures and generate a ribbon model. The atomic coordinates have been deposited in the PDB with the accession code 2RT3.
17
2-2-2-2 Nrd1 RRM1-2
The RRM1-2 samples employed for structural determination by NMR were dissolved in 50 mM K-phosphate (pH 6.9) buffer containing 100 mM KCl, 0.1 mM EDTA and 1 mM
TCEP in either 93% H2O / 7% D2O or 99.8% D2O. The final protein concentrations were 0.2–1.0 mM. NMR spectra were acquired at 30ºC on a Bruker AVANCE III 600 NMR spectrometer equipped with a TCI cryogenic probe. Data were processed using NMRPipe (Delaglio et al., 1995), and NMR spectra were analyzed using Sparky (Goddard and Kneller, 1999). The 1H, 13C and 15N assignments were mainly obtained from standard multidimensional NMR methods, HNCACB, CBCA(CO)NH, HN(CA)CO and HNCO for main-chain assignments, and C(CO)NH, H(CCO)NH, HCCH-TOCSY and 4D HC(CO)NH for side-chain assignments (Sattler et al., 1998, Clowes et al., 1993).
Aromatic 1H and 13C assignments were obtained from 3D 13C edited NOESYHSQC.
Methyl groups of Leu and Val residues of RRM2 were assigned in a stereospecific manner using a 1H–13C constant-time HSQC spectrum of a 10% 13C randomly enriched protein sample (Neri et al., 1989). Stereospecific assignment of -methylene and 1 rotamer were determined from HNHB and HACAHB (Archer et al, 1991, Grzesiek et al., 1995). Inter- protondistances were derived from 3D 15N edited NOESY-HSQC, and 3D 13C edited NOESY-HSQC. Backbone dihedral / and w angles were derived from TALOS+ (Shen et
18
al., 2009). The program CYANA using the CANDID protocol was used for structural restraint collection (Herrmann et al., 2002). An ensemble of 100 structures were calculated using the program CNS version 1.2 by a standard simulated annealing protocol (Brunger et al., 1998). Finally, structures were refined using a water refinement protocol (Linge et al., 2003). Chemical shifts were deposited in BioMagResBank (http;//www.bmrb.wisc.edu/) under accession number 26912.
【2-3 RNA binding analysis】
Chemical shift perturbations of 1H and 15N amide resonances of 15N uniformly labeled RRM1, RRM2 and RRM4 were monitored upon addition of an excess amount of RNA.
The NMR sample contained 0.1 mM of each protein in K-phosphate (pH 6.0) buffer containing 100 mM KCl, 1 mM TCEP, 0.1 mM EDTA and 7% 2H2O. The 1H–15N HSQC experiments were performed at 30ºC. For each cross-peak, the weighted average shift difference ave was calculated. The dave ave was calculated as {[(1H)2 + (15N)2/25]}1/2,
where 1H and 15N represent the difference in ppm between the free and perturbed chemical shifts. Chemical shift changes were analyzed using Sparky (Goddard et al., 1999).
19
【2-2-4 SAXS experiments】
To reveal the total structure of Nrd1, SAXS analyses were performed. SAXS is suitable for a biophysical method to study the overall shape in solution, even though the analyte has dynamic properties. However, it provides low resolution information, thus, combination approach such as high resolution information derived from NMR effective to understand the structure.
The SAXS measurements were recorded on BL-10C beamline at Photon Factory (Tsukuba, Japan). 50 L of Nrd1 solutions (at four different RRM1-2 concentrations of
1.17, 2.34, 4.68, 7.02, 9.36 and 11.7 mg/mL ; RRM3-4 concentrations of 1.03, 2.06, 4.12, 6.18, 8.24 and 10.3 mg/mL ; RRM1-2-3-4 concentrations of 0.59, 1.18, 2.36, 3.54, 4.72 and 5.9 mg/mL) were loaded in a flow-through quartz capillary cell at 20°C. The sample volume exposed to the X-ray beam was about 40 L while flowing 5.95 L/min to avoid
damage. Solvent contributions (buffer backgrounds collected before and after every protein sample) were averaged and subtracted from the associated protein sample using the software SAngler (Shimizu et al., 2016).
20
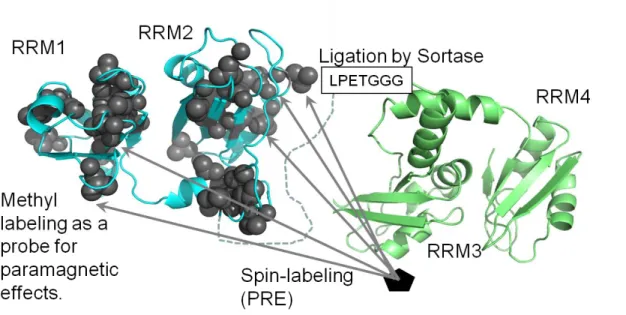
【2-2-5 Reconstruction of Nrd1 using sortase】
To determination of the full length structure of Nrd1 by using PRE, I performed protein ligation between Nrd1 RRM1-2 and RRM3-4 to obtain partially labeled almost full length protein (Fig. 4, 5). Protein ligation using sortase A requires the presence of a LPXTG motif at the end of the N-terminal chain and tri-glycine residues at the N-teminus of the C-taminal chain. Protein ligation were performed by using Sortase A and its mutant for improved catalytic activity (Chen et al., 2011). Protein ligation was carried out at room temperature in 50 mM Tris-HCl (pH 8.0), 150 mM KCl, 10 mM CaCl2, 1 mM DTT, 10%
glycerol dialyzed with same buffer.
21
Fig. 4 Schematic carton of the full-length structure determination
Using paramagnetic relaxation enhancement (PRE) of domain specific labeled samples of Nrd1 to obtain structural information in Nrd1 full length.
Fig. 5 Domain ligation between RRM1-2 and RRM3-4 using Sortase.
Protein ligation using sortase A requires the presence of a LPXTG motif at the end of the N-terminal chain and tri-glycine residues at the N-teminus of the C-taminal chain.
Protein ligation were performed by using an Sortase A
22
【2-2-6 Expression and purification of GST-Pek1DD/GST-pPmk1】
Pek1 S234D T238D and Pmk1 cloned into the plasmid pRSF-1b (Merck) and pGEX-6P- 3 (GE Healthcare), respectively. They coexpressed in E. coli Rosseta2 (DE3) cells as fusion proteins containing GST and HRV3C cleavage sites at the N-terminus. To achieve stable isotope labeling of the protein, E. coli was grown in LB. The bacteria were grown at 37ºC in LB. When the OD660 of the cell culture reached 0.5, IPTG was added to a concentration of 1mM to induce expression of the protein. Cell were grown at 20ºC for an additional 16 hours following IPTG induction. Harvested cells were washed 140 mM NaCl and stored at -80ºC. The cells were suspended in lysis buffer containing 50 mM Tris (pH 8.0), 400 mM KCl, 1 mM DTT, 2 mM EDTA, 7.5 mM MgSO4, 1 mM - glycerophosphate, 1 mM NaVO3, 50 M ATP, 1% Triton and 10% glycerol. The suspension was sonicated on ice, and was cleared by centrifugation for 40 min at 35000 rpm. The supernatant was passed through DEAE Sepharose Fast Flow (GE Healthcare) anion exchange column which was equilibrated with lysis buffer. The solution passed DEAE loaded onto a Glutathione Sepharose Fast Flow (GE Healthcare) affinity column.
Then, the fusion protein was eluted from glutathione column by addition of elution buffer containing 50 mM Tris (pH 8.0), 400 mM KCl, 1 mM DTT, 2 mM EDTA, 7.5 mM MgSO4, 1 mM -glycerophosphate, 1 mM NaVO3, 50 M ATP, 1% Triton 30 mM glutathione
23
(GSH) and 10% glycerol. After concentration by Amicon-Ultra 30,000 M.W. cutoff (Millipore), the sample was purified by chromatography using Superdex 200 (26/60) (GE Healthcare) with gel filtration buffer containing 30 mM HEPES (pH 7.5), 1 mM TCEP.
The purified sample homogeneity was checked by SDS–PAGE and concentrated using Amicon-Ultra 30,000 M.W. cutoff.
2-3 Results
【2-3-1 Preparation and characterization of each RRM domain】
I constructed E. coli expression systems for RRM1 (108–191), RRM2 (188–284), RRM3 (309–412) and RRM4 (397–501), and purified the proteins. I measured 1H–15N HSQC spectra for the RRM1–RRM4 proteins, and provided well dispersed signals of RRM1, RRM2 and RRM4. Purification of the RRM3 protein was problematic. The RRM3 protein eluted in the void volume during gel-filtration, indicating the presence of protein aggregates. The buffer using measurement include high level salt (400 mM KCl) because RRM3 in low level salt (100 mM KCl) buffer is aggregated. Therefore, we could not measure RNA binding analysis. The results of SDS-PAGE in the purification are shown below (Fig. 6-13).
24
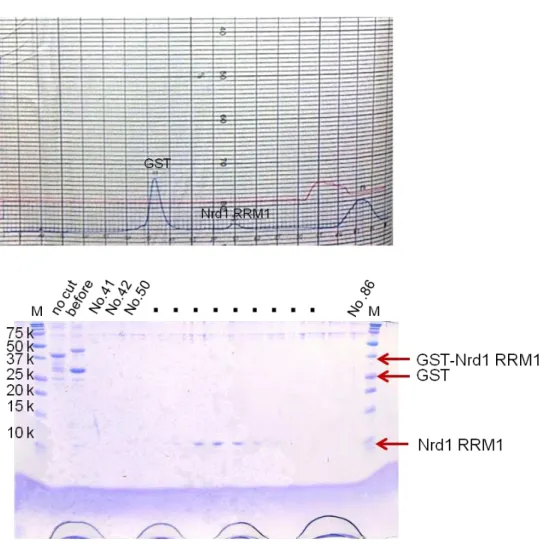
Nrd1 RRM1 (108-191)
Fig. 6 The 17.5% SDS-PAGE gel of Nrd1 RRM1 at Superdex 75 (26/60) gel filtration column after cleaving GST tag by HRV3C.
After concentration by Amicon-Ultra 10,000 M.W. cutoff (Millipore), the fusion protein was cleaved with HRV3C overnight at 4ºC. The cleaved sample was purified by chromatography using Superdex 75 (26/60) (GE Healthcare) with gel filtration buffer containing 30 mM HEPES (pH 7.5), 100 mM KCl, 5 mM DTT, 0.1 mM EDTA.
25
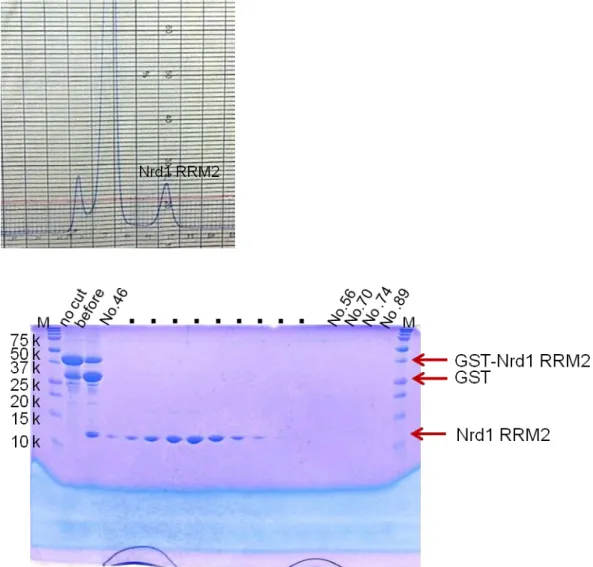
Nrd1 RRM2 (188-284)
Fig. 7 The 17.5% SDS-PAGE gel of Nrd1 RRM2 at Superdex 75 (26/60) gel filtration column after cleaving GST tag by HRV3C.
After concentration by Amicon-Ultra 10,000 M.W. cutoff (Millipore), the fusion protein was cleaved with HRV3C overnight at 4ºC. The cleaved sample was purified by chromatography using Superdex 75 (26/60) (GE Healthcare) with gel filtration buffer containing 30 mM HEPES (pH 7.5), 100 mM KCl, 5 mM DTT, 0.1 mM EDTA.
26
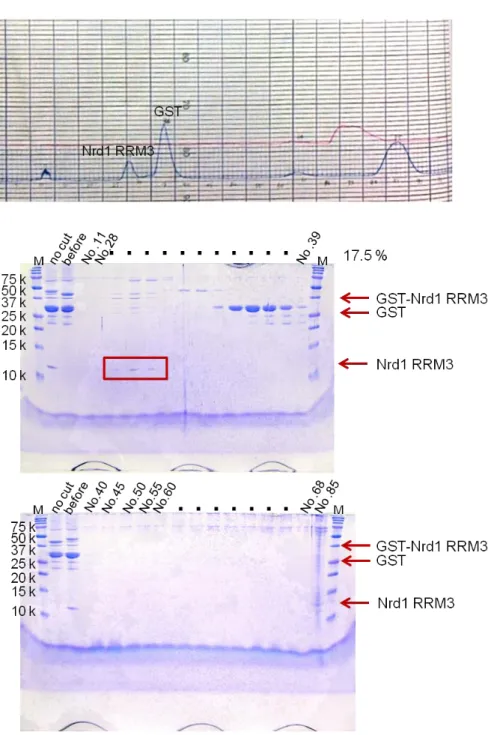
Nrd1 RRM3 (309-412)
Fig. 8 The 17.5% SDS-PAGE gel of Nrd1 RRM3 at Superdex 75 (26/60) gel filtration column after cleaving GST tag by HRV3C.
After concentration by Amicon-Ultra 10,000 M.W. cutoff (Millipore), the fusion protein was cleaved with HRV3C overnight at 4ºC. The cleaved sample was purified by chromatography using Superdex 75 (26/60) (GE Healthcare) with gel filtration buffer containing 30 mM HEPES (pH 7.5), 100 mM KCl, 5 mM DTT, 0.1 mM EDTA.
27
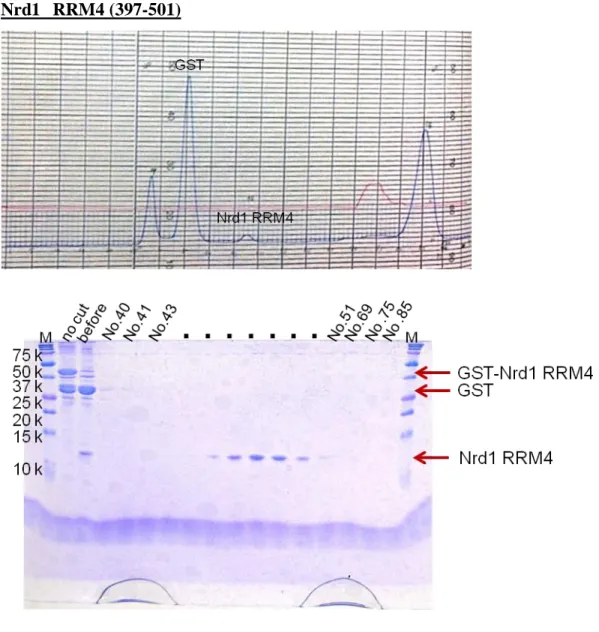
Nrd1 RRM4 (397-501)
Fig. 9 The 17.5% SDS-PAGE gel of Nrd1 RRM4 at Superdex 75 (26/60) gel filtration column after cleaving GST tag by HRV3C.
After concentration by Amicon-Ultra 10,000 M.W. cutoff (Millipore), the fusion protein was cleaved with HRV3C overnight at 4ºC. The cleaved sample was purified by chromatography using Superdex 75 (26/60) (GE Healthcare) with gel filtration buffer containing 30 mM HEPES (pH 7.5), 100 mM KCl, 5 mM DTT, 0.1 mM EDTA.
28
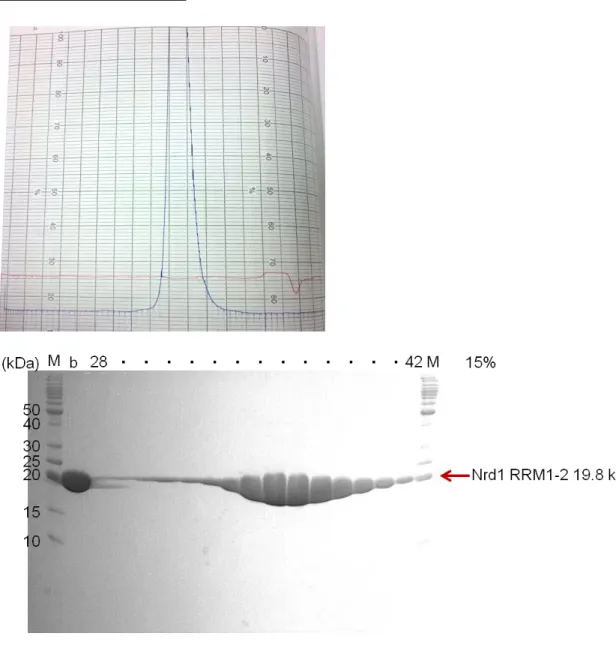
Nrd1 RRM1-2 (108-284)
Fig. 10 The 15% SDS-PAGE gel of Nrd1 RRM1-2 at Superdex 75 (16/60) gel filtration column.
The sample of Nrd1 RRM1-2 using SAXS was purified by chromatography using Superdex 75 (26/60) (GE Healthcare) with gel filtration buffer containing 30 mM HEPES (pH 7.5), 100 mM KCl, 1 mM TCEP, 0.1 mM EDTA, 5% glycerol.
29
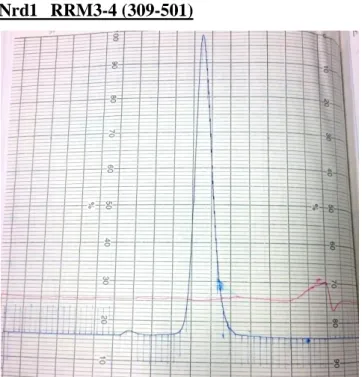
Nrd1 RRM3-4 (309-501)
Fig. 11 The 15% SDS-PAGE gel of Nrd1 RRM3-4 at Superdex 75 (16/60) gel filtration column.
The sample of Nrd1 RRM3-4 using SAXS was purified by chromatography using Superdex 75 (26/60) (GE Healthcare) with gel filtration buffer containing 30 mM HEPES (pH 7.5), 100 mM KCl, 1 mM TCEP, 0.1 mM EDTA, 5% glycerol.
30
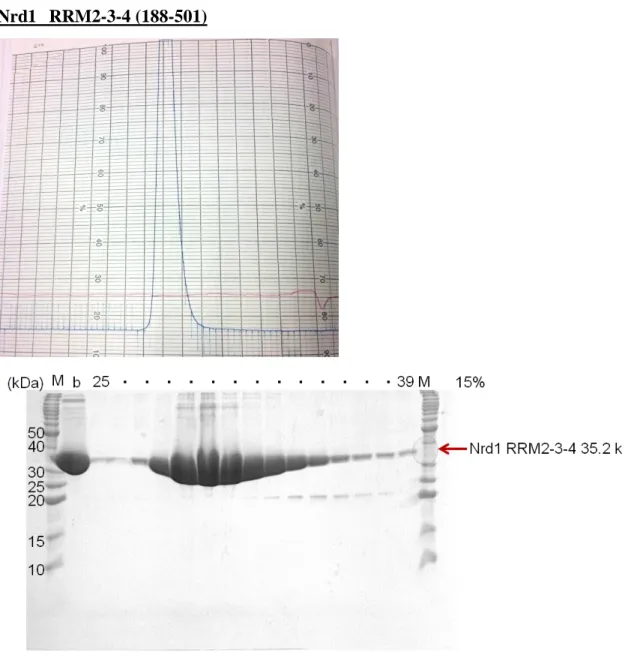
Nrd1 RRM2-3-4 (188-501)
Fig. 12 The 15% SDS-PAGE gel of Nrd1 RRM2-3-4 at Superdex 75 (16/60) gel filtration column.
The sample of Nrd1 RRM2-3-4 using SAXS was purified by chromatography using Superdex 75 (26/60) (GE Healthcare) with gel filtration buffer containing 30 mM HEPES (pH 7.5), 100 mM KCl, 1 mM TCEP, 0.1 mM EDTA, 5% glycerol.
31
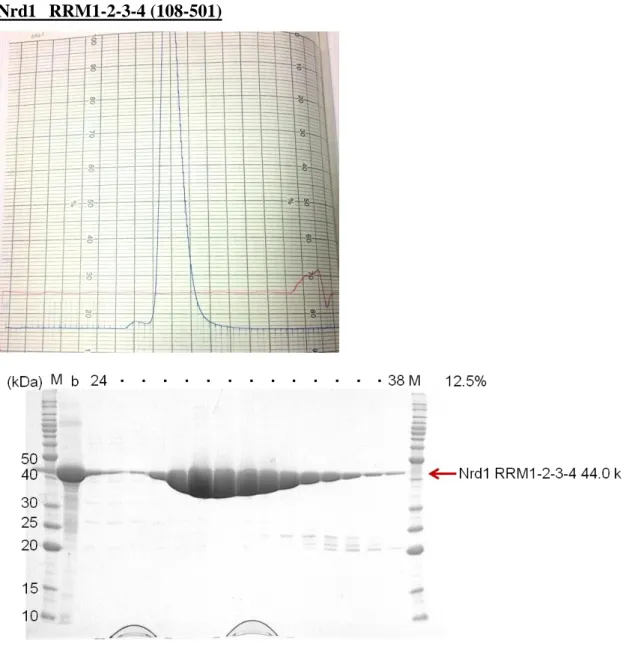
Nrd1 RRM1-2-3-4 (108-501)
Fig. 13 The 12.5% SDS-PAGE gel of Nrd1 RRM1-2-3-4 at Superdex 200 (16/60) gel filtration column.
The sample of Nrd1 RRM1-2 using SAXS was purified by chromatography using Superdex 75 (26/60) (GE Healthcare) with gel filtration buffer containing 30 mM HEPES (pH 7.5), 100 mM KCl, 1 mM TCEP, 0.1 mM EDTA, 5% glycerol.
32
【2-3-2 RNA binding analysis】
I examined the RNA binding character and RNA binding site of RRM1, RRM2 and RRM4 by chemical shift perturbation (CSP) experiments. Since the interactions were weak, an excess amount of chemically synthesized non-labeled RNA (5-mer; UUCUU) was added to the 15N-labeled proteins (the molar ratio of the each protein to RNA was 1:4) in the CSP experiments. As a result, changes in the chemical shift of a number of peaks of RRM2 were observed, while signals of RRM1 and RRM4 were not significantly perturbed (Fig. 14). This suggests that RRM2 may play an important role in the interaction between Nrd1 and target mRNA, although the possibility that RRM3 possesses RNA binding activity cannot yet be excluded. The RRM2 domain was then subjected to structural analysis and mapping of the RNA binding site (Fig. 15). The RNA binding site of RRM2 distributed to four -sheets.
33
Fig. 14 The 1H-15N HSQC spectra of RRM1, RRM2, and RRM3-4.
1H-15N HSQC spectra of the 15N-labeled RRM1, RRM2, RRM4 and RRM3-4 domains shown on the left, middle and right, respectively. The spectra of RNA-free and 4-fold excess non-labeled UUCUU are shown in black and red, respectively.
34
Fig. 15 RNA binding site of Nrd1 RRM2 domain.
(Top) Weighted average of 1H and 15N chemical shift perturbations of residues in RRM2 induced by Cdc4 mRNA (UUCUU) binding. The dashed line indicates the threshold for mapping.
(Middle, Bottom) Significantly perturbed residues are mapped on the ribbon drawing (Middle) and on the molecular surface model (Bottom) of the RRM2 structure. Residues significantly perturbed are highlighted in red and labeled. C-terminal 7 residues are omitted for clarity.
35
【2-3-3 Interaction among RRMs】
By comparison of NMR spectra of RRM1 and RRM1-2 tandem region indicated that RRM1 and RRM2 interact with each other (Fig. 16). Similarly, it was indicated that RRM3 interacts with RRM4 (Fig. 16). I also tried to prepare RRM2-3-4 and RRM1-2-3- 4, and succeeded in purification of them (Fig. 12, 13). NMR spectra of RRM2-3-4 and RRM1-2-3-4 implied that RRM1-2 has no interaction with RRM3-4 (Fig. 16). I tried to prepare RRM2-3 and RRM1-2-3, but they caused aggregation. This result suggest that RRM3 is unstable when RRM4 does not exist. RRM4 may contributes to stability of RRM3. Similarly, RRM1 alone was found to be not stable well. These data suggested that structure of Nrd1 can be divided into two parts. one is RRM1-2 and the other is RRM3- 4.
36
Fig. 16 The 1H-15N HSQC spectra of RRMs.
(Top) Overlay views of RRM1-RRM2 (black), RRM1 (red) and RRM2 (green).
(Middle) Overlay views of RRM3-RRM4 (black), RRM3 (magenta) and RRM4 (blue).
(Bottom) Overlay views of RRM1-2-3-4 (black), RRM1-2 (yellow) and RRM3-4 (blue).
37
【2-3-4 Structure determination of Nrd1 RRM2】
Purified RRM2 domain exhibited well dispersed signals with relatively narrow line shape in the 1H–15N HSQC spectrum as shown (Fig. 14), and the elution volume in the gel- filtration corresponded to a molecular weight of the monomer. These results indicated
that RRM2 exists as a monomer in solution. Almost all 1H, 13C, and 15N NMR signals were assigned using standard multi-dimensional NMR techniques.
The number of distance restraints derived from NOE was sufficient (more than two thousand), and the ensemble of 20 structures were in excellent agreement with a large body of experimental data (Fig. 17, Table 1). The r.m.s. deviations of the backbone and all heavy atoms of RRM2 are 0.18 and 0.53 Å, respectively, excluding disordered regions.
In particular, the conformation of the N-terminal (residues 188–203) and C-terminal (275–284) regions of RRM2 are not converged. RRM2 comprises an anti-parallel -sheet and four -helices. The -sheet is composed of four -strands, 1 (residues 207–211), 2 (233–238), 3 (242–248) and 4 (272–274). The short a-helix, 1 (196–200), is located distal to the core region of the protein while the other three a-helices, 2 (219–229), 3 (251–263) and 4 (266–269), pack against the -sheet (Fig. 17). Although the first short helix a1 is shown close to the core region of the RRM2 domain in the ribbon model, this part is not converged in the ensemble and is highly mobile in the solution state as indicated
38
by the 1H–15N heteronuclear NOE experiment (Fig. 17).
Fig. 17 Solution structure of Nrd1 RRM2 domain.
(Left) Backbone superposition of the final 20 simulated annealing structures of RRM2.
(Right) Ribbon drawing of a representative structure of the RRM2 domain.
39
Table 1 NMR Structure Determination Statistics for Nrd1 RRM2
SA SAwater refined
Total number of distance constraints 2087
intra residue 464
short range (|i-j| = 1) 540
middle range (|i-j| = 2,3,4) 434
long range (|i-j| > 4) 605
hydrogen bond constraints 44
Dihedral constraints
φ, ψ, χ1 55, 59, 22
R.m.s. deviations from experimental constraintsc
Distance (Å) 0.024 ±3×10⁻⁴ 0.0318±9×10⁻⁴
Angle (°) 0.344±0.01 0.834±0.05
R.m.s. deviations from idealized covalent geometry
Bonds (Å) 0.00135±1×10⁻⁵ 0.00440±1×10⁻⁴
Angles (°) 0.284±0.001 0.530±0.02
Impropers (°) 0.166±0.002 1.33±0.06
PROCHECK Ramachandran plotd
Residues in most favoured regions (%) 92.0 93.1 Residues in additional allowed regions (%) 5.7 4.0 Residues in generously allowed regions (%) 2.2 2.9
Residues in disallowed regions (%) 0.0 0.0
Average atomic r.m.s. deviations from the average structured
Back bone (Å) 0.08 0.48
All heavy (Å) 0.18 0.53
aThese statistics comprise the lowest energy ensemble of the 20 structures obtained from 100 starting structures. Structure calculations were performed using CNS version 1.2.
bThe numbers of intermolecular NOE is shown in parentheses.
cNone of these structures exhibited distance violations > 0.5 Å, dihedral angle violations > 5°
dEvaluated for the RRM2 domain residues 204-274
40
【2-3-5 Structure determination of Nrd1RRM1-2】
2-3-5-1 Structure of Nrd1 RRM1-2 derived NOEs
The 2D 1H–15N HSQC spectrum for the 13C- and 15N-labeled RRM1–RRM2 of Nrd1 is shown in Fig. 18, and 77% of the 1HN and 15N resonances of backbone amide groups was assigned (Kobayashi et al., in press). For non-labile CHn moieties, 70% and 78% of 1H and 13C resonances were assigned, respectively. The conformational exchange of the linker region possibly reduced the 1HN signals in the vicinity. Judging from the backbone dihedral angles obtained using the TALOS+ program (Shen et al., 2009) and NOEs obtained from NOESY experiments, we identified six -helices and nine -strands.
According to the topology of the secondary structure, RRM1 presumably adopted a typical RRM fold. Notably, the 1HN, 15N resonances of backbone amides of the RRM2 region of RRM1–RRM2 were significantly different from those of RRM2, although the secondary structural elements were well conserved (Kobayashi et al., 2013). The methyl resonances in 17/28 isopropyl groups of Leu and Val residues and 22/129 -methylene groups were assigned in a stereospecific manner. NOE derived structure of Nrd1 RRM1- 2 is shown in Fig. 19.
41
Fig. 18 1H-15N HSQC spectrum of RRM1-2 with assignments.
Spectrum of 13C/15N uniformly labeled Nrd1 RRM1-2 in 93 % H2O/7 % D2O in K- phosphate buffer (pH 6.9), 100 mM KCl, 1 mM TCEP and 0.1 mM EDTA at 303 K. The spectrum was recorded at 600 MHz at 1H frequency. Backbone assignments are annotated using one-letter amino acid codes and the sequence number.
Fig. 19 NOE derived structure of Nrd1 RRM1-2.
RRM1 fitted, but RRM2 is not converged. This caused by lacking of enough NOE.
42
2-3-5-2 RDC
RDC provides orientation information of the magnetic dipole-dipole interaction vector in a common reference frame. The measurement of RDC requires an anisotropic orientation via direct or indirect magnetic field orientation of the protein in solution. (Chen, et al., 2012). 1H-15N residual dipolar couplings were measured using a DSSE experiment (Cordier, et al., 1999). Alignment media consist of 12 mg/ml Pf1 phage. I successfully obtained RDC values to analyze the orientation of RRM1-2 (Fig. 20)
Fig. 20 DSSE spectra of Nrd1 RRM1-2.
Aligned sample was made by using 12 mg/ml Pf1 phage.
43
2-3-5-3 PCS
I tried to obtain long-range distance information of Nrd1 RRM1-2. I used the chelater DOTA-M8, developed by professor grezesiek group to obtain PCS data (Häussinger, e al., 2009). This chelater has 8 methylene groups in addition to DOTA backbone. Thus rigid and bulky. So single point attachment causes enough PCS. Informative PCS data were successfully obtained monitoring methyl groups (Fig. 21).
Fig. 21 Pseudo contact shifts obtained by using DOTA-M8.
PCS observed in tandem RRM1-2 (monitoring methyl group). The spectra of RRM1-2- DOTA-M8-Lu (diamagnetic) in black and Dy (paramagnetic) in cyan, respectively.
44
【2-3-6 SAXS experiments】
A series of SAXS data and pseudo atomic model derived from SAXS data by GASBOR (Svergun, et al., 2001) indicated that RRM1-2 and RRM3-4 form compact structure and RRM1-2-3-4 adopts elongated shape consistent with NMR data (Fig. 22, 23). NMR relaxation parameters also consistent that RRM1-2 adopts well packed structure (Fig. 23, 24). The pseudo-atomic model, RRM3 part in RRM1-2-3-4 is exposed to solvent, which is suitable for the RNA binding.
45
Fig. 22 SAXS experimental data of Nrd1.
Log Plots, Guinier Plots, Kratky plots and pseudo atomic models of Nrd1 RRM1-2 (Top), RRM3-4 (Middle) and RRM1-2-3-4 (Bottom) derived from SAXS data.
46
Fig. 23 Pseudo atomic model of Nrd1 derived from SAXS.
Pseudo atomic models of Nrd1 RRM1-2 (Top), RRM3-4 (Middle) and RRM1-2-3-4 (Bottom) derived from SAXS data. The models were generated by GASBOR based on the SAXS data.
47
Fig. 24 T1/T2 of 15N Nrd1 RRM1-2.
The rotational correlation time (τc) of Nrd1 RRM1-2 was estimated from 15N relaxation to be 12.5 ns; this value is consistent with a 20 kDa protein.
48
【2-3-7 Reconstruction of Nrd1 using sortase】
Nrd1 RRM1-2 and RRM3-4 were ligated using soratse A. The yield was approximately 30% (Fig. 25).
Fig. 25 SDS-PAGE of sortase-mediated protein ligation of Nrd1.
Protein ligation was carried out at room temperature in 50 mM Tris-HCl (pH 8.0), 150 mM KCl, 10 mM CaCl2, 1 mM DTT, 10% glycerol dialyzed with same buffer.
49
【2-3-8 Phosphorylation of Nrd1】
To investigate the influence on the Nrd1 structure by the phosphorylation, I prepared RRM1-2 mutants (T126E and T126D). It is changed for negative charge of a glutamic acid or aspartic acid instead of phosphrylation. Comparing the spectrum of RRM1-2 T126E with RRM1-2 wild type or RRM1 wild type, it is different for chemical shifts (Fig.
26). Interestingly, the spectra of phospho-mimic mutant were close to only that of RRM2 wild type (Fig. 26). These experiments implied that the phosphorylation destroys the fold of RRM1. I also measured the spectrum of only RRM1 region mutated T126E. As a result,
NMR spectrum did not exhibit dispersed signals (Fig. 26). Nrd1 mutant mimicked phosphorylation found that interaction between RRM1 and RRM2 are lost in the cause of unfolding of RRM1 induced by phosphorylation of T126 residue.
50
Fig. 26 The 1H-15N HSQC spectra of phospho-mimic mutants.
(Top) Overlay views of Nrd1 RRM1-2 T126E (black) and RRM1-2 WT (masenta), RRM1 WT (red).
(Middle ; Left) Overlay view of Nrd1 RRM1-2 T126E (black) and RRM2 (green).
(Middle ; Right) Overlay view of Nrd1 RRM1-2 T126D (black) and RRM2 (green).
(Bottom) The spectrum of Nrd1 RRM1 T126E.
51
Fig. 27 The 1H-15N HSQC spectra of 15N Nrd1 RRM1-2 and unlabeled Pek1DD/pPmk1.
(A) The 1H-15N HSQC spectra of 15N Nrd1 RRM1-2
(B) The 1H-15N HSQC spectra of 15N Nrd1 RRM1-2 and unlabeled Pek1DD/pPmk1 on the morrow of addition to Pek1DD/pPmk1
(C) The 1H-15N HSQC spectra of 15N Nrd1 RRM1-2 and unlabeled Pek1DD/pPmk1 at 1 h after addition to Pek1DD/pPmk1
(D) The 1H-15N HSQC spectra of 15N Nrd1 RRM1-2 and unlabeled Pek1DD/pPmk1 at 2 h after addition to Pek1DD/pPmk1
(E) The 1H-15N HSQC spectra of 15N Nrd1 RRM1-2 and unlabeled Pek1DD/pPmk1 at 3 h after addition to Pek1DD/pPmk1
(F) The 1H-15N HSQC spectra of 15N Nrd1 RRM1-2 and unlabeled Pek1DD/pPmk1 at 4 h after addition to Pek1DD/pPmk1
52
2-4 Discussion
【2-4-1 Features of Nrd1 RRM2】
NMR structural study of Nrd1 RRM2 revealed that the N-terminal region (188–203) of RRM2 behaves independently relative to the core region of RRM2. It probably acts as a hinge around Gly203. Therefore, the relative orientation between RRM1 and RRM2 is probably mobile given this hinge. One possible mechanism of regulation of Nrd1 by Pmk1 involves phosphorylation-induced rearrangement of domain orientation around the hinge and subsequent adoption of an auto-inhibitory form. RRM1 or some other region of Nrd1 may mask the RNA binding site of Nrd1 by inter-domain interactions induced by phosphorylation. Prediction of disordered regions using the program PrDos suggested that Nrd1 possesses some flexible regions in addition to the N- and C-terminal regions (Fig. 28). In particular, flexible region 1 (residues 190–199 located between RRM1 and RRM2), which almost corresponds to the experimentally identified hinge region, flexible region 2 (residues 288–311 located between RRM2 and RRM3), and flexible region 3 (residues 404–410 located between RRM3 and RRM4) showed high scores (Fig. 28).
Interestingly, RRM1, RRM2 and RRM4 showed low scores, consistent with the fact that the NMR spectra of RRM1, RRM2 and RRM4 comprised well dispersed signals, indicating the presence of folded structures. Together with information concerning the