平成29年度博士学位論文
Detection of facial feature points in three-dimensional space for meal support equipment
Bo Peng
群馬大学大学院 理工学府
理工学専攻 知能機械創製理工学領域
Contents
Chapter 1Introduction ... 1
1.1 The background of this research ... 1
1.2 Existing products ... 1
1.3 Face detection ... 2
1.4 Manipulator system ... 3
1.5 Summary ... 3
Chapter 2Construction of three-dimensional measurement system ... 5
2.1 The construction of the system ... 5
2.2 Basic formula for three-dimensional measurement by stereo camera ... 8
2.3 Camera characteristics ... 14
Lens distortion ... 14
Camera and system parameters ... 14
2.4 Verification experiment ... 18
Experimental method ... 18
Experimental results ... 20
Chapter 3Feature point detection ... 26
3.1 Basics of image processing ... 26
Binarization processing - Labeling processing ... 26
Features of connected components ... 27
3.2 Basic policy of facial feature point search ... 30
3.3 RGB values of input image ... 32
3.4 Face detection algorithm ... 46
3.5 Verification experiment ... 52
Comparative experiment between our system and OpenCV... 52
Comparative experiment between our system and other camera equipment ... 55
Setting the evaluation function ... 56
3.6 Nostril detection algorithm ... 58
Removal of unnecessary connected components ... 58
Filtering nostril candidates ... 59
3.7 The relationship between mouth and nostril ... 61
3.8 The detection of mouth ... 64
3.9 Verification experiment ... 68
Chapter 4Application to Manipulator Control ... 78
4.1 Manipulator control ... 78
Kinematics and inverse kinematics of manipulators ... 78
RC servo motor angular control command ... 81
4.2 Verification experiment ... 86
Experiment method ... 86
Experimental results ... 86
Chapter 5Conclusion ... 95
1
Chapter 1 Introduction
1.1 The background of this research
Currently, the number of elderly people and persons with disabilities in Japan is rapidly increasing and it becomes a big social problem. According to the 2011 edition "White Paper on Disabled Persons", the statistical result release that number of people with disabilities are 3.663 million (29 people per thousand people)[1]. On the other hand, the elderly population aged 65 and older is estimated at 29.01 million according to the survey in 2010, accounting for 22.7% of the total population [2]. In 2005, the population of the elderly was 24.88 million, 19.5% of the total population. We can understand that the elderly population was increased in a surprising rate. And it is expected that in the future as the year of 2020, the population of the elderly people will become 35.89 million. In the progress of the declining birthrate and the aging of the population, the condition of shortage of nurse/carer is getting worse, and the way to solve this situation becomes an important research issue in the future.Meanwhile, the meal, which is one of the enjoyments of the care recipient, largely depends on the care giver. Among them, there is a strong demand to eat the meals as expected, such as the pace and the order of eating, and in many nursing care facilities, a small number of carers are doing many meal support.
Against this backdrop, development of a meal support manipulator has been carried out, the research of combination of industrial miniature robot and voice recognition [3], using pneumatic actuator [4] has been advanced.
1.2 Existing products
Some products have already been put into practical use, and SECOM Corp. sells "My spoon"[5]. In "My spoon", they prepared a manual mode for meticulous operation by using a joystick, and automatic mode for selecting a tray by pressing a button at the right time. These meal support devices have been developed in pursuing convenience, and they are very excellent in side of functionality. However, since the joystick or the button is operated by the jaw, mouth, etc. the operability of the apparatus tends to be greatly
2
influenced by the proficiency of the user. Also, the main role is to carry food to the mouth and finally the action of putting food into the oral cavity is not a device, but the user needs to move their face by themselves, so it is necessary to develop a system which can carry food into mouth by the device entirely. And the device “Obi” which is made by Desin Corp is developed [6], and this device can catch food to the mouth by easy control, so the operability is convenient, the system set the position where the spoon reach every time, to make the patient comfortable, but the position setting should be done every time, if the position of the patient is changed even a little, this system can’t reach the right position, and device should be set again, so it is better for the patient if the position of mouth is able to be detected automatically. And the Handy1 made by Rehab Robotics also can’t detect the right positions [7] [8] [9]. The iARM which is made by Exact Dynamics get a good manipulator to carry food [10], but it also need a joystick to control the system, so it is hard for the patient especially hands disability, so the convenient of the control is also important.
1.3 Face detection
In recent years, the automatic face detection technology [11] has been developed and it has been used on home optoelectronics device, such as digital video recorder, camera, or smartphone, as a matter of course. Such recognition technique has been remarkably developed since the Viola-Jones method [12] [13] [14] [15] [16] [17] and derivative method [18] [19] had been proposed. This method can find a human face from the obtained image very easily. However, it had been constructed on the assumption that a front-facing is roughly kept. Therefore, the side face and large target cannot be recognized, and this method to detect human face is using Haar-like method [20] [21] [22], this method can also detect the human face correctly, but this system has to study about the human face feature point, so the computational complexity is very huge, in this case, it leads to the result that this method needs to study for times and hard to detect the face in real time [23] [24] [25] [26], And many other methods of face detection also have the same problem [27] [28] [29] [30].To solve this problem, the author has proposed a new method of face detection, based on facial feature color [31]. As a same approach,
3
improvements in Viola Jones algorithm using both skin [32] [33] [34] [35] [36] [37] and eyes colors has been proposed to detect the tilted face detections [38]. Here, we used only rough skin color information to detect the nostril position. The proposed system could narrow down the candidate of the nostril by checking the color, area, and aspect ratio, the detection of nostril is proved to be stable of the human face, and according to the relative position of mouth and nostril, we narrowed down the area of mouth detection, and the accuracy rate of the mouth detection has been risen up, this mouth detection method is better than the other methods which just scan the mouth without the other areas of human [39] [40] [41] [42]. After the detection of mouth, we purpose to detect the condition of mouth by setting a threshold, according to this threshold, we can judge that whether the mouth is opened or closed, if the mouth is closed, system will not display, and manipulator will not do any movement, if the mouth is opened, the system will mark the position of mouth in real time.
1.4 Manipulator system
In our system, we developed a 3-link manipulator with 3 RC servomotors [43], and the control board (KONDO RCB 4 - HV: M16C / 26 A manufactured by Renesas Technology Corporation) [44], and by calculation every angle of joints, we can sent the spoon which is carrying food to the right position [45] [46] [47] [48], and when the system detected that the mouth is closed, the manipulator will be back to the inceptive position of the system.
1.5 Summary
Therefore, in this study, we developed a three-dimensional position measurement system of facial feature points [49] by stereo camera as a basis for constructing a meal support system that can move a spoon to the oral cavity by accurate position detection.
By processing the input image obtained by the stereo camera, and detecting the face automatically, we constructed a system that detects the nostrils as facial feature points and accurately measures the mouth position in the three-dimensional space, and its effectiveness had been revealed.
4
The structure of this paper is shown below.
Chapter 2: The summary of this system and the description of three-dimensional measurement by stereo camera.
Chapter 3: The description of the Algorithms automatic detection of the nostrils and the mouth.
Chapter 4: The description of the control of manipulator by using three dimensional measurement systems.
Chapter 5: The summary of this paper.
5
Chapter 2 Construction of three-dimensional measurement system
2.1 The construction of the system
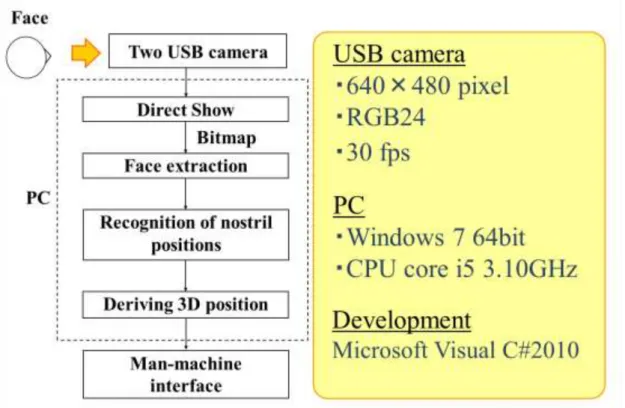
Fig.2.1 shows the processing flow and configuration of this system. A stereo camera consisting of two USB cameras is connected to the computer and converts the captured image into a bitmap image in real time [50]. Next, after detecting the face of the user by the image processing, the nostrils are detected as the face feature points, and the position measurement in the three-dimensional space of the object is realized by using the difference in the coordinates between the two images [51].
The overall image of the stereo camera is as shown in Fig.2.2, and the two cameras are fixed on an aluminum plate of 300 × 100 × 3 mm. set the axis in the direction of the arrow shown in Fig.2.2 with the midpoint of the camera fixed position as the origin.
In this experiment, we use two HD Webcam C615 of Logicool as USB cameras. The photograph is shown in Fig.2.3. In this camera, the CMOS sensor of 2.1 million pixels is used as an image sensor, and the focus is autofocus in 7cm-∞. The resolution can be up to 1920 × 1080 pixels (full HD 1080p) and the frame rate can be up to 30 fps, but in this research we use 640 × 480 pixel, 30 fps, RGB 24 shooting.
We used Microsoft Visual C# 2010 to construct the control program and developed GUI (Graphical User Interface) and system control as shown in Fig. 2.4 using C# as a programming language.
6
Fig. 2.1 Device system configuration
Fig.2.2 Stereo camera system
7
Fig. 2.3 USB camera (HD Webcam C615)
Fig. 2.4 GUI tool
8
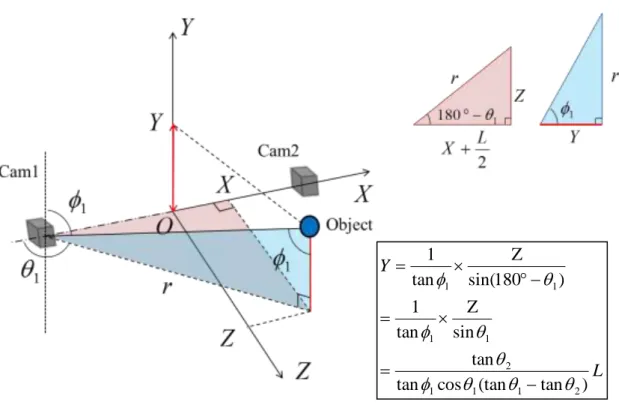
2.2 Basic formula for three-dimensional measurement by stereo camera
In this system, the position of an object in three-dimensional space is measured by using the difference (the parallax) of the coordinate position of the measurement object displayed in the image input simultaneously from the two USB cameras. For that purpose, it is necessary to determine the angle to the object in the three-dimensional space whose origin is the camera from the coordinates on the input image first. The concrete processing will be described below.
When the coordinates
x,y in the input image are set as shown in Fig. 2.5 and the angles, formed by the positive direction of the axis X and the axis Y with respect to the object are respectively as follows, the values are obtained from Fig.2.6 (a) and (b)
max
0 2 x
x (2.1)
max
0 2 y
y (2.2)
Here: angle0: the angle between the center axis of the camera and the axis X, angle
0: the angle formed by the center axis of the camera and the axisY,: viewing angle of the camera in the axis X direction,: viewing angle of the camera in the axis Y, xmax: axis X resolution of the camera : ymax : axis Y resolution of the camera,
x,y : Axial coordinate resolution of the object on the image.Since the parameters other than xandyon the right side of the formulas (2.1) and (2.2) are constants for each system, if the values of the coordinates
x,y acquired from the input image are substituted, the angle , to the object can be obtained from these equations.Furthermore, as shown in Fig. 2.7 (a), if the distance between the cameras is L and the difference between the coordinates of the camera 1 and the axis X of the object is l, the following two equations are obtained
l
Z
1
tan (2.3)
l L
Z
tan2 (2.4)
9
1,2 are the angles obtained by substituting Equation (2.1) for Camera1 and Camera2 respectively.
From this, by rearranging the formulas (2.3) and (2.4), the coordinates to the target with respect to the axis Z,
L Z
2 1
2 1
tan tan
tan tan
(2.5)
Furthermore, as shown in Fig. 2.7 (b) and (c), since Z is obtained by the formula (2.5), the value of the coordinates X, Y can be obtained and it is calculated by the following formula.
LL L
Z
L X Z
1 2
2 1
2 1
2 1
1
tan tan
2
tan tan
2 1 tan tan
tan 2 tan
2 180
tan
(2.6)
L L Y
) tan (tan
cos tan
tan
tan tan
tan tan sin
tan 1
sin Z tan
1
) 180 sin(
Z tan
1
2 1
1 1
2
2 1
2 1 1
1
1 1
1 1
(2.7)
Therefore, by using the equations (2.5), (2.6), and (2.7), it is possible to uniquely determine the coordinates
X,Y,Z
in the three-dimensional space of the target object based on the angles , calculated by coordiates (𝑥1, 𝑦1), (𝑥2, 𝑦2) which is obtained from the input images of two cameras of the system by this equation10
Fig.2.5 x and y-coordinate of capture image
(a) X-Z plane
max
0
2 x
x
11
Fig. 2.6 View angle (b) Y-Z plane
(a) Z-coordinates
max
0
2 y
y
l L
Z l Z
2 1
tan tan
L Z
2 1
2 1
tan tan
tan tan
12
(b) X-coordinates
L X Z
2
180 tan
tan
1 1
L
L X Z
1 2
2 1
1
tan tan
2
tan tan
2 tan
13
Fig. 2.7 Formula for computation (c) Y-coordinates
L Y
) tan (tan
cos tan
tan sin
Z tan
1
) 180 sin(
Z tan
1
2 1
1 1
2 1 1
1 1
14
2.3 Camera characteristics
Lens distortion
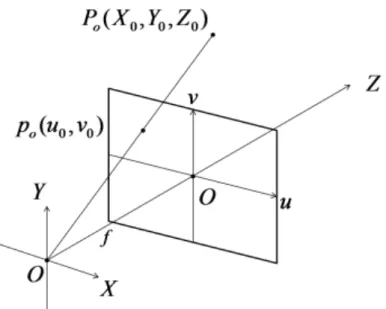
The most ideal camera model for monocular cameras is the "pinhole camera model" as shown in Fig.2.8. In this model, assuming the coordinates(X,Y,Z) of the three- dimensional space and the coordinates (u,v)on the screen as the focal length f of the lens, It is known that the relationship
Z f X
u (2.8)
Z f Y
v (2.9)
is established [50].
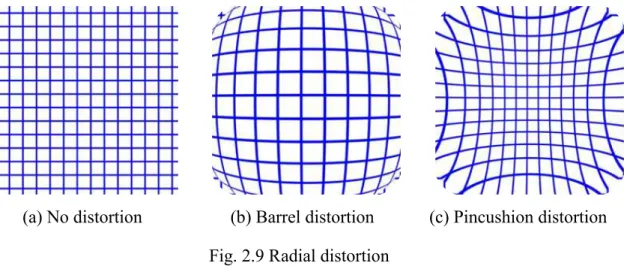
The pinhole camera model is a model without lens distortion, and the image input from this camera becomes an ideal input without distortion as shown in Fig.2.9 (a).
However, generally wide-angle cameras have barrel type aberrations like Fig.2.9 (b), telephoto cameras have pincushion type aberrations like Fig.2.9 (c). When the input image of the camera is distorted, an accurate value cannot be obtained from the target coordinates, so it is necessary to perform calibration to correct the distortion of the lens.
Therefore, as a preliminary experiment, when a grid-like image was taken with a resolution of 960 × 720 [pixels], it became as shown in Fig.2.10. The coordinates of the intersection point of this lattice are obtained and the scatter diagram is shown in Fig. 2.11.
In the vicinity of the center, the intersection line which was almost aligned draws a gentle curve at the edge of the image, which shows that it is the same barrel type aberration as Fig.2.9 (b). From the above results, in the present system, when converting the acquired coordinates into angles and calculating the three-dimensional position, the numerical value is corrected.
Camera and system parameters
When actually performing three-dimensional measurement from the coordinates of the
15
input image, parameters of the camera and the system such as the viewing angle in the axial Xdirection, the viewing angle in the axial Ydirection, the distanceL between the cameras shown in Fig.2.6 and Fig.2.7 are necessary. As a result of the verification, we decided to give the parameter 51.48[],39.30[],L232.28[mm] in this system.
Furthermore, in this system, the fixed angle0 of the camera in the axialXdirection was set as the angle correction. When imaging is performed at a resolution of 640 × 480 pixels using a camera of51.48[]. In order to construct a precise measurement system, fixation with accuracy less than the error of 0.1 is required, but since processing and attachment with this accuracy is difficult, numerical correction is added to the acquired coordinates.
The fixed angles0190.49[],0290.57[] of cameras 1 and 2 were judged to be optimal, respectively. These parameters are used for subsequent measurement.
Fig. 2.8 Pinhole camera model
0 0 0
0 0 0
Z f Y v
Z f X u
16
Fig. 2.9 Radial distortion
Fig. 2.10 Capture image
(a) No distortion (b) Barrel distortion (c) Pincushion distortion
17
Fig. 2.11 Intersection point in capture image
18
2.4 Verification experiment
Experimental method
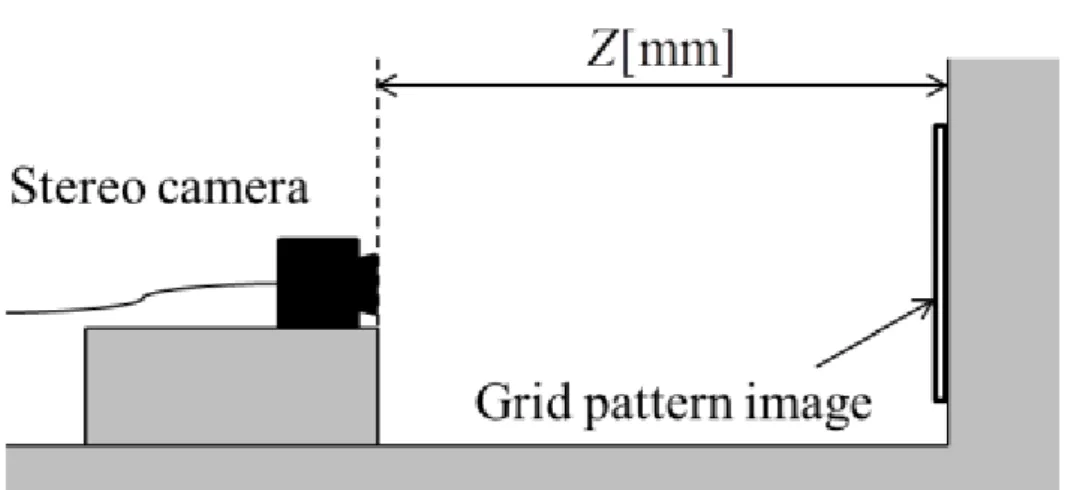
In this system, a verification experiment will be conducted on the error between the actual position and the theoretical value ofX,Y,Z calculated from the equations (2.5), (2.6), and (2.7) shown in Section 2.2.
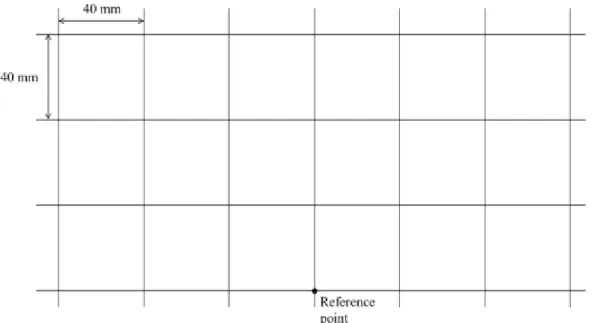
As shown in Fig.2.12, the camera is fixed so that the planeX Y and the wall surface are parallel, a lattice-like image is drawn by four horizontal lines and seven vertical lines at intervals of 40 [mm] as shown in Fig.2.13Zcx t6. The coordinatesxand coordinates
yof each intersection in two input images are acquired, and the position in the three- dimensional space of the measurement target is obtained from the parallax.
For the experiment, the distanceZ from the origin to the object was set at five points of 400 to 800 [mm] at intervals of 100 [mm].
Fig. 2.12 Experimental condition
19
Fig. 2.13 Grid pattern image
20
Experimental results
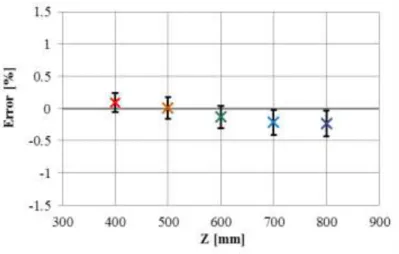
Fig.2.14 (a) - (e) shows the measurement results at each distance. Each data in the figure shows the relative position of each intersection pointX , Ywhen the intersection point of the lowest stage in Fig.2.13 is set as the reference point
0, 0
in the planeX Y . Also, the valuesZ at each point are shown in the figure. In addition, the number of measurement results decreases forZ 400[mm]andZ 500[mm], but this is due to the limitation of the field of view angle of the camera.Fig.2.15 (a) - (c) shows the distribution of error for each axis at each distance for these data. As shown in this figure, the position of the intersection point can be measured at approximately 40 [mm] intervals vertically and horizontally at any distance, It is within an error of about 0.5[%] of X and Y, and 1[%] of Z. And in these errors, the biggest errors is about 5[mm], by comparing with spoon size (26[mm]) and mouth size 50[mm][53], this size of error could be accepted.
From the above, the usefulness of this system to measure the position in three dimensional spaces from the coordinates of the input image of the stereo camera was confirmed.
21
(a) Z 400[mm]
(b) Z 500[mm]
22
(c) Z 600[mm]
(d) Z 700[mm]
23
(e) Z 800[mm]
Fig. 2.14 Relative position in the X-Y plane and estimated value of Z
24
(a) Z-axis
(b) X-axis
25
(c) Y-axis
Fig. 2.15 Error in each axis
26
Chapter 3 Feature point detection
3.1 Basics of image processing
Binarization processing - Labeling processing
In this system, by binarizing the input image from two USB cameras, labeling processing is performed to assign numbers to each connected component and by examining the shape features such as size and center of gravity for each component, and detects nostrils as facial feature points.
For binarization, RGB luminance signals at each coordinate of the input image are used.
Here, an example of binarization using the R signal will be described. Conditions for binarization are as follows.
t j i R
t j i j R
i
g 0 ,
,
, 1
(3.1)However, g is 1 or 0 sgn, R
i, j is the luminance of the R signal at the coordinates
i, j , t is the threshold.As shown in Fig.3.1, a process (labeling process) is performed to add a unique label for each connected component to each pixel in the binarized image,
0 , 0
1 , ,
j i g
j i g j n
i
l
(3.2)n is a natural number representing the label number of the connected component to which the coordinate
i,j belongs to.For the image in Fig.3.2 (a), the example of the image binarized by the formula (3.1) is shown in Fig.3.2 (b), and the result of the labeling process by the equation (3.2) is shown in Fig.3.2 (c).
27
Features of connected components
After performing binarization and labeling processing, obtain the area, center of gravity, aspect ratio of the connected component. Assuming that the area 𝑆𝑛 of the connected component of the label number n is the coordinates of the center of gravity
Gxn,Gyn
,
i j
n
n f i j
S , (3.3)
, )1 (
i j i S f
G
i j n n
xn
(3.4)
, ) 1 (j j i S f
G
i j n n
yn
(3.5)where
n j i l
n j i j l
i f
n, 0
,
, 1
(3.6)This is a function for determining whether or not the label number n in the coordinates
i,j matches.Next, the ratio (aspect ratio) between the vertical width and the horizontal width of the connected component is obtained. As shown in Fig.3.3, if the coordinates of the left end, the right end, the top end, and the bottom end of the connected component of the label number n are represented byxLn,xRn,yTn,yBn, and the aspect ratio as follows.
Tn Bn
Ln Rn
n y y
x AR x
(3.7)
28
Fig. 3.1 Labeling
(a) Original
(a) Binary format image (b) Result
29 (b) Binarized
(c) Labeled
Fig. 3.2 Image processing
30
Fig. 3.3 Aspect ratio
3.2 Basic policy of facial feature point search
In this study, we chose nostrils as facial feature points to detect position of mouth. For the reason,
Unlike eyes and mouth, shape is always stable.
It is located almost in the center of the face, and there are few noises around the face.
Since there are two, it is easy to search from features such as shape and distance.
Since the distance between the nostrils is short, the center of the nose is stably determined and the measurement result is stabilized.
Moreover, in this system, image processing is performed by using two cameras, and since a high resolution image of 640 × 480 [pixels] is used as an input image for improving measurement accuracy, When compared with a single camera system with resolution of the input image 320 ×240 [pixels], the information processing amount per frame is eight times, and a highly efficient algorithm is indispensable for processing in real time.
31
In addition, the input image from the camera usually contains many unnecessary noises such as unrelated background and shadow as shown in Fig.3.2 (a). When binarizing the input image as it is as shown in Fig.3.2 (b), a large amount of noise irrelevant to the background is generated and it becomes a big hindrance to searching for the facial feature point, it is important to remove noise.
In order to solve the above problems, we decided to detect the face before detecting the nostrils. For recognition of faces, it is possible to use an image processing library such as OpenCV, but in this system we propose proprietary algorithm to realize simple and fast processing.
In this algorithm, by limiting the processing range to only the necessary part, high speed operation and noise removal are performed with low load, and it is possible to search for a definite nostril. The rough flow of the algorithm is as follows,
1. Blur the input image and extract the region close to flesh color (face) as a connected component from the blurred input image.
2. Determine the face area from the center of gravity and area of the connected component with the largest area.
3. Search nostrils within the area of the determined face.
A specific nostril search algorithm in this system will be described below.
32
3.3 RGB values of input image
In searching nostrils, we aim to realize simple and fast processing, and in this research we will search for algorithms that can automatically detect faces and nostrils in RGB color space.
First of all, it is important to detect skin. Here, RGB color information in the input image is verified as a basis for detecting the face of the user according to the color information.
For three images with the face darkness changed step by step as shown in Fig.3.4, samples of a certain number of RGB values are sampled for each part of the face and verified. The number of samples collected at each site is as shown in Table 3.1.
Fig.3.5, Fig.3.6, and Fig.3.7 are graphs plotting the color distribution in the images of Fig.3.4 (a) - (c) for each part of the face. Here, the correlation was examined for six of R, G, B, the difference between R and G, the difference between R and B, and the difference between G and B.
Also, Fig.3.8 is a plot of percentage of RGB values in each pixel on a triangular graph.
Although there is a difference in brightness and darkness depending on conditions, the distribution relation of colors of RGB is almost isomorphic.
In addition, it can be confirmed that the components of R are stronger in the skin (◆), the nostrils (■), and the lips (▲) than in the other regions. Focusing on these three parts, almost every point holds R>G>B regardless of the brightness. Among them, the difference between R and B is very large.
Furthermore, although it depends on the brightness, it can also be seen from Fig.3.8 that the proportion of color is almost determined by the part. Fig.3.9 only shows the skin color of Fig.3.8 (a) - (c).
Here, we paid attention to the value of R, G, B, the ratio between every two colors, and the occupancy of each color. By using these conditions shown in these figures, the conditions for determining the pixel as skin are determined. In this system, colors that all meet the following conditions are defined as skin color, and processing is performed as a face candidate.
33
3 0 + <
< + 02 0
49 0 + <
< + 27 0
6 0 + <
< + 38 0
0
>
0
>
5 1
0
>
90
<
120
<
160
B . G R . B
B . G R . G
B . G R . R G-B
B . R- R-G B G R<
(3.8)
(a) Well-lighted
34 (b) Gloomy
(c) Backlight
Fig.3.4 Color sample image
35
Table.3.1 Number of sample
Part Number of sample
Skin 50
Nostril 20
Lip 20
Hair 50
Pupil 10
White of the eye 10
Eyebrow 20
Background 100
36 (a) R-G
(b) R-B
37 (c) G-B
(d) (R-G)-(R-B)
38
(e) (R-G)-(G-B)
(f) (R-B)-(G-B)
Fig. 3.5 Color of the parts of a face (Well-lighted)
39
(a) R-G
(b) R-B
40
(c) G-B
(d) (R-G)-(R-B)
41
(e) (R-G)-(G-B)
(f) (R-B)-(G-B)
Fig. 3.6 Color of the parts of a face (Gloomy)
42 (a) R-G
(b) R-B
43
(c) G-B
(d) (R-G)-(R-B)
44 (e) (R-G)-(G-B)
(f) (R-B)-(G-B)
Fig. 3.7 Color of the parts of a face (Backlight)
45
Fig. 3.8 Percentage of RGB
Fig. 3.9 Percentage of RGB (Skin)
(a) Well-lighted (b) Gloomy
(c) Backlight
46
3.4 Face detection algorithm
When detecting a face by processing, it is important to recognize the entire face as one connected component, but it is often not recognizable as a connected component depending on the state of the face such as shadows and spectacles. Therefore, in this algorithm, processing is performed on a blurred image of the original image in a mosaic pattern.
With 16 × 16 [pixels] as one block, divide 640 × 480 [pixels] into 40 × 30 blocks. Each block representative color(R',G',B') was determined from the average color of the representative points as follows.
3
0 3
0
3
0 3
0 3
0 3
0 16
4 , , 4
16 4 , , 4
16 4 , ) 4
' , ' , ' (
i j i j
i j
j i B j
i G j
i B R
G
R (3.9)
This size is based on the occupancy of human face with input image, here we determined to use at least ten blocks to express human face in horizontal direction. So we devided input image by 16×16 [pixels].
The result is shown in Fig3.10. Where,R
i, j ,G
i, j ,B
i,j are the luminance of R, G, B at coordinates
i,j .47
Fig. 3.10 Pixelization
For the image in Fig.3.10 (b), binarization is performed on the region satisfying the expression (3.8) and extracted, which is shown in Fig.3.11. In this state, it is easier to be affected by noise due to light and dark, so we decided to smooth the evaluation. In this case, as shown in Fig.3.12, a method of adding to eight adjoining blocks is adopted.
Let sgn g[i,j] in the coordinates(i, j) be the number of points after smoothing ]
, [ ' i j
g ,
1
1 1
1
] , [ ]
, [ '
i
i k
j
j k
j i g j
i
g (3.10)
The result of smoothing processing on the image in Fig.3.11 is shown in Fig.3.13. In Fig. 3.13 (a), the evaluation is higher for areas with redness, and Fig.3.13 (b) shows the area re-extracted the area where the evaluation is above a certain level. In this example,
(a) Original image
(b) Result
48
the extraction ofg'[i,j]1 is performed, but by narrowing this threshold it is also possible to narrow the range. Subsequently, components having the largest area among these extracted connected components are selected, and processing is performed for that area. This is shown in Fig. 3.13 (c).
Next, this area is converted into a rectangle with length and width of 4: 3. As shown in Fig. 3.14, if the areaS of the area is taken as the center of gravity(𝐺𝑥, 𝐺𝑦), 𝑘 = √𝑆 12⁄ let's be the rectangle of height4kand width3k.
Further, binarization processing is performed on the interior of this rectangle using equation (3.8), skin is extracted again, and the area and the center of gravity are determined to determine the area of where the face was finally.
The basic flow is the same as the first extraction, so it is omitted, but for the second time we have done processing on all pixels and not labeling processing. The results of binarization and the final results are shown in Fig. 3.15 and Fig.3.16. The red frame in the figure is the area obtained by the first search, and the white frame is the final area.
From the fact that the center of gravity of the rectangle is closer to the center of the face than the first search and the background noise contained in the left side is also cut, it can be understood that the area of the face can be further narrowed down.
Fig.3.17 compares the binary image of the original image and binarized image after determining face area by this algorithm. Fig.3.17 (b) shows that the noise has been removed considerably, and the effectiveness of the algorithm proposed in this research can be confirmed.
49
Fig. 3.11 Binarization result
Fig. 3.12 Smoothing
50
Fig. 3.13 Facial recognition
Fig. 3.14 Zone assignment
9
0 (a) Evaluation result
(b) Region extraction (c) Choose biggest one
S
) ,
(GxGy (Gx,Gy)
S
(a) Original region (b) Rectangular region (c) Side length
51
Fig. 3.15 Binarization result
Fig. 3.16 Final result
Fig. 3.17 Noise reduction
(a) Original image (b) With facial recognition
52
3.5 Verification experiment
Comparative experiment between our system and OpenCV
In order to verify the effectiveness of this algorithm, face detection is carried out using an actual image as input data. Eight images of 640 × 480 [pixels] still images whose conditions such as ambient brightness and face angle are changed are used as input images, and faces are detected by their respective algorithms.
As a comparison with this algorithm, we also decided to perform similar processing with OpenCV face detection function. OpenCV is a library for open source computer vision developed and published by Intel and is widely used in the field of image processing. Face detection by OpenCV is based on Viola-Jones method [13].
The result of face detection using the algorithm described in this research is shown in Fig. 3.18, and the face detection using the OpenCV library is shown in Fig.3.19.
In the case of propose method, in the condition such as well-lighted, gloomy, and backlight, our system can detect human face successfully. Even though the face is tilted, and to the side, the system can still detect human face. If the human is in a long distance from the camera, the system can detect human face. However, in the condition such as backlight and extremely dark background, our system can not detect human face.
The recoginition by OpenCV failed as shown in Fig.3.19 (d), (f), and (h), but the detection of our research was successful as shown in Fig.3.18 (d), (f), and (h), so it can be confirmed that it is very effective in this system on the premise of face detection.
So when the light is dark, sometimes, our system can not detect human face, but our system is developed for meal support equipment, so the condition of light is always bright , and when the light is bright enough, our system is better than OpenCV in face detection.
It proves that our system is useful for meal support equipment.
53
Fig. 3.18 Face Recognition (This algorithm)
(a) Well-lighted room (b) Gloomy room
(h) Profile (c) Backlight
(g) Distant position
(f) Leaned face (e) Extremely dark background
(d) Backlight in room
54
Fig. 3.19 Face Recognition (OpenCV)
(a) Well-lighted room (b) Gloomy room
(c) Backlight (d) Backlight in room
(e) Extremely dark background (f) Leaned face
(g) Distant position (h) Profile
55
Comparative experiment between our system and other camera equipment Because of there are kinds of face detection in our daily life, we compare face detection system with the other detection system, such as camera (FINEPIX Z-200fd of FUJIFILM corporation), and smartphone (IPhone X of Apple Inc.). The Viola-Jones method is generally applied to detection of human face by the camera and smartphone. The result is shown in Table.3.2.
In this table, the circle (○) means that the face of subject could be detected successfully, the triangle (△) means that the system mistake the face for the other part of the image, and the crosses (×) means that nothing was detected in input image.
We can see that accuracy rate of our system is almost 100%, and in front side, the accuracy rate of camera and smartphone is also 100%, however, in left and right side by camera, the accuracy rate is 33.3% and mismeasurement rate is 25%, in tile side by camera, the accuracy rate is 41.6%, and in left and right side by smartphone, the accuracy rate is 29.1%, in tile side by smartphone, the accuracy rate is 58.3%, so in face detection, our system is better than the other method.
Table.3.2 comparative experiment
Our system Camera (FINEPIX) Smartphone (IPhone X)
Subject front left right tilt front left right tilt front left right tilt
A ○ ○ ○ ○ ○ × × × ○ × × ○
B ○ ○ ○ ○ ○ × ○ × ○ × × ○
C ○ ○ ○ ○ ○ × ○ ○ ○ ○ × ○
D ○ ○ ○ ○ ○ △ × × ○ × × ○
E ○ ○ ○ ○ ○ × △ ○ ○ × ○ ○
F ○ ○ ○ ○ ○ ○ ○ ○ ○ × × ×
G ○ ○ ○ ○ ○ × ○ × ○ × × ×
H ○ ○ ○ ○ ○ △ × × ○ × ○ ×
I ○ ○ ○ ○ ○ ○ ○ × ○ ○ ○ ○
J ○ ○ ○ ○ ○ × △ ○ ○ × × ×
K ○ ○ ○ ○ ○ △ × × ○ × × ×
L ○ ○ ○ ○ ○ ○ △ ○ ○ ○ ○ ○
○ Detected △ Misrecognized ×Not detected
56
Setting the evaluation function
Focusing on the fact that there are many dark areas around the eyes, mouth, and chin, while paying attention to the fact that the proportion of bright skin around the nostrils is very large, the proportion of the skin occupied by each value 𝑦 in the face area is investigated, here the value 𝑦 means every row in transverse direction and as an evaluation function I decided to use it. When the width of the face area is x [pixel], the ratio occupied by the skin in 𝑦.
x y i g y
w
x
i
1
] , [ ]
[ (3.11)
This is smoothed and the noise removed is used for determining the nostrils. Assuming that the influence range in smoothing is up to the upper and lower 𝑛 rows,
n j w y
w
n y
n y j
] [ ]
[
' (3.12)
In this system, n is 80, it means that the area of face was divided into 80 rows. The flow of this series of processing is shown in Fig.3.20, and the result of actually processing the input image is shown in Fig.3.21.
While the eyes and eyebrows are purple and blue, the mouth and chin are nearly yellow in color, the nostrils are red and the percentage of skin is very high. So we can reduce the area of nostril detection and accelerate the detection speed.
57
Fig. 3.20 Weighting
Fig. 3.21 Weighting result
(b) Smoothing (a) Weighting process
Smoothing
1
0 (b) Smoothing
(a) Weighting
58
3.6 Nostril detection algorithm
Removal of unnecessary connected components
Detection of a nostril in the face region obtained by the method in the previous section will be described below.
Fig.3.22 (a) shows the result of binarizing and labeling the face region, but it can be confirmed that many connected components remain in addition to the nostrils. Therefore, narrowing down is performed from the feature quantity of each connected component.
First of all, it is a connected component that has a point on a side of a rectangle representing a face area.
The connected component existing at the end of the region is only one end of the component originally connected to the outside of the region, and its shape and size become distorted, which is likely to cause erroneous detection. Also, we excluded from the fact that the nostrils to be searched existed near the center of the face and judged that there was no problem. As a result, it becomes as shown in Fig.3.22 (b).
Next, narrow down according to the size of the component. Verification in the range of 300 to 1000 mm in this system confirmed that the area per nostril fell within the range of approximately 10 to 200 [pixels]. Therefore, connected components having areas not included in this range are excluded. It can be confirmed in Fig. 3.22 (c) that very small noise and components of large size are excluded.
Further, narrowing down is performed by the aspect ratio of expression (3.7). We decided to exclude components that do not satisfy the conditions1/3AR3 in this system. Horizontal mouth and eyes etc. are removed in Fig.3.22 (d).
The connected component left by narrowing down above is set as a nostril candidate.
In the example of Fig.3.20, only the nostril remains, but of course there are often more than three components left. Therefore, when there are
n
remaining components, it is necessary to verify all the combinations nC2 and narrow the components to one pair using the evaluation function.59
Fig. 3.22 Noise elimination method
Filtering nostril candidates
Let the areaS1 ,S2 of the two components be the center of gravityG1(x1,y1) , )
,
( 2 2
2 x y
G an example is shown in Fig.3.23.
First of all, the area ratio is used as a feature quantity for detecting pairs of nostrils.
Since the area of the nostrils is not greatly different between the left and right, only the pairs of connected components which satisfy the1/3S1/S23 are verified, and the rest are excluded.
Next is the slope between the nostrils. The inclination of the straight line passing through the two points is,
1 2
1 2
x x
y y x y
(3.13)
We narrowed down by the range of this slope. In this research it was made 5
. 0 / 5 .
0
y x .
For those that satisfy the above two conditions, then the distance between each connected component is confirmed. In this research we will use the distance between centroids.
If we let the centroid of the two components beG1(x1,y1) ,G2(x2,y2) then that distance d is
2 2 1 2 2
1 ) ( )
(x x y y
d (3.14)
. In the camera of this system, it was confirmed 𝑑 < 50 by verification that it is at a position of about 300 [mm] or more, so we will use this condition also for narrowing
(a) Binarization (b) Border (c) Size (d) Aspect
60
down.
At this stage,
The size of the component is close
The inclination of the straight line passing through two points is small
Short distance between two points
Therefore, the evaluation function with the connected component 𝑚 and 𝑛 is
]) [ 1 ( ]) [ 1 ( ) 10
( ] ,
[ d w ym w yn
x n y
m
e
(3.15)
We decided to recognize emin e[m,n]as 𝑚,𝑛 as a nostril. By this calculation, it is possible to withdraw the nostril preferentially from the connected component with high evaluation. However, the center of gravity of 𝑚 and 𝑛 is Gm (xm,ym),Gn(xn,yn).
The final result is shown in Fig.3.24. With this method it is possible to reliably detect both nostrils, we can calculate the midpoint (x,y)({x1x2}/2,{y1y2}/2)and use it as input to the position measurement system, it is possible to measure the position of the face in three-dimensional space with high speed and high accuracy.
Fig. 3.23 Feature value
61
Fig. 3.24 Final result
3.7 The relationship between mouth and nostril
In this research, the purpose is to carry food into human mouth, so after we detected the position of nostril because the shape of the nostril is stable compare with the other parts of the face, we pay attention to the position of the mouth according to the relative position of the mouth with respect to the nostril. Fig.3.25 shows the result of binaryzation about mouth and nostril, and as shown in Fig3.26, the position of mouth always under the position of nostril, so in this research, we scan the place after the binaryzation with biggest area under the nostrils to locate the position of the mouth.
62
Fig.3.25 Binaryzation of mouth and nostril
Fig.3.26 position relationship between mouth and nostril
And normally, in meal support device, we scan the front of the human face, and as shown in Fig.3.27 these are the examples of conditions of human face, in these figures, we realize that the center of double nostrils and the mid of the mouth are always in the same line which is the midline of face, so we can locate the area which we can always detect the position of the mouth.
Nostril detection
Mouth detection
63
Fig.3.27 several different condition of face posture
(a) Downward (b) Upward
(c) Tilt to right (d) Tilt to left
64
3.8 The detection of mouth
Here we propose a new detection method for the mouth position based on the relative position with respect to the nostrils. As shown in Fig.3.28, we consider the perpendicular bisector of two nostrils. The center point between the two nostrils can be described by
{𝑦𝑐 =𝑦𝑟𝑖𝑔ℎ𝑡−𝑦𝑙𝑒𝑓𝑡
2
𝑥𝑐 =𝑥𝑟𝑖𝑔ℎ𝑡−𝑥𝑙𝑒𝑓𝑡
2
(3.16)
Where, (𝑥𝑟𝑖𝑔ℎ𝑡, 𝑦𝑟𝑖𝑔ℎ𝑡) and (𝑥𝑙𝑒𝑓𝑡, 𝑦𝑙𝑒𝑓𝑡) are the position of the right and left nostrils respectively. By using this center point and the straight line formula
𝑦 = 𝑘𝑥 + 𝑏 (3.17) And in this case
{
𝑘 = −𝑥𝑟𝑖𝑔ℎ𝑡−𝑥𝑙𝑒𝑓𝑡
𝑦𝑟𝑖𝑔ℎ𝑡−𝑦𝑙𝑒𝑓𝑡
𝑏 = 𝑦𝑐 + 𝑥𝑐(𝑥𝑟𝑖𝑔ℎ𝑡−𝑥𝑙𝑒𝑓𝑡
𝑦𝑟𝑖𝑔ℎ𝑡−𝑦𝑙𝑒𝑓𝑡) (3.18) And according to the formula (3.16) the perpendicular bisector can be described by
𝑦 = −𝑥𝑐
𝑦𝑐𝑥 +𝑦𝑐2+𝑥𝑐2
𝑦𝑐 (3.19)
65
(a) front face (b) tilt to left (c) tilt to right
Fig.3.28 different direction of face
Fig.3.29 Size of human face
In this research, we also focus on the detection of eyes [54], as shown in Fig.3.29 we use the actually size of human face [53] to determine the area which we search of mouth, the average distance from eyes to the nostrils is ℎ𝑛𝑜𝑠𝑒 the average distance between nostrils and chin is ℎ𝑢𝑛𝑑𝑒𝑟 and the average wide of mandible is 𝑊,according to the data of human face size, the ratio between ℎ𝑢𝑛𝑑𝑒𝑟, ℎ𝑛𝑜𝑠𝑒 and 𝑊 is calculated as
66
{
𝑊
ℎ𝑛𝑜𝑠𝑒= 2.01
ℎ𝑢𝑛𝑑𝑒𝑟
ℎ𝑛𝑜𝑠𝑒 = 1.35 (3.20) And in our system, we detect the distance between eyes [54] and nostril as h̃𝑛𝑜𝑠𝑒 in real time, and according to the proportion between these ℎ𝑛𝑜𝑠𝑒 , ℎ𝑢𝑛𝑑𝑒𝑟 , and 𝑊 , the ℎ̃𝑢𝑛𝑑𝑒𝑟 and 𝑊̃ which we use to calculate the area of mouth detection will be work out by the formula below,
{
𝑊̃ = 𝑊
ℎ𝑛𝑜𝑠𝑒ℎ̃𝑛𝑜𝑠𝑒 ℎ̃𝑢𝑛𝑑𝑒𝑟 =ℎ𝑢𝑛𝑑𝑒𝑟
ℎ𝑛𝑜𝑠𝑒 ℎ̃𝑛𝑜𝑠𝑒 (3.21) After we calculate the area of the mouth, we reduce this area by experience below the nostril by α=5[pixel] and β=5[pixel] in W sides as shown in Fig.3.30.