5 ドにアルキル基など-Si-C-結合をもつ原料を用いることで、アルキル基など有機官能基を導入できる可 能性がある。この様に有機官能基を導入したシリカ膜はシリカ複合膜といえる。アモルファスシリカに、 有機官能基を導入することで、シリカ中に存在する有機物の分解などを利用でき、細孔径制御が可能に なると思われる。しかし、有機官能基の種類の影響、有機官能基の分解挙動、および、これらがアモル ファスシリカ膜の透過性能におよぼす影響は全くわかっていなかった。そこで、本論文の目的は、以下 の2 点とする。 1.有機官能基を含むアモルファスシリカ膜の作製法を体系化し、有機官能基の分解挙動によりこの 作製法を理論的に説明する。 2.これらの知見を元に細孔径制御を行うことで高い分離性能をもつ膜を作製し、具体的な分離系で 実証する。
Fig. 0.1 Molecular size
(kinetic diameter)7
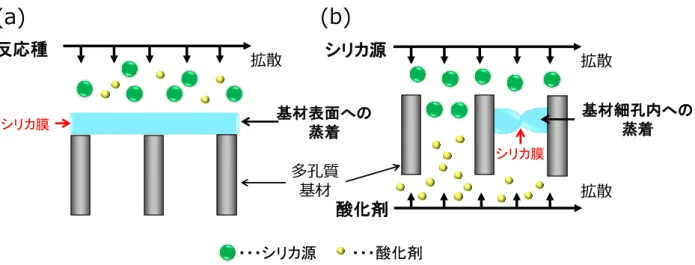
Fig. 0.2 Schematic diagram for a counter diffusion CVD method
Fig. 0.3 Schematic diagram for
amorphous silica networks derived8
Fig. 0.4 Constitution of this report
9
11 シリカ複合膜 アルコキシド結合の一部の結合をアルキル基などの有機物に置換したシリカ源を用いることで、有機 ―シリカ複合膜とし、シリカ複合膜と称する。-Si-C-結合は、-Si-O-C-結合と比較して結合エネルギーが 大きいので分解しにくい。そのため、蒸着するアモルファスシリカの構造中に有機官能基が一部残存す るはずである。シリカの緻密性と有機官能基の残存量により、細孔が変化する。 無機膜の基材 ゼオライト膜やシリカ膜など無機膜は、通常、アルミナなどの無機多孔質基材の上または基材細孔内 部に製膜される。高い分離性能を示す薄膜の形成には、基材の表面凹凸や細孔径の均一性、基材抵抗な ど、基材性能が重要な役割を担っている。 1.3 無機多孔膜の透過機構 無機多孔膜によるガス分離の主な透過機構は、クヌーセン拡散および分子ふるい機構である。Fig. 1.1 (a) に、クヌーセン拡散機構、Fig. 1.1 (b) に、分子ふるい機構のイメージ図を示し、以下に説明する。 最後に記号の説明を示す。
Fig. 1.1 Mechanisms for permeation of gases through membranes
1.3.1 クヌーセン拡散 細孔中の分子同士の衝突が支配的な場合、細孔中の流れは粘性流となる。細孔が小さく、分子の平均 自由行程と比較して十分に小さくなった場合、分子同士の衝突より細孔内壁と衝突が支配的となる。こ のような場合、分子の移動はそれぞれの分子の速度に比例するクヌーセン拡散状態となる。この時分子 の速度は分子量の平方根に反比例する。分子の細孔に対する衝突頻度は(1.1)式 4)で表わされる。Table
(b)
Pore size・・・small molecular ・・・large molecular
(a)
12 1-1 にクヌーセン拡散における分子速度比の一例を示す。
2 1
)
2
(
mkT
p
Zw
(1.1)
Table 1-1 Knudsen diffusion
13
Table1-2 Molecular size
14 (Ⅰ)一方拡散CVD 法 一方拡散 CVD 法は、シリカ源蒸気を基材の片側から供給する方法であり、膜の反対側を吸引する ことなどで基材表面に蒸着させる工夫がなされている。Fig. 1.2 (a) に一方拡散 CVD 法による蒸着イ メージ図を示す。 (Ⅱ)対向拡散CVD 法 対向拡散CVD 法は、2 種の反応種を基材の両側より供給する方法である。反応種にはシリカ源と 酸素やオゾンなど反応性の高い気体を用いる。この方法は、反応種の拡散により反応を制御する点が 特徴であり、細孔内に蒸着したシリカで反応種の拡散が抑制され反応が停止する。そのため、ピンホ ールを作らず薄膜な膜を作製するのに適した技術といえる。Fig.1.2 (b) に対向拡散 CVD 法による蒸 着イメージ図を示す。
Fig. 1.2 Schematic diagrams for the CVD methods classified by the supply geometry of
precursors (a) one side geometry CVD method,(b) couter diffusion CVDmethod
1.5 具体的な分離系の例 1.5.1 水素系 水素は、使用する過程で二酸化炭素を排出しないため、有効なエネルギーキャリアとして注目されて いる。水素選択透過膜は、Pd など金属系とシリカなどセラミック系の分離膜に分類できる。ここでは、 シリカ系の水素選択透過膜に注目する。シリカ系の水素選択透過膜としては、水素以外の分子を透過し ないことを目的とした場合と、トルエンなど比較的大きな分子との分離を目的とした2 種に大別できる。 前者は水素/窒素透過率、後者は水素/SF6透過率比で評価されることが多い。以下に、ゾルゲル法とCVD 法による水素選択透過膜についての既報を述べる。
15 にTEOS を用い、γ-アルミナ基材上にゾルゲル法でシリカ膜を作製した。分離層が 30 nm で細孔は 0.5 nm 以下とピンホールの無い緻密な膜が得られた。この膜での 200 °C における水素/メタン透過率比は 500 以上となり、水素透過率は 2 x 10⁻⁶ mol m-2 s-1 Pa-1となった。高温焼成により、シリカが緻密にな ることが報告された。Asaeda と Yamazaki8)らは190 °C で温めた α-アルミナ基材上にゾルゲル法を用 いてコロイド状シリカゾルからシリカ膜を作製した。300 °C にて水素透過率は 1.3 x 10⁻⁶ mol m-2 s-1 Pa-1、水素/メタン透過率比 150 であった。Kanezashi ら 9)はゾルゲル法により C-C 結合をもつ Bis (triethoxysilyl) ethane をシリカ源として細孔径制御を試みている。水素透過率 0.2~1 x 10⁻⁵ mol m-2 s-1 Pa-1で水素/SF6透過率比1000~25500 となる膜の開発に成功した。この膜にて 99.9 %以上の水素製造 によりメチルシクロヘキサン転化率を向上させることに成功している。
16
シリカ源からなる膜は細孔が大きくなっていると言える。シリカ源中の Si と直接結合したアルキル基 の炭素数は、細孔径制御に重要な意味をもつことが示された。
Fig. 1.3 Permeance propaties of the silica membrane deposited
by TMOS, MTMOS, PrTMOS, HTMOS and DTMOS
23)1.5.2 二酸化炭素系 二酸化炭素は、温室効果ガスとして地球温暖化の最大の原因とされている。二酸化炭素の排出量削減 のために、農業・畜産業など人為起源からの排出量の抑制や森林の維持・育成や二酸化炭素は回収貯留 (CCS) 技術の開発など、二酸化炭素を削減する努力が進められている。特に、CCS 技術に関する報告 は多い。現在、CCS 分離技術として主に、化学吸収法、物理吸収法、吸着法、膜分離法が用いられてい る。化学吸収法はアミン系の溶剤を用いて化学的に二酸化炭素を吸収液に吸収させ分離する方法である。 二酸化炭素の回数率が高い・大容量に適している・消費動力が少ない等の長所がある反面、加熱用エネ ルギーが大きい・吸収液や部材の劣化速度が速く、コストが高い等の短所がある。エネルギー消費の多 くが二酸化炭素を吸収した溶剤を加熱し二酸化炭素を放散する過程で使用されている。よって、放散す
0
10
20
30
40
H
2permeance
[
×10
-8mol m
-2s
-1P
a
-1]
0
200
400
600
800
H
2/N
2permea
nce ra
tio [ - ]
0
10
20
30
40
TMOS MTMOS PrTMOS HTMOS DTMOS
18
Fig.1.4 The comparison of CO
2/CH
4separation selectivity classified according
19
Fig. 1.5 The comparison of CH
4/C
2H
6separation factors
1.5.3.2 プロパン/プロピレン系 現在、2-プロパノールは、酸を触媒としたプロピレンの水付加により作製されている。触媒としてリ ン酸を用いた場合、転化率が低いため、不純物であるプロパンが濃縮する。このプロピレンとプロパン の分離プロセスには、段数が200 以上を越える蒸留塔が用いられている。そこで、膜分離プロセスを利 用することにより、大幅な省エネルギー化が期待されている41)。Fig. 1.6 に、代表的なプロピレン/プロ パン分離膜の報告例をまとめた。Burns と Koros 42)は高分子膜におけるプロピレン/プロパン分離のレ ビューを報告している。ポリイミド膜においてプロピレン/プロパン透過率比が最大値 27 (プロピレン透 過係数 0.76 Barrer)を示したが、一般の高分子膜ではプロピレン/プロパンの選択性は 10 程度であった。 選択性を向上させるため、銀イオンを利用した促進輸送膜の検討も行われている43,44)。Stoitsas ら45) は、 多孔質γ-Al2O3上に多孔質シリカをゾルゲル法で合成し、その膜を硝酸銀水溶液に充填させ、プロピレ ン-銀イオン(π)-錯体形成相互作用メカニズムを利用し、プロピレン/プロパン分離膜を開発した。銀を付 加した多孔質シリカ膜は40 °C で等モルのプロピレン/プロパン混合分離にて、プロピレン透過率 2.0 x 10⁻¹⁴ mol m-2 s-1 Pa-1、プロピレン選択性が最大7.7 を示す膜を得た。また、Kang ら46)は、
20
BPDA-PPDA ポリイミドをベースとした炭素膜での 35 °C におけるプロピレン透過率は 7.9 x 10⁻¹⁰ mol m-2 s-1 Pa-1となり、プロピレン/プロパン透過率比 46 を示した47)。Tiscornia ら48)は、 ETS-10 ゼオライ ト膜を用い、30 °C におけるプロピレン/プロパン混合ガスの透過試験をにて、プロピレン透過率 1.3 × 10⁻⁷ mol m-2 s-1 Pa-1、プロピレン/プロパン選択性は最大で 7.2 となることを示した。Pan ら49)は、MOF (metal organic framework) として ZIF-8 膜の 100 °C における透過試験を行った。プロピレン透過率は 4 x 10⁻⁹ mol m-2 s-1 Pa-1、プロピレン/プロパン透過率比は 40 程度であった。また、Kanezashi ら50)は、ゾルゲ ル法により多孔性シリカ膜を作製し、50 °C のプロピレン/プロパン透過率比が 6.9~33 (プロピレン透 過率0.2~6.3 x 10⁻⁷ mol m-2 s-1 Pa-1)と報告している。Nair ら51)はゾルゲル法により作製されたシリカ 膜にて、50 °C でプロピレン/プロパン透過率比が 1.7 を示した。一方、Sea ら52)は、CVD 法によりシ リカ膜を作製した。200 °C でのプロピレン/プロパン透過率比は 0.8~1.0 程度であった。
Fig. 1.6 C
3H
6/C
3H
8selectivity for membranes
21
Fig. 1.7 Vapor-liquid equilibrium diagram of benzene/cyclohexane (a) 25 °C, (b) 80 °C
ベンゼン/シクロヘキサン分離膜の既往の研究を以下に記す。Kusumocahyo ら53)は、高分子であるセ ルロースアセテートにジニトロフェニルを含有した高分子複合膜を開発し、70 °C における分離係数 103 (透過流束:1.0 x 10⁻² kg m-2 h-1) を示した。無機膜では、You ら54)によって、NaY ゼオライト膜で の透過試験において、ベンゼン選択性13、ベンゼン透過流束 8.2 x 10⁻² kg m-2 h-1となることを報告し ている。また、Rh を含む H-β-ゼオライトをポリビニルクロライドに導入することで、ベンゼン透過流 束3.9 x 10⁻² kg m-2 h-1、ベンゼン選択性が26 を示す膜が得られた55)。 1.6 参考文献 1) 化学工学会分離プロセス部会 化学工学会編, 最近の化学工学63ここまできた膜分離プロセス~基 礎から応用~, 三恵社, 東京 (2014) 2) 小野嘉夫, 八嶋建明(2000) ,ゼオライトの科学と工学, 講談社サイエンティフィク 3) 冨永博夫(1987) , ゼオライトの科学と応用, 講談社サイエンティフィク 4) 日本膜学会, 膜学実験法 -人工膜編- 5) 工業調査会, よくわかる分離膜の基礎
6) C. J. Brinker, T. L. Ward, R. Sehgal, N. K. Raman, S. L. Hietala, D. M. Smith, D. W. Hua and T. J. Headley, Ultramicroporous silica based supported inorganic membranes., J.Membrane Sci.
77 (1993) 165-179
7) R. M. de Vos and H. Verweij, Improved performance of silica membranes for gas separation, J.
Membrane Sci. 143 (1998) 37-51
8) M. Asaeda and S. Yamasaki, Separation of inorganic/organic gas mixtures by porous silica membranes, Sep. Purif. Tech. 25 (2001)151–159
9) M. Kanezashi, M. Kawano, T. Yoshioka and T. Tsuru, Organic-inorganic hybrid silica membranes with controlled silica network size for propylene/propane separation, Ind. Eng. Chem. 51 (2012) 944–953 0 0.2 0.4 0.6 0.8 1 0 0.2 0.4 0.6 0.8 1 be nze ne m ol e fr act io n in eva por a te
benzene mole fraction in feed
0 0.2 0.4 0.6 0.8 1 0 0.2 0.4 0.6 0.8 1 be nze ne m ol e f ract io n in eva po rat e
benzene mole fraction in feed
22
10) T. Okubo and H. Inoue, Introduction of specific gas selectivity to porous glass membranes by treatment with tetraethoxysilane, J. Membrane Sci. 42 (1989) 109–117
11) G. R. Gavalas, C. E. Megiris and S. W. Nam, Deposition of H2-permselective SiO2 films, Chem.
Eng. Sci. 44 (1989) 1829–1835
12) M. Tsapatsisi, S. Kim, S. W. Nam and G. Gavalas, Synthesis of Hydrogen Permselective SiO2, TiO2, Al2O3, and B2O3 Membranes from the Chloride Precursors, Ind. Eng. Chem. Res., 30 (1991) 2152–2159
13) D. Lee and S. T. Oyama, Gas permeation characteristics of a hydrogen selective supported silica membrane, J. Membr. Sci. 210 (2002) 291–306
14) S. Nakao, T. Suzuki, T. Sugawara, T. Tsuru and S. Kimura, Preparation of microporous membranes by TEOS/O3 CVD in the opposing reactants geometry, Microporous Mesoporous
Mater. 37 (2000) 145–152
15) S. Morooka, S. Yan, K. Kusakabe and Y. Akiyama, Formation of hydrogen-permselective SiO2 membrane in macropores of α-alumina support tube by thermal decomposition of TEOS, J.
Membr. Sci. 101 (1995) 89–98
16) D. Lee, L. Zhang, S. T. Oyama, S. Niu and R. F. Saraf, Synthesis, characterization, and gas permeation properties of a hydrogen permeable silica membrane supported on porous alumina,
J. Membr. Sci. 231 (2004) 117–126
17) T. Yamaguchi, X. Ying, Y. Tokimasa, B. N. Nair, T. Sugawara and S. Nakao, Reaction control of tetraethyl orthosilicate (TEOS)/O3 and tetramethyl orthosilicate (TMOS)/O3 counter diffusion chemical vapour deposition for preparation of molecular-sieve membranes, Phys. Chem. Chem.
Phys., 2 (2000) 4465-4469
18) M. Nomura, K. Ono, S. Gopalakrishnan, T. Sugawara and S. Nakao, Preparation of a stable silica membrane by a counter diffusion chemical vapor deposition method, J. Membr. Sci. 251 (2005) 151–158
19) M. Nomura, H. Aida, S. Gopalakrishnan, T. Sugawara, S. Nakao, S. Yamazaki, T. Inada and Y. Iwamoto, Steam stability of a silica membrane prepared by counter diffusion chemical vapor deposition, Desalination 193 (2006) 1–7
20) B.-K. Sea, K. Kusakabe and S. Morooka, Pore size control and gas permeation kinetics of silica membranes by pyrolysis of phenyl-substituted ethoxysilanes with cross-flow through a porous support wall, J. Membr. Sci. 130 (1997) 41–52
21) Y. Ohta, K. Akamatsu, T. Sugawara, A. Nakao, A. Miyoshi and S. Nakao, Development of pore size-controlled silica membranes for gas separation by chemical vapor deposition, J. Membr. Sci., 315 (2008) 93–99
22) M. Seshimo, T. Saito, K. Akamatsu, A. Segawa, S. Nakao, Influence of toluene vapor on the H2-selective performance of dimethoxydiphenylsilane-derived silica membranes prepared by the chemical vapor deposition method, J. Membr. Sci. 415-416 (2012) 51–56
23
24) 三村知弘, 林幹洋, 萩生大介, CO2化学吸収プロセスの開発~世界最高の低熱消費量への挑戦~, 新 日鉄エンジニアリング技報 3 (2012) 25–30
25) 飯嶋 正樹, 中谷 晋輔, 燃焼排ガスからのCO2回収技術, 化学工学会, 77 (2013) 300–303
26) Y. Zhang, J. Sunarso, S. Liu, R. Wang, Current status and development of membranes for CO2/CH4 separation: A Review, Int. J. Greenh. Gas Control 12 (2013) 84–107
27) M. L. Cecopieri-G´omez, J. P. Alquisira, J.M. Dom´ınguez, On the limits of gas separation in CO2/CH4, N2/CH4 and CO2/N2 binary mixtures using polyimide membranes, J. Membr. Sci. 293 (2007) 53–65
28) C.-C. Chen, W. Qiu, S. J. Miller, W. J. Koros, Plasticization-resistant hollow fiber membranes for CO2/CH4 separation based on a thermally crosslinkable polyimide, J. Membr. Sci. 382 (2011) 212–221
29) R. Swaidan, B. S. Ghanem, E. Litwiller, I. Pinnau, Pure- and mixed- gas CO2/CH4 separation properties of PIM-1 and an amidoxime-functionalized PIM-1, J. Membr. Sci. 457 (2014) 95–102 30) J.-J. Qin and T.-S. Chung, Development of high-performance polysulfone/poly(4-vinylpyridine)
composite hollow fibers for CO2/CH4 separation, Desalination 192 (2006) 112–116
31) L. J. P. van den Broeke, F. Kapteijn, J. A. Moulijn, Transport and separation properties of a silicalite-1 membrane. II. Variable separation factor, Chem. Eng. Sci. 54 (1999) 259–269
32) J. C. Poshusta, R.D. Noble, J. L Falconer, Temperature and pressure effects on CO2 and CH4 permeation through MFI zeolite membranes, J. Membr. Sci. 160 (1999) 115–125
33) K. Kusakabe, T. Kuroda, A. Murata, S. Morooka, Formation of a Y-Type zeolite membrane on a porous α-Alumina tube for gas separation, Ind. Eng. Chem. Res. 36(3) (1997) 649–655
34) T. Tomita, K. Nakayama, H. Sakai, Gas Separation Characteristics of DDR Type Zeolite Membrane, Microporous Mesoporous Mater. 68 (2004) 71–75
35) S. Li, J. L. Falconer, R. D. Noble, SAPO-34 membranes for CO2/CH4 separations: Effect of Si/Al ratio, Microporous Mesoporous Mater. 110 (2008) 310–317
36) Y. Cui, H. Kita, K.-I. Okamoto, Preparation and gas separation performance of zeolite T membrane, J. Mater. Chem. 14 (2004) 924–932
37) A. Khosravi, and M. Sadeghi, Separation performance of poly(urethane–urea) membranes in the separation of C2 and C3 hydrocarbons from methane, J. Membr. Sci. 434 (2013) 171–183 38) I. Pinnau and Z. He, Pure- and mixed-gas permeation properties of polydimethylsiloxane for
hydrocarbon/methane and hydrocarbon/hydrogen Separation, J. Membr. Sci. 244 (2004) 227–233
39) J. M. van de Graaf, E. van der Bijl, A. Stol, F. Kapteijn, and Jacob A. Moulijn, Effect of Operating Conditions and Membrane Quality on the Separation Performance of Composite Silicalite-1 Membranes, Ind. Eng. Chem. Res. 37 (1998) 4071–4083
40) J. O. Titiloye and I. Hussain, Synthesis and characterization of silicalite-1/carbon-graphite membranes, J. Membr. Sci. 318 (2008) 50–58
41) 原伸生, 金属有機構造を用いた気体分離膜, ゼオライト 131(2) (2014) 43–50
24 membranes, J. Membr. Sci. 211 (2003) 299–309
43) R. B. Eldrige, Olefin/paraffin separation technology: A Review, Ind. Eng. Chem. Res., 32 (1993) 2208–2212
44) D. J.Safarik and R. B. Eldrige, Olefin/paraffin separation by reactive absorption: A Review, Ind.
Eng. Chem. Res. 37 (1998) 2571–2258
45) K.A. Stoitsas, A. Gotzias, E.S. Kikkinides, Th.A. Steriotis, N.K. Kanellopoulos, M. Stoukides and V.T. Zaspalis, Porous ceramic membranes for propane–propylene separation via the p-complexation mechanism: unsupported systems, Microporous Mesoporous Mater. 78 (2005) 235–243
46) S. W. Kang, K. Char and Y. S. Kang, Novel application of partially positively charged silver nanoparticles for facilitated transport in olefin/paraffin separation membranes, Chem. Mater.
20 (2008) 1308–1311
47) J. Hayashi, H. Mizuta, M. Yamamoto, K. Kusakabe and S. Morooka, Separation of
ethane/ethylene and propane/propylene systems with a carbonized BPDA-pp’ODA polyimide membrane, Ind. Eng. Chem. Res. 35 (1996) 4176–4181
48) I. Tiscornia, S. Irusta, C. T´ellez, J. Coronas and J. Santamar, Separation of propylene/propane mixtures by titanosilicate ETS-10 membranes prepared in one-step seeded hydrothermal synthesis, J. Memb. Sci., 311 (2008) 326–335
49) Y. Pan, T. Li, G. Lestari and Z. Lai, Effective separation of propylene/propane binary mixtures by ZIF-8 membranes, J. Membr. Sci. 390-391 (2012) 93–98
50) M. Kanezashi, W. N. Shazwani, T. Yoshioka and T. Tsuru, Separation of propylene/propane binary mixtures by bis(triethoxysilyl) methane (BTESM)-derived silica membranes fabricated at different calcination temperatures, J. Membr. Sci. 415-416 (2012) 478–485
51) B. N. Nair, K. Keizer, W. J. Elferink, M. J. Gilde, H. Verweij, A. J. Burggraaf, "Synthesis, characterisation and gas permeation studies on microporous silica and alumina-silica membranes for separation of propane and propylene, J. Membr. Sci. 116 (1996) 161–169 52) B.-K. Sea, K. Kusakabe, S. Morooka, Pore size control and gas permeation kinetics of silica
membranes by pyrolysis of phenyl-substituted ethoxysilanes with cross-flow through a porous support wall, J. Membr. Sci. 130 (1997) 41–52
53) S. P. Kusumocahyo, T. Ichikawa and T. Shinbo, Pervaporative separation of organic mixtures using dinitrophenyl group-containing cellulose acetate membrane, J.Membr.Sci. 253 (2005) 43–48
54) Z.You, B. Li and J. Wang, Synthesis of NaY zeolite membrane for separation of benzene-cyclohexane by pervaporation, Petrochem. Technol., 36 (2007) 804–807
25
26 2.1 原料 2.1.1 基材 本研究では、シリカ複合膜の基材として、α-アルミナ多孔質上に、細孔径が 5 nm 程度の γ-アルミナ 層をコーティングした2 層構造のキャピラリーを用いた。Table 2-1 に、α-アルミナ多孔質(NOK 社製) の物性値を示す。
Table 2-1 Characterizations of porous α-alumina substrate
ガラスおよびγ-アルミナ被覆処理の方法を以下に説明する。まず、ガラス被覆処理の手順を述べる。 三角フラスコ内に、α-テルピネオールを 27.22 g、エチルセルロース 9.55 g、粉末ガラス (GA-13) 40.53g、 エタノールを適量導入し、60 °C で撹拌する。α-アルミナ多孔質を、水とアセトンにて、それぞれ 2 回 洗浄後、有効膜部分をテフロンテープで巻き、両端はキムワイプを詰める。このα-アルミナ多孔質の両 端を、予め調整した溶液に10 秒間ディップする。ディップ後にテフロンテープを基材から取り外し、 電気炉に入れ1200 °C で 1 時間焼成した。電気炉の昇温速度は 1200 °C まで 2 時間とし、2 時間で室 温まで冷却した。
27
Fig. 2.1 Production process for boehmite and PVA sol
Fig. 2.2 Photograph of 35 cm and 6 cm substrates
2.1.2 酸化剤
本研究では、製膜を行う際の酸化剤としてオゾンを用いている。オゾン発生器として、商研株式会社 製のZOS-YB-6G と SOW-5000R を用いた。Table 2-2 に ZOS-YB-20G と SOW-5000R の仕様を示す。
Table 2-2
Specification of ozonizer
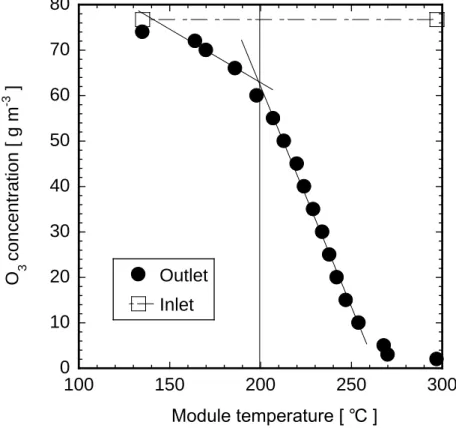
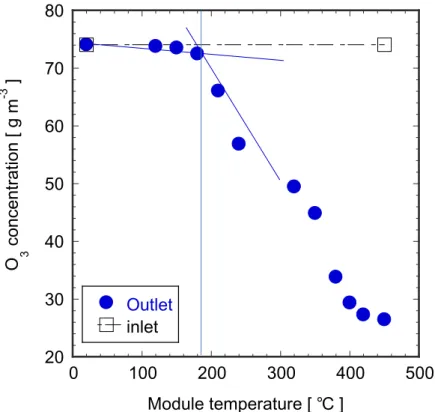
28 オゾンは、膜反応器中で熱分解するので、反応器出口のオゾン濃度を測定した。パラメータは、入口 オゾン濃度、モジュール温度、モジュールサイズである。オゾン濃度測定器はEG-600(荏原実業株式 会社製)を用いた。Fig. 2.3に、ZOS-YB-20Gを用いた場合の35 cmモジュール出口のオゾン濃度測定結 果を示す。酸化剤流量の供給を0.2 L min-1とし、モジュールの入口のオゾン濃度を76.8 g m-3 とした。 モジュール温度を300 °Cとした場合のモジュール出口のオゾン濃度は2.0 g m-3となった。図に挿入した 直線より、オゾン濃度の変曲点は約200 °Cであった。200 °Cより高温では、オゾンの熱分解速度が増加 し、オゾン濃度が大きく減少した。 Fig. 2.4に6 cm用モジュール出口のオゾン濃度測定結果を示す。モジュール入口のオゾン濃度を74.0 g m-3 とした。モジュール温度を300 °Cとした場合の出口のオゾン濃度は、約50 g m-3であった。Fig. 2.3 で示した35cm用モジュール出口のオゾン濃度より高い値であった。Fig. 2.5に、SOW-5000Rの6 cm用 モジュール出口のオゾン濃度測定結果を示す。モジュールの入口のオゾン濃度は52.4 g m-3 であるのに 対して、240 °Cでは6.5 g m-3と初期値の87.6 %に大きく減少した。300 °Cでのモジュールの出口のオゾ ン濃度は2.5 g m-3となった。オゾン濃度の変曲点は約250 °Cであった。オゾンの熱分解挙動がモジュー ル長さで変化するわけではないので、35cm用モジュールとの変曲点の違いは、滞留時間の変化を示し ていると思われる。Fig. 2.6に、酸化剤流量とモジュール体積から算出したオゾンの滞留時間と、6 cm 用モジュール出口のオゾン濃度の関係を示す。出口オゾン濃度を対数軸とすることで、図中のオゾン濃 度は滞留時間に対して直線的に減少した。これより、オゾン濃度は一次反応で分解したと思われる。
Fig. 2.3 O
3concentrations at the inlet or at the outlet of the membrane module
by changing the module temperature (Total oxidant flow rate 0.2Lmin
-1)
29
Fig. 2.4 O
3concentrations at the inlet or at the outlet of the membrane module
by changing the module temperature (Total oxidant flow rate 0.2Lmin
-1)
(6 cm module, ZOS-YB-20G)
Fig. 2.5 O
3concentrations at the inlet or at the outlet of the membrane module
by changing the module temperature (Total oxidant flow rate 0.2Lmin
-1)
30
Fig. 2.6 O
3concentrations at the outlet of the CVD apparatus
by changing the residence time (300 °C)
31
2.1.3 シリカ源
本実験では、信越化学製の珪素化合物をシリカ源として用いた。実験に用いた珪素化合物の試薬一覧 をTable 2-3 に示す。
Table 2-3 Details values of Silica precursors
32 2.2 蒸着方法 CVDおよび透過試験装置図を図2.7に示す。多孔質γ-アルミナキャピラリー基材の両側をバイトン O-リングによりシールした。酸素 1.0 L min-1 をオゾン発生器に導入し、オゾン発生器から排出した酸素 とオゾンを混合したガスを必要な流量に調製し、基材の内側に供給した。便宜上、酸素とオゾンが混合 したガスの流量を酸化剤流量と呼ぶ。シリカ源を45~125 °Cのバブラーに導入し、0.2 L imn-1の窒素に て基材の外側に流通させた。蒸着温度は150~500 °C、蒸着時間は5~90 minとした。
Fig. 2.7 Schematic diagram for a counter diffusion CVD apparatus
Thermocouple Cold trap Vent Bubble flow meter O-ring MFC N2 H2 MFC Bubbler Furnace Pressure gauge MFC O2 Read out Pressure transducer Vacuum pump :Ribbon heater MFC SF6 Vent Membrane Ozonizer Vent Needle valve
Cold trap
Vent
O-ring
MFC
N
2
Bubbler
Pressure
gauge
Pressure
transducer
Vacuum
pump
34 本論文では、ベンゼン/シクロヘキサン PV 試験おを行った。所定濃度の供給液を室温~80 °C に保ち、 60~240 min 定常を待ったのち、30~360 min サンプリングした。供給液および透過液はガスクロマ トグラフィー(GC8-A, 島津製作所:ベンゼン/シクロヘキサン系、SBS-120 SHINCARBON A 80/100: デカン系Thermon-3000 SHINCARBON A 60/100)にて分析した。、透過液が少ない場合は、透過液 を1 mL のトルエンで希釈後、分析を行った。
Fig. 2.8 A schematic diagram for PV apparatus
2.4 官能基分析
アモルファスシリカ上の官能基の分解挙動を検討するために、各種シリカ源の加水分解物粉末をゾル ゲル法により作製した。Table 2-4 に、原料モル比の一覧を示す。シリカ源にエタノールと酸あるいは 塩基を加えた後、80 °C で 2 時間撹拌する。得られた固形物は 100 °C 12 時間乾燥させた。
Table 2-4 The molar compositions of the solutions
35 熱重量測定 熱重量(以下TG)測定には、TGA 50(島津製作所)を用いた。窒素またはオゾンを供給し、昇温速 度を3~5 °C min-1とした。また、各温度の分解速度を解析するために、各温度で2 h 保温して重量減 少速度を測定した場合もある。詳細な温度変化条件は、各実験結果に示す。 フーリエ変換赤外分光光度測定 フーリエ変換赤外分光光度(以下、FT-IR)測定は、FTIR-8400S(島津製作所)を用いて行った。測 定前に、前節で作製した加水分解粉末の前処理を行った。Fig. 2.9 に、前処理装置のイメージを示す。 加水分解物粉末をφ 3mm の石英管の中に設置し、片方に石英ウールを詰めた。石英ウールを詰めてい ない側より、オゾンを流量0.2~0.8 L min-1にて供給し、温度が150~450 °C となるよう制御した。こ 処理後の粉末をFT-IR 測定することで、アモルファスシリカ上の各種官能基の分解挙動を調査した。
Fig. 2.9 Schematic diagram of the powder treatment apparatus
36
37
3.1 加水分解物の官能基分析 3.1.1 熱重量測定
39
Fig. 3.1 Thermogravimetric measurements for TMOS, DMDMS, MTMOS and
ETMOS derived powders under N
2(5 °C min
-1)
Fig. 3.2 Thermogravimetric measurements for PrTMOS, HTMOS and
DTMOS derived powders under N
2(5 °C min
-1)
40
Fig. 3.3 Thermogravimetric measurements for PrTMOS, PhTMOS and
DPhDMS derived powders under N
2(5 °C min
-1)
Fig. 3.4 Thermogravimetric measurements for PrTMOS, APTEOS, APTMOS and
APDMS derived powders under N
2(5 °C min
-1)
41 次に、ステップ加熱法での 1 時間あたりの重量減少速度について、PrTMOS、PhTMOS および DPhDMS 粉末の比較を行った。Fig. 3.5 に解析結果を示す。PhTMOS 粉末、 DPhDMS 粉末の総重量 減少は12.8 wt%および 24.7 wt%であった。Fig. 3.3 で示した値より小さくなった。PhTMOS 粉末では 300 °C 以下、PrTMOS 粉末と DPhDMS 粉末では 360 °C 以下にて、処理温度の上昇共に 1 時間あたり の重量減少速度は増加した。240 °C 以下での 1 時間あたりの重量減少速度は PhTMOS が最も大きかっ た。360 °C 以上では PhTMOS 粉末の重量減少速度は小さかった。Fig. 3.3 での PhTMOS 粉末の結果 と同様に、360 °C 以上ではフェニル基が残存していない。PrTMOS では、360 °C での重量減少速度は 5.1 wt% h-1となった。PhTMOS 粉末の結果と比較するとプロピル基の方が、熱安定性が高いと言える。
42
3.1.2 赤外分光評価
Fig. 3.6 に、未処理 PrTMSO 粉末の IR を示す。1000cm-1付近では、Si-O-Si または Si-C を示している。 1070cm-1では、Si-nC
3H7を示しており、1100cm-1付近は、Si-O-Si 鎖状である。2960cm-1付近は、C-CH3 を示している。
Fig. 3.6 Infrared spectroscopy for a powder sample prepared from PrTMOS as-made
43
Fig. 3.7 FT-IR measurements of the DMDMS, ETMOS and PrTMOSderived
powder samples after O
3treatment at 150–450 °C for 90 min
Fig. 3.8 FT-IR measurements of the PrTMOS, HTMOS and DTMOS derived
powder samples after O
3treatment at 150–450 °C for 90 min
44
オゾン濃度を95 g m-3とすることで、300 °C 以下の処理の吸収比が低下した。この結果より、300 °C 以下の処理では、オゾンによりプロピル基が分解していることが示された。一方、320 °C 以上の処理で は、Fig. 3.9 の結果と同様に、供給オゾン濃度に寄らず、吸収比は 0.2 程度であった。
Fig. 3.9 FT-IR measurements of the hydrolyzed PrTMOS derived powder samples
after O
3treatment at 150–400 °C for 90 min (Feed O
3concentration 75 g m
-3)
Fig. 3.10 FT-IR measurements of the hydrolyzed PrTMOS derived powder samples
after O
3treatment at 150–400 °C for 90 min (6 cm module)
45
あった。一方、DPhDMS 粉末の 360 °C 処理後では、吸収比は約 0.7 と高い値であった。
Fig. 3.11 FT-IR measurements of thePhTMOS and DPhDMS derived
powders samples after O
3treatment at 150–450 °C for 90 min
(6 cm module, PrMOS: 95 m
-3, PhTMOS and DPhDMS: 47 g m
-3)
3.2 蒸着試験
Fig. 3.12 に PrTMOS 320 °C 蒸着膜の SEM 画像を示す。断面画像では、2 層が観察された。一番下の
層はα-アルミナ基材、上の層は γ-アルミナ層である。γ-アルミナ層は 12 μm であった。蒸着部分の観察 は困難であった。表面と断面画像のどちらからもシリカ粒子が蒸着していることが確認されていないこ とから、基材細孔中にて蒸着が行われていると推測される。
Fig. 3.12 SEM images for the PrTMOS membrane deposited at 320 °C
(a) Surface view, (b) Cross-sectional view
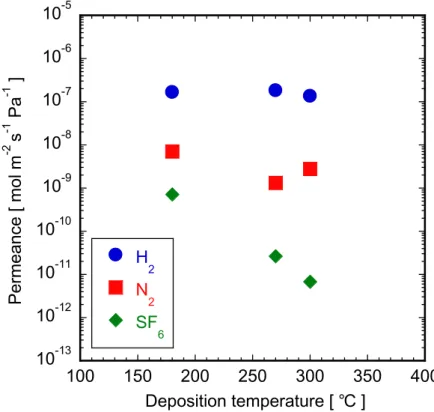
46 3.2.1 無機ガス透過 3.2.1.1 アルキル基由来 次に、各シリカ源で蒸着した膜の透過試験結果を示す。Fig. 3.13 に、PrTMOS をシリカ源として 150 ~400 °C 蒸着膜のガス透過試験結果を示す。以下、供給酸化剤流量を 0.2 L min-1とした。35 cm モジ ュールを用い、オゾン供給濃度は75 g m-3にて製膜を行った。蒸着温度150、180 °C では SF6透過率 が2.7~5.0 x 10⁻¹⁰ mol m-2 s-1 Pa-1と比較的高い値であった。この蒸着温度では、十分な蒸着が進行し ていないことが示唆された。一方、蒸着温度400 °C では、SF6透過率が高くなった。Fig. 2.2 で示した ように、300 °C 以上のモジュール出口では、供給したオゾン濃度と比較して非常に低い濃度となってい た。そのため、十分蒸着しなかったと思われる。蒸着温度240 °C では、水素/窒素透過率比が 250 とな り、水素選択透過膜が得られた。水素,窒素の分子径は0.29 nm,0.36 nm であることより、得られた 膜の細孔径は0.3 nm 程度と考えられる。蒸着温度 270 °C では、窒素/SF6透過率比が529 となった。 SF6の分子径が0.55 nm であることより、細孔径は、0.4~0.5 nm 程度と考えられる。いずれの蒸着温 度でも製膜再現性は高く、5 サンプル中全てで 240 °C 蒸着では水素/窒素透過率比が 25 以上、270 °C 蒸着では窒素/SF6透過率比が300 以上の膜が得られた。Fig. 3.7 で示したように、PrTMOS 粉末の 270 °C オゾン処理後では、40 %もプロピル基が残存していた。有機官能基の残存量が、得られた膜の 細孔径と関係があると思われる。詳細な検討には、蒸着膜の官能基分析などが必要である。以上より、 オゾン系の対向拡散CVD 法では、適切な蒸着温度に制御する必要があると言える。
Fig. 3.13 Single gas permeances through the PrTMOS derived membranes
by changing deposition temperatures for 90 min
(35 cm module, feed O
3concentration 75 g m
-3)
47
Fig. 3.14、 Fig. 3.15 に DMDMS および ETMOS をシリカ源とした場合の無機ガス透過率の蒸着温 度依存性を示す。前節で検討した通り、200 °C から 300 °C の範囲での蒸着を検討した。DMDMS 240 °C 蒸着膜にて水素/窒素透過率比が 100 程度となった。また、270 °C 蒸着膜では、水素透過率は 6.9 x 10⁻⁸ mol m-2 s-1 Pa-1 、水素/SF6透過率比約2500 となり、PrTMOS 蒸着膜と同様の傾向が見られた。 ETMOS 270 °C 蒸着膜の水素/窒素透過率比が約 150 となった。300 °C 蒸着膜の窒素/SF6透過率比は 410 となった。Fig. 3.1 に示した熱重量測定結果では、DMDMS 粉末の分解開始温度が ETMOS 粉末の 分解開始温度より低かった。そのため、ETMOS を用いた蒸着で、窒素/SF6透過率比が高くなる膜が得 られる温度が高くなったと思われる。 Fig. 3.16 に、HTMOS をシリカ源とした場合の無機ガス透過率の蒸着温度依存性を示す。この蒸着条 件では高い透過率比を示す膜が得られなかった。
Fig. 3.14 Single gas permeances through the DMDMS derived membranes deposited
for 90 min by changing deposition temperatures
(6 cm module, feed O
3concentration 95 g m
-3)
48
Fig. 3.15 Single gas permeances through the ETMOS derived membranes deposited for
90 min by changing deposition temperatures
(6 cm module, feed O
3concentration 95 g m
-3)
Fig. 3.16 Single gas permeances through the HTMOS derived membranes deposited
for 90 min as a function of deposition temperatures
(35 cm module, feed O
3concentration 75 g m
-3)
49
蒸着時間依存性
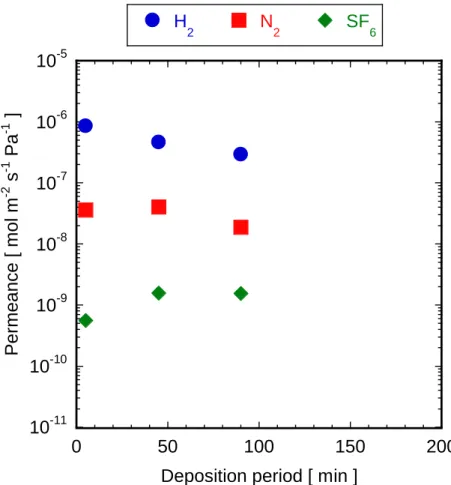
Fig. 3.17 に、PrTMOS をシリカ源とした場合の 270 °C 蒸着における蒸着時間が無機ガス透過率に及 ぼす影響を示す。5 min 蒸着膜の水素透過率は 5.4 x 10⁻⁸ mol m-2 s-1 Pa-1であった。90 min 蒸着膜では 水素透過率は1.3 x 10⁻⁶ mol m-2 s-1 Pa-1と上昇した。窒素透過率も水素透過率の変化と同様に5 min 蒸 着から、90 min 蒸着まで上昇した。一方、SF6透過率は、5 min 蒸着後 6.0 x 10⁻¹⁰ mol m-2 s-1 Pa-1であ ったが、徐々に減少していき、180 min 蒸着には 7.3 x 10⁻¹¹ mol m-2 s-1 Pa-1となった。この結果、90 min 蒸着後に、窒素/SF6透過率比が最大値である 529 を示した。PrTMOS 膜の場合、短時間蒸着では高い 選択性を示す膜は得られなかった。5 min から 90 min 蒸着膜で水素、窒素の透過率が上昇している点 は、蒸着後の有機物の分解によるものだと説明できる。一方、SF6透過率は、5 min から 180 min 蒸着 膜まで、蒸着時間の増加とともに減少している。270 °C 蒸着では、反応種はオゾンであると想定してい る。窒素が透過する細孔であっても、オゾンは透過できないために、長時間蒸着においても透過率比が 上昇したと思われる。 Fig. 3.18 に、HTMOS をシリカ源とした場合の、360 °C 蒸着の蒸着時間が単成分ガス透過率に及ぼ す影響を示す。5 min 蒸着後の水素透過率は 8.6 x 10⁻⁷ mol m-2 s-1 Pa-1、90 min 蒸着後には 2.9 x 10⁻⁷ mol m-2 s-1 Pa-1と減少した。一方、SF6透過率は、5 min 蒸着後で 5.6 x 10⁻¹⁰ mol m-2 s-1 Pa-1、90 min 蒸着 後には、1.6 x 10⁻⁹ mol m-2 s-1 Pa-1と増加した。窒素/SF6透過率比は5 min 蒸着後に 64 と最大値を示し た。360 °C の蒸着では反応種は酸素と考えられるため、窒素が透過する細孔が残存する場合は、酸素が シリカ源側に拡散し、反応が停止しないと思われる。これより、300 °C 以上の反応温度では短時間での 蒸着が重要である。
Fig. 3.17 Time course of gas permeances through the PrTMOS derived membranes
deposited at 270 °C (35 cm module, feed O
3concentration 75 g m
-3)
10
-1310
-1210
-1110
-1010
-910
-810
-710
-610
-50
50
100
150
200
H
2N
2SF
6Permea
nce [ mo
l m
-2s
-1Pa
-1]
50
Fig. 3.18 Time course of gas permeances through the HTMOS derived membrane
deposited at 360 °C (35 cm module, feed O
3concentration 75 g m
-3)
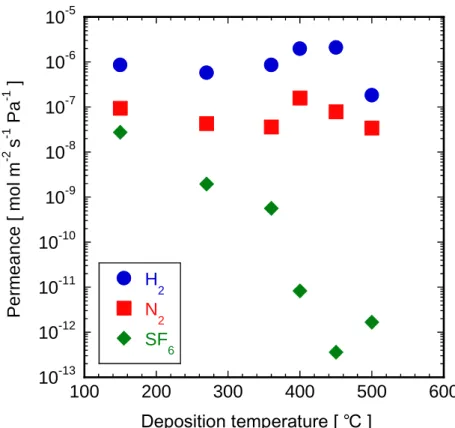
Fig. 3.19 に、HTMOS をシリカ源として、5 min 蒸着した場合の単成分ガス透過率の温度依存性を示 す。150 °C 蒸着膜の SF6透過率は2.8 x 10⁻⁸ mol m-2 s-1 Pa-1であったが、蒸着温度450 °C では 3.6 x 10⁻¹³ mol m-2 s-1 Pa-1と最も低くなった。450 °C 蒸着膜の窒素/SF6透過率比は2.2 x 105と最大値を示した。 この値は我々の調査した範囲では最も高い。これは、高温かつ短時間で蒸着したことにより、薄膜が得 られたためと考えられる。10
-1110
-1010
-910
-810
-710
-610
-50
50
100
150
200
H
2N
2SF
6Permea
nce [ m
ol m
-2s
-1Pa
-1]
51
Fig. 3.19 Effect of deposition temperature through the HTMOS derived membranes
deposited for 5 min (35 cm module, feed O
3concentration 75 g m
-3)
52
Fig. 3.20 Single gas permeances through the PrTMOS derived membranes by changing
feed O
3concentration
(6 cm module, deposition period 5 min)
53
Fig. 3.21 Single gas permeances through the PrTMOS derived membranes as a
function of deposition temperatures deposited for 90 min
(6 cm module, Feed O
3concentration: (a) 95 gm
-3, (b) 75 gm
-3)
54
3.2.1.2 フェニル基由来
Fig. 3.22 と Fig. 3.23 に、PhTMOS と DPhDMS をシリカ源として 150~450 °C、90 min 蒸着で製 膜した膜の単成分透過試験結果を示す。PhTMOS 由来の膜と DPhDMS 由来の膜では、蒸着温度に対 するガス透過性の傾向に大きな違いが現れた。PhTMOS 由来の膜では、270~320 °C の蒸着時に、SF6 透過率が10-10 mol m-2 s-1 Pa-1以下と緻密な膜となった。320 °C 蒸着膜の窒素/SF6透過率比は2400 と 高い値を示した。DPhDMS をシリカ源とした場合、蒸着温度により異なる分離性能を示した。180 °C 蒸着膜では、窒素/SF6透過率比が2530 、SF6透過率1.8 x 10⁻¹¹ mol m-2 s-1 Pa-1と緻密な膜が得られた。 また、180 °C では、反応器出口のオゾン濃度が 16 g m-3と比較的高かった。DPhDMS 由来の膜にて 200 °C 以下の蒸着で高い分離性能を示した理由として、粉末 IR 分析より、DPhDMS 由来の膜では有 機物残存量が多いためであると推測できる。210 °C にて蒸着した膜の SF6透過率は1.0 ×10⁻⁹ mol m-2 s-1 Pa-1 以上、窒素/SF6透過率比は63 と透過率比が低い値であった。210 °C の蒸着温度では、DPhDMS の分解が遅いためか蒸着が不十分であったと考えられる。300~400 °C 蒸着では 400 を越える高い窒素 /SF6透過率比を示す膜が得られた。400~500 °C の蒸着では、窒素/SF6透過率も40 以下と低い膜が得 られた。酸化物である有効オゾン濃度が反応器内の熱分解などにより低下したためと思われる。
Fig. 3.22 Single gas permeances through the PhTMOS derived membranes
as a function of deposition temperatures through membranes
deposited for 90 min (feed O
3concentration: 47 gm
-3)
55
Fig. 3.23 Single gas permeances through the DPhDMS derived membranes
as a function of deposition temperatures through membranes
deposited for 90 min (feed O
3concentration: 47 gm
-3)
56
Fig. 3.24 Single gas permeances through the PhTMOS derived membranes deposited at
300 °C by changing feed O
3concentration
Fig. 3.25 Single gas through PhTMOS derived membranes deposited at 300 °C by
changing the residence time (feed O
3concentration: 47 g m
-3)
57
3.2.1.3 無機ガス透過まとめ
58
Fig. 3.26 H
2permselective silica hybrid membranes
Fig. 3.27 Relationship of carbon number and H
2activation energy
59 次に、TMOS/O2系 600 °C 蒸着膜と HTMOS/O3系 450 °C 蒸着膜の 270 °C における単成分透過ガ スについて比較した。Fig. 3.28 に、各透過分子の分子径に対する単成分透過率について示す。 TMOS 600 °C 蒸着膜の水素/窒素透過率比は 5000 以上と大きい。しかしながら、水素が 10-7 mol m-2 s-1 Pa-1 オ ーダーと低い。それに対し、HTMOS450 °C 蒸着膜では、1.0 x 10⁻⁶ mol 程度と高い水素透過率を示し、 窒素透過率もTMOS600 °C 蒸着膜と比較して 3000 倍と高い。このグラフより HTMOS450 °C 蒸着膜 の平均細孔径はTMOS 由来の膜より大きいといえる。
Fig. 3.28 Single gas permeances plotted as a function of molecular size of
the permeation gas calculated based on the L-J potential (270 °C)
60
3.3 具体的な分離系 3.3.1 二酸化炭素系
ここでは、透過温度が300 °C 程度にて二酸化炭素/メタン透過率比を示す膜の開発を目指す。まず、 PrTMOS、PhTMOS 由来の膜の蒸着温度依存性を調べた。Fig. 3.29、 Fig. 3.30 に PrTMOS および PhTMOS をシリカ源とした蒸着温度依存性を示す。PrTMOS 由来の膜の二酸化炭素透過率は 5 x 10⁻⁹ ~1 x10⁻⁷ mol m-2 s-1 Pa-1であるのに対して、PhTMOS 由来の の膜の二酸化炭素透過率は 1 x10⁻⁷ mol m-2 s-1 Pa-1以上となった。また、PrTMOS 由来の膜では、窒素とメタン透過率が異なるのに対して、 PhTMOS 由来の膜では、窒素とメタン透過率はほぼ同程度となった。
Fig. 3.29 Single gas permeances through the PrTMOS derived membranes
by changing deposition temperatures for 90 min
(6 cm module, feed O
3concentration 75 g m
-3)
61
Fig. 3.30 Single gas permeances through the PhTMOS derived membranes
as a function of deposition temperatures through membranes
deposited for 90 min (feed O
3concentration: 47 gm
-3)
62
Fig. 3.31 CO
2/CH
4permeance ratios plotted as function of CO
2permeance
through PrTMOS and PhTMOS derived membranes
Fig.3.32 Relationship between SF
6permeances and CO
2/CH
4permeance
63
Fig.3.33 に
、
得られた膜の単成分透過率と透過分子の分子径の関係を示す。水素透過率は、10-7 mol m-2 s-1 Pa-1オーダーであった。PhTMOS 由来の膜の窒素透過率は水素透過率と同程度となった。一方、 TMOS 由来の膜の窒素透過率は 3.2 x 10⁻¹¹ mol m-2 s-1 Pa-1と非常に低い。PrTMOS 由来の膜の窒素透 過率は1.5 x 10⁻⁸ mol m-2 s-1 Pa-1であった。このグラフの傾きが細孔径分布を示していることより、有 機物が残存していると考えられるPhTMOS、PrTMOS 由来の膜は TMOS 由来の膜よりも細孔径が大 きいと推測される。今回の分離膜は水素~メタン間での傾きが直線的に下がっており、細孔径に分布が 存在する。そのため、二酸化炭素~メタン間の傾きをよりシャープにすることができれば、更なる選択 性の向上が見込める分離系といえる。Fig.3.33
Single gas permeances and kinetic diameter of the permeation gases
64
65
Fig.3.35 The comparison of CO
2/CH
4separation selectivity classified according
to temperatures
3.3.2 炭化水素系 3.3.2.1 メタン/エタン系 ここでは、高メタン/エタン透過率比を示す膜の開発を目指す。高いメタン/エタン透過率比を示すた めに、窒素/ SF6透過率比とSF6透過率に注目した。メタン (0.382 nm)とエタン (0.442 nm)は、窒素 (0.368 nm )と SF6 (0.551 nm)の間に位置している。そのため、ある程度高い窒素/SF6透過率比を示す 必要がある。また、SF6透過率が低いことは、ピンホールの数の減少を示しており、SF6透過率が低い ことも重要だと考えた。そこで、蒸着温度、酸化剤流量、シリカ源を検討項目とすることで、高いメタ ン選択透過膜を得ることを目的とする。66
Fig. 3.36 Single gas permeances through the PrTMOS derived membrane prepared
by changing deposition temperatures for 90 min
(a) N
2/SF
6permeance ratio, (b) CH
4permeance, (c) CH
4/C
2H
6ratio
(6 cm module, feed O
3concentration 75 g m
-3)
67
が小さい場合は、反応器中でのオゾンの熱分解により、有効オゾン濃度が低下していると考えられる。 Fig.3.24 で検討した通り、オゾン濃度が一定以上高くなった場合、SF6透過率が上昇することがわかっ ている。オゾンは、反応開始材としての役割だけでなく、細孔径の微細制御にも関与していると考えら れる。
Fig. 3.37 Relationship of SF
6permeances and CH
4/C
2H
6permeance ratios
through PrTMOS derived membranes
Fig. 3.38 Effect of O
3flow rate on single gas permeation through membranes
deposited at 300 °C
68
Fig. 3.39 に、300 °C にて蒸着した ETMOS 由来における膜の単成分透過率の透過分子径依存性を示 す。参考までに、Fig. 3.38 に示した PrTMOS 由来の膜のデータも示してある。酸化剤流量を 0.2 L min-1 供給したETMOS 由来の膜のエタン透過率は、PrTMOS 由来の膜よりも小さくなった。ETMOS 由来 の膜のメタン/ エタン透過率比は 37 と非常に高い値を示した。メタン、エタンの透過率比が高かったこ とより、300 °C 蒸着での ETMOS 由来の膜の細孔径は 0.40 nm 程度であると考えられる。
Fig. 3.39 Effect of silica precursors on single gas permeation through membranes
deposited at 300 °C
(feed O
3concentration: 95 g m
-3, permeation temperature 270 °C)
69
Fig. 3.40 CH
4/C
2H
6selectivity for membranes
3.3.2.2 プロパン/プロピレン系
ここでは、高プロピレン/プロパン透過率比を示す膜の開発を目指す。Table 1.2 で示すように、透過 分子のL-J 径は、プロピレンは 0.468 nm、プロパンは 0.506 nm である。シリカ源には PrTMOS と HTMOS を用いた。Fig. 3.2 より、HTMOS は PrTMOS よりも分解温度が高くなり、Fig. 3.20 が示す ように高温かつ短時間で高い窒素/SF6透過率比を示した。
70
以上と非常に高かった。プロパンおよびSF6の透過率は、いずれも1.0 x 10⁻¹² mol m-2 s-1 Pa-1 以下と 非常に低かった。
Fig. 3.41 Single gas permeances plotted as a function of molecular size of the
permeation gas calculated based on the L-J potential
(permeation temperature 270 °C)
Table 3-2 Activation energies of permeation through
the HTMOS/O
2derived membranes prepared at 450 °C for 5 min
Permeation molecules
Eact[ kJ mol-1 ]
N2 C3H6 C3H8 SF6 -3.3 -0.8 22 13
71
Fig. 3.42
Relationship of N
2/SF
6permeance ratio and C
3H
6/C
3H
8permeance ratio
through the PrTMOS and HTMOS derived membranes
72
Fig. 3.43
C
3H
6/C
3H
8selectivity for membranes
3.3.2.3 ベンゼン/シクロヘキサン系
ここでは、蒸着温度、オゾン流量、シリカ源を検討項目とすることで、ベンゼン/シクロヘキサン分離 膜の開発を目指す。
73
Fig. 3.44 Effect of deposition temperature on single gas permeation and
PV performances through the PrTMOS derived membranes
(6 cm module, feed O
3concentration 75 g m
-3)
(a) Single permeance (b) Total flux of benzene/cyclohexane
(c) Separation factor of benzene/cyclohexane
74
Fig. 3.45 Effect of O
3flow rate on single gas through the membranes deposited
at 320 °C (a) Single gas permeation through the membranes (b) FT-IR
Fig. 3.46 に、酸化剤流量を変化させて製膜した場合、ベンゼン/シクロヘキサン PV 試験結果を示す。 酸化剤流量0.4 L min-1 での蒸着膜の全透過流束は2.2 x 10⁻⁴ kg m-2 h-1 、ベンゼン選択性は 113 と最 大値を示した。
(a)
(b)
0
0.2
0.4
0.6
0.8
1
0
0.2
0.4
0.6
0.8
1
No
rm
ariz
ed a
bsor
banc
e
at 2960 cm
-1[
]
Oxidant flow rate [ L min
-1]
75
Fig. 3.46 Effect of O
3flow rate on PV performances through the PrTMOS derived
membranes deposited at 320°C
(a) Total flux of benzene/cyclohexane (b) Separation factor of benzene/cyclohexane
Fig. 3.47 に、PhTMOS、DPhDMS 由来の膜の 25 °C と 60 °C におけるベンゼン/シクロヘキサン PV 試験結果を示す。SF6透過率とPV 試験における全透過流束は相関がある。
0
40
80
120
0
0.2
0.4
0.6
0.8
1
Separation
factor
benzene/c
ycl
ohexane
[-]
76
77
Fig. 3.48 Relationship of single gas permeations and PV performances through
the DPhDMS derived membranes deposited at 180–450 °C
78
Fig. 3.49 The comparison of PV performance among the DPhDMS membranes
deposited at 300 °C with different temperature
Fig. 3.50 に PrTMOS 由来の膜、PhTMOS 由来の膜と DPhDMS 由来の膜における PV 試験結果を まとめる。DPhDMS 由来の膜にて、PrTMOS と PhTMOS 由来の膜より高い透過流束を示した。
Fig. 3.50 The comparison of PV performance in our groups study and previous study
3.3.2.4 デカン系 ここでは、本研究のシリカ複合膜を用い、重質油分離の可能性検討を行った。炭素数10 の炭化水素 であるn -デカン、デカリン、テトラリンの 3 種類の分離を目的とする。PhTMOS 240, 320 °C 蒸着膜
0
10
20
30
40
50
60
10
-310
-2Separation factor
flux
79 および、PrTMOS 320 °C 蒸着膜を用い、様々な細孔径をもつ膜で検討を行った。透過率は、Fig. 3.22 (b) とFig. 3.23 を参照されたい。 Fig. 3.52 に、室温での n -デカン、デカリン、テトラリンの 3 種類の単成分 PV 試験結果を示す。240 °C にて蒸着したPhTMOS 由来の膜は、320 °C にて蒸着した PhTMOS 由来の膜と比較して透過流束が高 かった。透過流束は、デカリン>テトラリン>> n -デカン順に小さくなった。分子径は、デカリン> テトラリン> n -デカンの順に小さい。一般に、分子ふるい機構では小さな分子の透過流束が高くなる ことより、今回の透過は分子ふるい機構ではないと考えられる。膜中のフェニル基との親和性などが推 測されるが、今後詳細な検討が必要である。 Fig. 3.53 に、320 °C にて蒸着した PrTMOS 由来の膜の 80℃における PV 透過試験結果を示す。透 過流束はn -デカン>テトラリンの順となった。n -デカンとテトラリンの透過流束比は 7.3 となり、今 回の試験した透過流束比の中で最も高い値を示した。膜中のプロピル基では、炭素との吸着が見られて いないため、分子ふるい機構であると考えられる。 今後の検討として、PrTMOS, PhTMOS と DPhDMS などをシリカ源を用い、フェニル基と炭素数 10 の炭化水素との親和性などを検討していくべきである。
Fig. 3.52 PV performance at room temperature through PhTMOS derived membranes
deposited at 240 °C and 320 °C
0
0.2
0.4
0.6
0.8
1
PhTMOS 240℃蒸着膜
PhTMOS 320℃蒸着膜
n-decane
decalin
tetralin
80
Fig. 3.53 PV performance at 80 °C through PrTMOS and PhTMOS derived
membranes deposited at 240 °C and 320 °C
0
0.02
0.04
0.06
0.08
0.1
decane
decaline
tetraline
81
84
文献リスト
本研究に関連する論文を以下に記載する。1. “High temperature propylene/propane separation through silica hybrid membranes”, E. Matsuyama, A. Ikeda, M. Komatsuzaki, M. Sasaki, M. Nomura, Separation and Purification Technology, vol.128, pp. 25-30, 2014.5 2. 「対向拡散 CVD 法による高温プロピレン透過膜の開発」,松山絵美,内海惠介,池田歩,野村幹 弘,化学工学論文集, vol.39(4), pp. 301-306, 2013.7 3. 「対向拡散 CVD 法により作製したシリカ複合膜のベンゼン/シクロヘキサン浸透気化分離」,松 山絵美,木村紗有佳,門間慶太,内海惠介,三宅遼,河本高志,黒沼良介,野村幹弘,化学工学 論文集,vol.39(2), pp. 98-103, 2013.5
4. “Preparation of silica hybrid membranes for high temperature CO2 separation”, Mikihiro Nomura, Emi Matsuyama, Ayumi Ikeda, Makoto Komatsuzaki, Misa Sasaki, Journal of Chemical Engineering of Japan, vol. 47(7), pp. 569-573, 2014.8
5. “Development of inorganic silica reverse osmosis membranes by using a counter diffusion chemical vapor deposition method”, Ayumi Ikeda, Emi Matsuyama, Makoto Komatsuzaki, Misa Sasaki, Mikihiro Nomura, Journal of Chemical Engineering of Japan, vol. 47(7), pp. 574-578, 2014.8
6. “Preparation of silica RO membranes by using a counter diffusion chemical vapor deposition method”, Ayumi Ikeda、 Emi Matsuyama、Ryo Tanahashi、Kyota Shimazaki、Misa Sasaki、 Mikihiro Nomura, Chemical Engineering Series, vol.3, pp. 447-452, 2014.2
7. “High temperature CO2 separation through silica hybrid membranes”, Mikihiro Nomura、 Emi Matsuyama, Ayumi Ikeda, Ryo Tanahashi、Kyota Shimazaki, Misa Sasaki, Chemical Engineering Series, vol.3, pp. 453-457, 2014.1
8. “Hydrogen permselective silica hybrid membranes prepared by a novel CVD method”, Mikihiro Nomura, Keita Monma, Emi Matsuyama, Sayuka Kimura, Ryo Miyake, Keisuke Utsumi, Transactions of the Materials Research Society of Japan, vol.36(2), pp. 209-212, 2011.6
9. “Preparation of silica hybrid membranes for high temperature gas separation”, Mikihiro Nomura, Keita Monma, Yoshio Negishi, Emi Matsuyama, Sayuka Kimura, Desalination and Water Treatment Science and Engineering, vol.17, pp. 288-293, 2010.5
85