JAPANESE JOURNAL OF
TROPICAL MEDICINE AND HYGIENE
JAPANESE SOCIETY OF TROPICAL MEDICINE
日 本 熱 帯 医 学 会
第3 0巻 第3号 平成1 4年9月
内 容
原 著
ジンバブエ国における流行期のマラリア発生数に及ぼす気象因子
門司 和彦,露岡 令子,Makunike, B.,田中 寛 ………283
Bifenthrin
とDeltamethrin
の残留噴霧がコガタハマダラカ個体群に与える影響:北部タイ・メーホンソン県における野外評価
Somsak Prajakwong, Wannapa Suwonkerd, Srisucha Chawprom, Trairat Banchong-aksorn,
津田 良夫,高木 正洋………289 熱帯地域のマレーシア住民が温帯地域の日本滞在による順化に伴なう発汗運動変異
Jeong-Beom LEE, Timothy OTHMAN, Ji-Seon LEE, Fu-Shi QUAN, Jeong-Hwan CHOI,
Young-Ki MIN, Hun-Mo YANG,松本
孝朗,小坂 光男………295静岡県三ヶ日町における有害異形吸虫の人体感染
記野 秀人,大石 久二,大野 吉夫,石黒 満………301 ブラジル東北部における小児トキソプラズマ症感染状況
小林 仁,E. Malagueño,J. V. Santana,E. P. Perez,矢野 明彦………305 北海道で採集されたブユ属アシマダラブユ亜属に属する1新種(ハエ目:ブユ科)の記載
高岡 宏行,斎藤 一三………311 北タイにおける
HBsAg
キャリアでのD
型肝炎ウイルスの血清学的分布Prapan Jutavijittum, Yupa Jiviriyawat, Amnat Yousukh, Warunee Kunachiwa,
林 茂樹,鳥山 寛………319
会報・記録
2002年度(平成14年)日本熱帯医学会会員名簿(2002年9月1日現在) ………321‐342 2002年度(平成14年)日本熱帯医学会役員名簿(2002年9月1日現在)………343 投稿規定………346 著作権複写に関する注意………348
日本熱帯医学会表紙 ! − " MK 稲 芦塚
日熱医会誌
VOL. 30 No. 3 SEPTEMBER 2002
CONTENTS
Original article
Moji, K., Tsuyuoka, R., Makunike, B. and Tanaka, H.
Meteorological factors influencing the intensity of malaria outbreak in Zimbabwe ………
283Prajakwong, S., Suwonkerd, W., Chawprom, S., T., Banchong-aksorn. Tsuda, Y. and Takagi, M.
A field evaluation study on the effects of residual spray of Bifenthrin and Deltamethrin on
Anopheles minimus population in Mae Hong Son Province, northern Thailand ………
289Lee, J-B., Othman, T., Lee, J-S., Quan, F-S., Choi, J-H., Min, Y-K., Yang, H-M., Matsumoto, T.
and Kosaka, M.
Sudomotor Modifications by Acclimatization of Stay in Temperate Japan of
Malaysian Native Tropical Subjects ………
295Kino, H., Oishi, H., Ohno, Y. and Ishiguro, M.
An Endemic Human Infection with Heterophyes nocens Onji et Nishio 1916 at Mikkabi-cho,
Shizuoka, Japan ………
301Kobayashi, M., Malagueño. E., Santana. J. V., Perez. E. P. and Yano, A.
Prevalence of Toxoplasmosis in Children in Northeastern Brazil ………
305Takaoka, H. and Saito, K.
Description of a New Species of Simulium (Simulium) from Hokkaido, Japan (Diptera: Simuliidae) …
311Jutavijittum, P., Jiviriyawat, Y., Yousukh, A., Kunachiwa, W.,
Hayashi, S. and Toriyama, K.
Short Communication: Seroprevalence of Hepatitis D virus Infection Among HBsAg
Carriers in Northern Thailand ………
319背は3mm (決定)
Jpn. J. Trop.
Med. Hyg.
JapaneseJournalofTropicalMedicineandHygieneVol.30No.3SEPTEMBER2002
METEOROLOGICAL FACTORS INFLUENCING THE INTENSITY OF MALARIA OUTBREAK
IN ZIMBABWE *
K
AZUHIKOM
OJI1, R
EIKOT
SUYUOKA2, B. M
AKUNIKE3and H
IROSHIT
ANAKA4 Accepted September, 10, 2002Abstract: Correlation between meteorological data observed at Gokwe and intensity of malaria outbreak or the
number of clinical malaria cases occurring at malaria season in whole Zimbabwe was studied. Meteorological year (Met Year) in this country starts in July at the coldest month and ends in the next June, and malaria peak season lasts from January to May. The correlation of the number of clinical malaria cases at peak season in thousand (Mp) and meteorological factors was calculated from the data in 8 years from Met Year 1990/1991 to 1997/1998.
Among single factors, correlation was highest with a total rainfall (mm) in a year (Rt) followed by that in Janu- ary (R1), in February (R2) and average temperature in August (Av8), showing the coefficients of 0.873, 0.870, 0.862 and 0.739, respectively. The adjusted R
2of the above factors were 0.722, 0.717, 0.700 and 0.470, respec- tively, where Av8 was non significant statistically. In two meteorological factors, the correlations higher than a sin- gle factor were a combination of R1+R2 with an adjusted R
2of 0.792. Malaria at peak season will be increased by more rainfall in January, February and total in a year, and may be high average temperature in August. Formulae of regression lines are as follow, and by these, intensity of malaria outbreak at malaria season will be indicated.
1. Mp = 361.30×Av8 - 6,182.96 (approximation)
2. Mp = 3.12×R1+43.37 (good fit)
3. Mp = 1.82×R1+2.47×R2 - 15.02 (best fit)
4. Mp = 1.463×Rt - 323.21 (good fit for retrograde study)
Key words: Malaria, Intensity of outbreak, Meteorological factors, rainfall, Zimbabwe
I NTRODUCTION
Malaria is an important disease in Zimbabwe, even if its intensity of outbreaks (the number of malaria cases in a year) was reported to be hypo- or meso-endemic in nature (Taylor and Mutambu, 1986). A retrograde study on malaria outbreaks in Zimbabwe (Freeman, 1995) suggested that among meteorological factors, only temperature in Septem- ber influenced the intensity of malaria outbreaks in a year, and this analysis was reported later (Freeman and Bradley, 1996). The study was interesting and important, but no one has followed these findings later. In the above reports, a pa- rameter used for the intensity of malaria was the number of malaria cases among inpatients and outpatients at Central Hospital at Harare, the capital city of Zimbabwe where no malaria occurs at altitude of 1,450 m. The meteorological
data were referred to the weather station at the same city.
There is a question whether the number of patients in a hos- pital coming from malarious areas outside of the City, and meteorological survey data at its neighbour actually repre- sented the intensity of malaria outbreaks in this country and climate of malarious areas, respectively. The present authors attempted to make clear the relationship between climate and the intensity of malaria outbreak using more direct pa- rameters.
M ATERIALS A ND M ETHODS
For the intensity of outbreaks, monthly incidence of clinical malaria cases reported by rural health centres was used. The meteorological data in the malarious area were collected, and a set of nearly complete data was found at
Jpn. J. Trop. Med. Hyg., Vol.30, No.3,2002, pp.283‐287
1 School of Allied Medical Sciences, Nagasaki University, Sakamoto 1-7-1, Nagasaki 852-8520, Japan
2 Department of Medicine and Clinical Science, Kyoto University Graduate School of Medicine, Kyoto 606-8507, Japan
3 Director, Department of Epidemiology and Disease Control, Ministry of Health and Child Welfare, Kaguvi Bld. P.O. Box CY1122, Causeway, Harare, Zimbabwe
4 Professor Emeritus, Institute of Medical Science, the University of Tokyo. (Home Address) 19-9 Izumi-honcho 2, Komae City, Tokyo 201-0003, Japan
*This study was performed as a part of activities of MOHCW-JICA Project on Infectious Disease Control in Zimbabwe supported by Japan In- ternational Cooperation Agency.
283
Gokwe Town and was taken into consideration in this study.
As the season of malaria transmission is a period from January to May in this country, the malaria peak occurs at the beginning of a calendar year. The study of influence of climate to the intensity of outbreak in a calendar year was considered to be inappropriate since meteorological factors after malaria season had no influence to the preceding ma- laria outbreak.
By chance, referring to the records of meteorological surveys in this country, the Meteorological Year (Met Year) has already been defined in starting in July, the coldest month, and ends in the next June. Since the malaria season comes at the last part of the Met Year, use of this calendar was found to fit our purpose.
The meteorological factors defined in this country and referred to the present study are rainfalls measured by mm, and average, maximum and minimum temperatures at de- gree Celsius in each month.
Monthly occurrence of all clinical malaria cases de- tected in the rural health centres in Zimbabwe was collected in 8 years from Met Year 1990/1991 to 1997/1998. Then correlation coefficients (r) were calculated between a total number of clinical malaria in a Met Year and corresponding meteorological factors such as average, maximum and mini- mum temperatures, and rainfalls in every months.
The coefficients were not so high with any factors of climate. Comparatively higher coefficients are shown in the maximum temperature in June, rainfalls in January and in December where the coefficients (r) were 0.774, 0.766 and -0.748, respectively, at risks between 5% and 1%. Although the coefficients were significant, they were not satisfactorily high, and rainfall in December showed negative correlation.
The meaning of preliminary study was not readily under- stood.
Then, another modification was given to the number of malaria cases under an assumption that any meteorological factors before malaria season might influence the number of malaria cases at the high transmission period form January to May (peak season). The numbers of malaria cases at peak season were calculated by each Met Year, and correlation coefficients between meteorological factors and the inten- sity of outbreaks were calculated to find out what factors were more influential to malaria outbreaks.
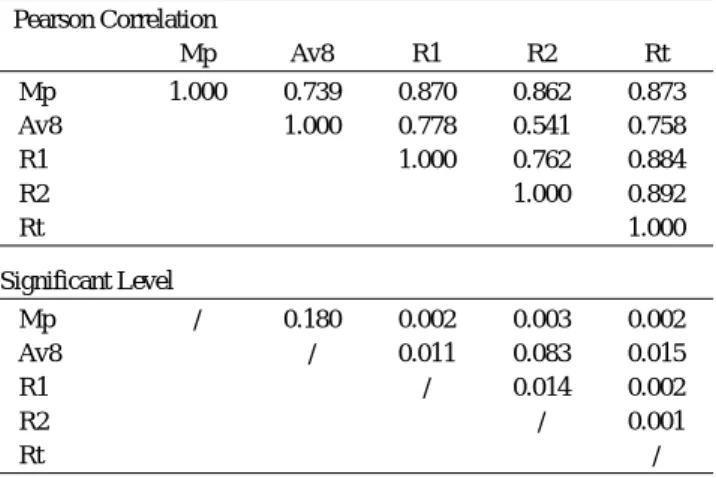
The correlation coefficients of each meteorological factor to the intensity of malaria outbreak, and their signifi- cant levels are shown in Table 1. The meteorological factors showing the coefficient (r) higher than 0.7 were the average temperature in August, rainfalls in January and February, and a total rainfall in a Met Year with such high coefficients as 0.739, 0.870, 0.862 and 0.873, respectively, at risks of <
1% except the average temperature in August (Table 1).
Rainfalls were generally more influential to the malaria out- break than the temperature.
The important figures of meteorological data and ma- laria occurrence at peak season in 8 years are listed up in Table 2, and the regression line analysis was made based on this table.
R ESULTS
Single meteorological factors: The formulae of regres- sion lines obtained by each of single factors are as follows;
1. Mp = 361.30 × Av8 - 6182.96
where Mp is no. of clinical malaria in thousand at peak sea- son, and Av8is the average temperature at degree Celsius in August.
2. Mp = 3.12 × R1+43.37
Table 1 Pearson correlation calculated by multi- regression analysis and their significant levels
Pearson Correlation
Mp Av8 R1 R2 Rt
Mp Av8 R1 R2 Rt
1.000 0.739 1.000
0.870 0.778 1.000
0.862 0.541 0.762 1.000
0.873 0.758 0.884 0.892 1.000 Significant Level
Mp Av8 R1 R2 Rt
/ 0.180
/
0.002 0.011 /
0.003 0.083 0.014
/
0.002 0.015 0.002 0.001 /
Table 2 Observed data of important meteorological factors in 8 years and the number of clinical malaria cases at trans- mission season used for regression line analyses.
Met Year Mp
Y
Av8 X1
R1 X2
R2 X3
Rt X4 1990/1991
1991/1992 1992/1993 1993/1994 1994/1995 1995/1996 1996/1997 1997/1998
308.16 172.54 657.74 421.78 363.17 1,186.58 1,138.05 1,169.84
18.2 19.3 18.2 18.2 18.3 20.4 19.6 19.7
165.8 106.0 81.3 187.4 70.4 333.2 354.0 328.4
74.2 14.3 156.1 146.4 40.4 251.7 207.6 149.7
489.0 526.7 639.9 637.0 329.6 1,005.0 1,069.0 775.1 Met Year; Meteorological year
Mp; Malaria cases at peak season in thousand Av8; Average temperature in August R1; Rainfall in January
R2 Rainfall in February Rt Total rainfall in a Met Year 284
where R1 is rainfall in January in mm.
3. Mp = 4.49 × R2+92.75 where R2 is rainfall in February.
4 . Mp = 1.463×Rt - 323.21
where Rt is the total rainfall in a Met Year.
Using the above 4 formulae, estimation of the intensity of malaria outbreaks at peak season in the same Met Year is described with r
2and adjusted R
2in Table 3. The figure r
2tends to fit optimistically how well the estimate fits the ob- served figure. Adjusted R
2attempts to correct r
2to more closely reflect the goodness of fit. The correlation coeffi- cient (r) of each model was considered here as the coeffi- cient in the multiple regression analysis (R) when only one dependent variable is used. The fit of calculated figures to the observed ones of malaria cases is better in the order of a total rainfall in a year, monthly rainfalls in January and Feb- ruary, and average temperature in August, according to ad- justed R
2(Table 3).
Multiple meteorological factors: Multiple regression analyses and ANOVA were performed using the Statistical Package for the Social Sciences (SPSS; SPSS Inc., Chicago, IL, USA) to calculate formulae of regression lines using the above mentioned 4 meteorological factors. All the 4 factors were entered first to the model, and factors were removed one by one from the model according to the backward method. All the formulae are presented with multiple re- gression coefficient (R), adjusted R
2, F-value of the result of ANOVA, and its probability.
The formulae using all 4 meteorological factors are as follows:
a. Mp =-0.45 × Rt+3.39 × R2+1.39 × R1+141.59 × Av8 - 2425.55
(R=0.936, Adjusted R
2=0.712, F=5.33, p=0.10)
Then the total rain was removed first from the model:
b. Mp = 2.62 × R2+1.13 × R1+108.67 × Av8 - 1955.79 (R=0.933, Adjusted R
2=0.774, F=8.98, p=0.03) Average temperature of August was removed next from the model.
c. Mp = 2.47 × R2+1.82 × R1 - 15.02
(R=0.923, Adjusted R
2=0.792, F=14.34, p=0.008) Finally, R2 was removed and R1remained in the formula d. Mp = 3.12 × R1+43.37
(R=0.870, Adjusted R
2=0.717, F=18.71, p=0.005) Estimation by formulae using more factors is usually con- sidered to be closer to the observed figures, but the adjusted R
2is largest in formula c, using 2 meteorological factors, R 1 and R2. This was presumably caused by only 8 sets of the corresponding meteorological data and observed malaria cases in 8 Met Years.
Two meteorological factors: The formulae constructed by two meteorological factors, other than formula c, are shown below in the order of larger adjusted R
2.
e. Mp = 3.41 × R2+188.39 × Av8 - 3343.9
(R=0.921, Adjusted R
2=0.786, F=13.94, p=0.009) f. Mp = 1.62 × R1+0.80 × Rt - 194.77
(R=0.898, Adjusted R
2=0.729, F=10.41, p=0.017) g. Mp = 2.13 × R2+0.85 × Rt - 182.78
(R=0.892, Adjusted R
2=0.714, F=9.74, p=0.019) h. Mp = 1.23 × Rt + 88.84 × Av8 - 1852.2
(R=0.881, Adjusted R
2=0.686, F=8.66, p=0.024) i. Mp = 2.68 × R1+76.30 × Av8 - 1316.86
(R=0.876, Adjusted R
2=0.673, F=8.22, p=0.026) There was no combination of 2 factors to elevate R
2figure than the above formula c involving R1and R2.
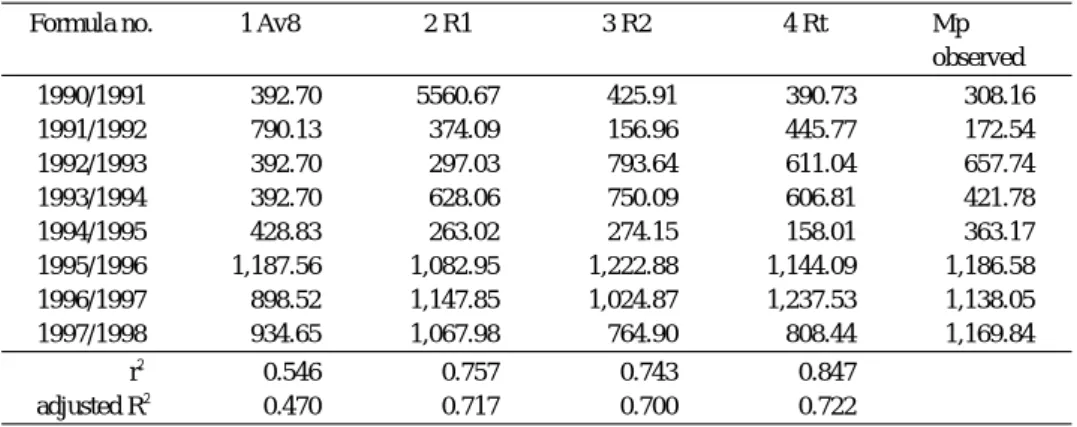
Table 3 Calculated estimation of malaria cases by single factorial formulae and observed figures at each peak season
Formula no. 1 Av8 2 R1 3 R2 4 Rt Mp
observed 1990/1991
1991/1992 1992/1993 1993/1994 1994/1995 1995/1996 1996/1997 1997/1998
392.70 790.13 392.70 392.70 428.83 1,187.56 898.52 934.65
5560.67 374.09 297.03 628.06 263.02 1,082.95 1,147.85 1,067.98
425.91 156.96 793.64 750.09 274.15 1,222.88 1,024.87 764.90
390.73 445.77 611.04 606.81 158.01 1,144.09 1,237.53 808.44
308.16 172.54 657.74 421.78 363.17 1,186.58 1,138.05 1,169.84 r2
adjusted R2
0.546 0.470
0.757 0.717
0.743 0.700
0.847 0.722
285
Estimation of intensity of malaria at peak: The above mentioned formulae can be utilised for obtaining approxi- mate estimation of intensity of malaria outbreak in a Met Year (Table4). Useful formulae among all are the formula 1, 2, c and e with statistical significance. In early September, using Av8, the first approximation is available (Formula1, adjusted R
2= 0.470 without statistical significance). Then in early February, an estimation is made by using R1 (Formula 2, adjusted R
2= 0.717). Then in early March, better estima- tion is available using R1 and R2 (Formula c, adjusted R
2= 0.792). The total rainfall in a Met Year also showed a high correlation (adjusted R
2= 0.722) which can be used for a retrograde study. When the malaria data and meteorological data are accumulated more in the future, the reliability of the above proposed formulae will be examined for their goodness of fit, and also the formulae using more parame- ters may predict the intensity of malaria outbreak precisely.
D ISCUSSION
The reliability of meteorological factors which influ- enced quantitatively the intensity of malaria outbreaks with highly statistical significance, can be extended to their rela- tionships in the future. It means that the above formulae with highly statistical significance are useful for estimating the intensity of outbreaks in the future. Another issue in this study is a value of clinical malaria cases since proven ma- laria cases are not available in field health stations. However, at malaria peak season, high ratio of proven malaria is in- volved in clinical malaria, whereas in the other seasons, proven ones are involved only at around 5%.
In the present study, the rainfall was more influential to the intensity of malaria outbreak, and this finding was different from the results by Freeman and Bradley (1996)
who gave an importance only to the temperature in Septem- ber, although some meaning was given also to the tempera- ture in August with a low significance in this study. Impor- tant results in this study are to point out the value of rainfall in January, February and a total of the Met Year by highly statistical significance, and their values will be consistent in the future.
The estimation of malaria occurrence, however, was changed much by the month of calculation in the same year.
For example in Met Year 1991/1992 (Table 4), the estimated figure of malaria was comparatively high, but it was cor- rected to a lower level by less rain in January (Table 2) and further by drought in February (Table 2).
The results obtained herein gave an acceptable under- standing of the physical influence of climate to the vector Anopheles. A higher temperature in August, possibly in September too, at the early spring in this country may en- hance the start of hatching of the vector mosquitoes, and de- velop larvae to make larger population at the starting point of vector proliferation and increase the outbreak. The rain- falls in January and February also stimulate the growth of vector population. On the contrary, even if the estimate in September is large, the transmission will be suppressed by less rain in January and February. We are grateful, if this short note stimulates the interest of workers who will make better and precise correlations between meteorological fac- tors and intensity of malaria outbreaks, leading to a better forecast.
A CKNOWLEDGMENTS
We appreciate very much to Dr. B. Piotti and Mr. Taka- manya of Division of National Health Information System in Ministry of Health and Child Welfare for submitting Table 4 Calculated estimation of malaria cases by single- and bi-factorial formulae
Time of estimation
Sep. Feb. Feb. Mar. Mar.
Mp Observed
Formula no. 1 2 i c e
1990/1991 1991/1992 1992/1993 1993/1994 1994/1995 1995/1996 1996/1997 1997/1998
392.70 790.13 392.70 392.70 428.83 1,187.56 898.52 934.65
560.67 374.09 297.03 628.06 263.02 1,082.95 1,147.85 1,067.98
516.14 439.81 289.68 574.03 268.10 1,132.64 1,127.34 1,066.36
470.01 213.22 518.51 687.66 212.90 1,213.10 1,142.03 952.43
337.82 340.79 617.10 584.02 241.40 1,357.55 1,056.46 877.86
308.16 172.54 657.74 421.78 363.17 1,186.58 1,138.05 1,169.84
adjusted R2 0.470 0.717 0.673 0.792 0.786
Formula 1; involves Av8
2; R1
i; Av8, R1
c; R1, R2
e; Av8, R2
or or
286
monthly occurrence of clinical malaria cases, and to Mrs.
Chipindu, Mrs. Kasehe and Mrs. Chiramba of the Meteoro- logical Station at Harare and to Mr. Shambare of WHO, Southern African Inter-country Office for providing mete- orological survey data.
R EFERENCES
1)Freeman, T. (1995): Malaria, Zimbabwe, 1995. GTZ pp.
69 (Report to MOHCW)
2)Freeman, T. and Bradley, M (1996): Temperature is pre-
dictive of sever malaria years in Zimbabwe. Trans. Roy.
Soc. Trop. Med. Hyg., 90, 232
3)
Taylor, P and Mutambu, S. L. (1986): A review of the ma- laria situation in Zimbabwe with special reference to the period 1972-1981. Trans. Roy. Soc. Trop. Med. Hyg., 80, 12-19
287
A field evaluation study on the effects of residual spray of Bifenthrin and Deltamethrin on Anopheles minimus population in Mae Hong Son Province, northern Thailand.
S
OMSAKP
RAJAKWONG1), W
ANNAPAS
UWONKERD1), S
RISUCHAC
HAWPROM1), T
RAIRATB
ANCHONG-
AKSORN1), Y
OSHIOT
SUDA2)*and M
ASAHIROT
AKAGI2)Accepted September, 10, 2002
Abstract: A field study was conducted to evaluate the effects of indoor residual house spraying of Bifenthrin and
Deltamethrin on malaria vector population of Anopheles minimus s.l., from April 1999 to April 2001 at rural vil- lages in Mae Hong Son province, northern Thailand. Nine villages in Mae Hong Son province were selected for the present study (three villages for control and three villages each for insecticide spray). The residual spray of Bifen- thrin (25 mg/m
2) showed greater adulticiding effects on An. minimus s.l. population than Deltamethrin (20 mg/m
2).
In Bifenthrin treated villages, a clear decrease in biting density of An. minimus s. l. was found in human bait col- lection as well as animal bait collection after the insecticide spray. In all of the three villages, the average density after insecticide spray was significantly lower than that observed before the spray. The effects of Deltamethrin on
An. minimus s. l. density was found only in one village out of the three treated villages. A significant decrease inparous rate after insecticide spray was found in all the villages sprayed with Bifenthrin, whereas no significant changes were observed in control villages. The average parous rate in the villages treated with Deltamethrin be- came significantly higher after the insecticide spray. These results clearly suggested that the residual spray of Bifenthrin (25 mg/m
2) was more effective than Deltamethrin (20 mg/m
2).
Key words: residual spray, Bifenthrin, Deltamethrin, Anopheles minimus, Thailand
I NTRODUCTION
The malaria control program in Thailand was started in 1950’s and has resulted in an impressive reduction in ma- laria morbidity and mortality. For more than 40 years, DDT has been used in the malaria control program for indoor re- sidual spraying throughout Thailand. However, the use of DDT for malaria control in Thailand has been decreasing from 1980’s and nearly stopped recently because of the de- velopment of insecticide resistance in vector populations against DDT and the side effects of DDT spraying on the environment through the biological concentration (Malikul, 1988; Curtis, 1994; Chareonviriyahpop et al., 1999).
The screening of insecticide alternative to DDT has be- come an important subject for malaria control in Thailand, since insecticide spraying is still the most effective control measure to stop the malaria transmission, especially during its epidemic. Several field studies have been carried out re- cently in Thailand on the effectiveness of insecticide in ma- laria vector control (Photijitthi et. al., 1999; Prajakwong et.
al., 1997ab; Somboon et. al., 1995; Vongprayoon et. al., 1999, Suwonkerd et. al, 1997). Bifenthrin is a newly syn- thesized pyrethroid and the effectiveness has been studied preliminary in the Office of Vector Borne Diseases Control 2 (VBDO2), Chiangmai, Thailand in 1998. Based on the re- sults of the preliminary study, the present study was con- ducted to compare the effects of indoor residual house spraying of Bifenthrin and Deltamethrin on malaria vector population of Anopheles minimus s.l., from April 1999 to April 2001 at rural villages in Mae Hong Son province, northern Thailand.
M ATERIALS AND M ETHODS
Study area: Mae Hong Son province is located at the Thai-Myanmar border in northwestern Thailand, and the in- cidence of malaria in the province is the highest in the up- per northern part of Thailand (VBDO2, 1999). Nine vil- lages in Mae Hong Son province were selected for the pre- sent study. The total number of houses, population, percent-
Jpn. J. Trop. Med. Hyg., Vol.30, No.3,2002, pp.289‐293
1)Office of Vector Borne Diseases Control 2, 18 Boonruangrit Rd., Muang District, Chiangmai 50200, Ministry of Public Health, Thailand
2)Department of Vector Ecology & Environment, Institute of Tropical Medicine, Nagasaki University, Sakamoto1-12-4, Nagasaki 852-8523, Ja- pan
*Present address: Department of Medical Entomology, National Institute of Infectious Diseases, Toyama1-23-1, Shinjuku-ku, Tokyo 162-8640, Japan
289
age of houses having a bed net and average surface area to be sprayed in each village were shown in Table 1. Three vil- lages each were sprayed with insecticide (Bifenthrin or Deltamethrin) and remaining 3 villages were left without insecticide spraying (control villages).
Insecticide application: Insecticide was applied two times in April and August 2000. Bifenthrin 25 mg/m
2or Deltamethrin 20 mg/m
2was applied to the inside wall of household by using Hudson X-pert hand compression pumps with flat fan 8002 nozzles. The actual dosage of in- secticides applied on the wall was checked by WHO (Head Quarter in Geneva, Switzerland) by processing the filter pa- pers (Whatman No.1) placed on a wall before the insecti- cide spraying.
Evaluation of the effect of insecticide spray on vector mosquitoes: The following two different methods were used for evaluating the effects of insecticide spray on vector mosquitoes; (1) survey of wild vector populations and (2) surface contact bioassay.
The wild vector population was surveyed monthly in each village by using an indoor and outdoor human bait collection and animal bait collection. Four houses in each village were selected and a pair of collector sat inside and outside of the houses. Landing mosquitoes were collected for 50 min with a 10 min of break interval from 18:00 to 24:00. For the animal bait collection a cow was tethered in- side a gauze net (4 by 4 by 2 m), which was similar to the one described by Service (1993). One collector aspirated mosquitoes landing in and out of the net at every 15 min from 18:00 to 24:00. The collected mosquitoes were kept in a plastic cup hourly for the later identification. During the mosquito collection relative humidity and temperature were recorded. Among female An. minimus s. l. collected from human bait collection, at least 50 unfed females were dis- sected for the parity check (Detinova, 1962) and were checked for malaria sporozoite in salivary glands.
The surface contact bioassay test (WHO, 1975) was carried out monthly after the1st insecticide application. One house in the sprayed villages was selected for the test. Five different places on the inside wall was marked and used for the insecticide exposure test. Twenty females of 3-5 day-old An. minimus s. l. laboratory strain (Mae Hong Son strain) were aspirated into each cone, and totally 100 females were used for each test. The females were exposed to sprayed surface for 30 min, and the number of dead and knocked down mosquitoes were counted at the end of exposure. The number was counted again after 24 hr. Abbot’s correction was applied to calculate mortality rate based on the mortal- ity rate of control group.
Data analysis: The average density of An. minimus s.
l. was calculated for two periods, before and after the insec-
ticide spraying, and the significance of the difference was tested by the t-test. The difference in parous rate was ana- lyzed by ANOVA or the t-test after made the arcsine trans- formation. For the statistical analysis of the surface contact bioassay test, the study period was divided into 3 periods of 4 month, and the average mortality was calculated and com- pared after the arcsine transformation. Variation in tempera- ture and humidity among village was analyzed by ANOVA, and Tukey’s HSD test was used for a pair wise comparison of means. All statistical analysis was performed by using Systat statistical software (Wilkinson, 1996).
R ESULTS A ND D ISCUSSION
Coverage of indoor insecticide spraying and climate conditions during the study: The percentage of houses sprayed with insecticide in this study was shown in Table 1.
The coverage of insecticide spray reached more than 89%
of the total houses, except for one village, Pong Kan Nai where the coverage was 79.1 and 80.6% at1st and2nd insec- ticide spray, respectively. Houses without resident or re- fused by house owner were not treated with insecticide.
Significant differences in humidity were observed among the study villages (F=5.401, p<0.001, Table 1). The average humidity recorded in the villages selected for Bifenthrin spray were significantly lower than other villages, while no significant differences were found for temperature among villages (F=1.116, p=0.353).
Effects of insecticide application on wild population of An. minimus s. l.: A total of 80,662 anopheline of 22 species were collected in the present study. Among them 30,340 and 98 were morphologically identified as An. mini- mus s.l. and An. dirus s.l. respectively, clearly showing that An. minimus s.l. was the most important malaria vector in the study villages. A total of 12,600 An. minimus s.l. were dissected for the detection of malaria sporozoite in the sali- vary gland and all of them were negative.
Table 2 compares the average density of An. minimus s.
l. before and after the insecticide spray. The residual spray of Bifenthrin showed greater effects on An. minimus s.l.
population than Deltamethrin. The seasonal changes in An.
minimus s.l density observed before the insecticide spray was similar to that reported in previous papers (Ismail et al., 1974; Ismail et al., 1975; Suwonkerd et al., 1995; Takagi et al., 1995; Suwonkerd et al., 1997). However, in Bifenthrin treated villages a clear decrease in biting density of An.
minimus s. l. was found in human bait collection as well as animal bait collection after the insecticide spray. In all of the three villages, the average density after the insecticide spray was significantly lower than that before the spray (t- test, p<0.05).
290
The effects of Deltamethrin on An. minimus s. l. den- sity was found only in one village (Sao Tao) out of three villages. The average biting density on human bait was sig- nificantly reduced after the insecticide spray, whereas in animal bait collection it showed significant increase after the insecticide spray (t-test, p<0.05).
No significant increase or decrease was found in biting density of An. minimus s. l. in control villages.
The average parous rate of mosquitoes was calculated for each village and compared before and after the insecti- cide spray in Table 3. A significant decrease in parous rate after insecticide spray was found in all the villages sprayed with Bifenthrin, whereas no significant changes were ob- served in the control villages. The average parous rate in the
Table 1. Demographic parameters, climate conditions and results of insecticide application at each study village in Mae Hong Son, northern Thailand.
Village
Tong Muang Pakolo Huey
Pong On Pong Kan Nai Sao Tao Chang
Chum Mai Sape Huey
San Nok Tobsok Number of houses
Population
49 141
52 181
82 304
61 326
136 556
101 410
92 426
36 119
74 276 Average (±sd) temperature
during the study* 25.0a±4.0 24.3a±3.4 23.6a±4.8 23.9a±4.1 25.3a±3.1 23.4a±3.4 23.1a±3.9 24.7a±3.2 25.2a±2.7 Average (±sd) humidity
during the study* 68.8bc±8.8 68.8c±8.2 67.6c±7.8 75.8ab±13.3 77.9ab±9.6 79.1ab±9.1 76.2ab±7.3 77.5ab±6.6 80.2a±17.3
% houses having a bed net 93.8 98.0 85.2 100 87.5 93 93.5 86.1 87.8
Average surface to be
sprayed (m2)/house 163.8 206.2 175.6 198.9 280.9 266.9 184.8 247.8 223.8
Insecticide sprayed Bifenthrin Deltamethrin No spray
% houses sprayed**
1st application 2nd application
92.6 92.3
96.4 93.3
90.2 89.4
79.1 80.6
91.6 92.8
94.9 92.8
−
−
−
−
−
−
*Averages in the same row followed by the same letter were not significantly different (Tukey’s HSD test, p>0.05).
**1st application = 24-27 April 2000; 2nd application = 23-25 August 2000.
Table 2. Comparisons of average density (±sd) of An. minimus s. l. observed before and after the insecticide spray in Mae Hong Son, northern Thailand from April 1999 to April 2001.
Village Indoor Collection Outdoor Collection Animal bait Collection
Before spray After spray p Before spray After spray p Before spray After spray p Bifenthrin sprayed village
Tong Muang Pakolo Hueypong On
43.1±34.7 84.8±74.1 18.5±18.6
3.5±3.5 11.3±9.6 0.8±1.4
<0.001
<0.001
<0.001
73.7±40.4 183.3±150.6
43.0±43.0
18.9±11.0 82.4±88.6 11.1±11.9
<0.001 0.039 0.006
10.1±13.0 37.2±54.1 15.4±26.7
0.3±0.7 2.9±8.1
0
0.004 0.012
− Deltamethrin sprayed village
Pong Kan Nai Sao Tao Chang Chum
68.7±87.9 32.1±24.9 68.6±56.8
91.4±162.6 5.0±3.5 47.8±67.8
0.719
<0.001 0.458
176.6±211.7 67.6±44.8 168.1±133.7
193.8±254.7 22.6±12.4 113.5±114.6
0.870
<0.001 0.296
33.3±45.4 0.3±0.9 3.2±3.9
39.5±36.4 7.8±8.0 29.5±35.8
0.711 0.034 0.076 Control village
Tob Sok Mai Sa Pe Huey San Nok
8.0±8.8 2.0±3.7 10.8±16.5
14.3±6.7 8.62±11.0 62.4±53.8
0.069 0.141
<0.001
38.7±39.4 8.8±13.6 47.7±53.3
33.9±18.7 22.8±40.2 178.6±130.5
0.689 0.377 0.025
No data 1.2±1.6 1.7±4.6
0 1.0±2.4
0
− 0.876
−
*The insecticide was sprayed twice; 1st spray= April 2000, 2nd spray= August 2000.
Table 3. Comparisons of average (±sd) parous rate before and after the insecticide spray in Mae Hong Son, northern Thailand from April 1999 to April 2001.
Before spray After spray p Bifenthrin sprayed village
Tong Muang Pakolo Hueypong On
70.8 ±13.5 69.3 ±16.7 72.6 ±12.7
32.3 ±11.2 32.7 ±16.0 31.7 ±13.5
<0.001
<0.001
<0.001 Deltamethrin sprayed village
Pong Kan Nai Sao Tao Chang Chum
47.3 ±17.5 50.0 ±18.4 43.3 ±17.6
78.5±13.2 84.0 ±6.3 73.1 ±19.1
0.005
<0.001 0.020 Control village
Tob Sok Mai Sa Pe Huey San Nok
38.9 ±16.3 37.2 ±22.1 41.5 ±16.3
46.9 ±18.4 44.9 ±18.5 49.1 ±19.3
0.383 0.624 0.392
291
villages treated with Deltamethrin became significantly higher after the insecticide spray. No significant decrease was observed in parous rate as well as the biting density of An. minimus s.l. in a village treated with 25 mg/m
2of Deltamethrin in a previous study (Prajakwong et al., 1997a).
Results of surface contact bioassay test: The mortal- ity of adults exposed to the Bifenthrin-treated wall was al- ways higher than that found on Deltamethrin-treated wall (Table 4). The difference in mortality between Bifenthrin and Deltamethrin was significant during the 1-4 month and 5-8 month, but not during the 9-12 month (Tukey’s HSD test). The average mortality of adults exposed to a Bifenthrin-treated wall during the 1-4 month and the 5-8 month was 98.5 and 97.75, respectively, and the difference was not significant (t-test, p>0.05). However, the mortality decreased significantly to 76.75 % in the 9-12 month. On the Deltamethrin-treated wall the adult mortality was less than 80% and not significantly different between the 3 study periods (F=0.019, p=0.981), and within the first 4 months after spray, the mortality of exposed adults de- creased rapidly from 92.0 to 67 %. With a higher dosage of Deltamethrin (25 mg/m
2) than the present study (20 mg/m
2), Prajakwong et al . (1997a) observed the mortality rate of ex- posed adult An. minimus s. l. from 100-92 % during the first 3 months. The lower residual effects of Deltamethrin, because of the low dosage in this study, might be one of the reasons for the less effectiveness of Deltamethrin to An.
minimus s.l. population.
These results clearly suggested that the residual spray of Bifenthrin (25 mg/m
2) was more effective than Deltamethrin (20 mg/m
2). However, the average density of An. minimus s.l. achieved in Bifenthrin-treated villages was nearly the same level as that observed in the control villages (Table 2). Since indigenous malaria cases, in which the in- fection was acquired inside the village of residence, were reported every year from the control villages, a higher dos- age or more frequent spray of the insecticide is required to control malaria from in these villages.
Acknowledgement
We thank FMC Corporation for financial support and all field staff of Office of Vector Borne Diseases Control, Region 2, Chiangmai, Thailand for their continuous help for the field study.
R EFERENCES
1)Chareonviriyahpap, T.,Aum-aung, B. and Ratanatham, S.
(1999): Current insecticide resistance patterns in mos- quito vectors in Thailand. Southeast Asian J. Trop. Med.
Public Hlth., 30, 184-194
2)Curtis, C.F. (1994): Should DDT continue to be recom-
mended for malaria vector control? Med. Vet. Entomol., 8, 107-112
3)Detinova, T. S. (1962): Age grouping methods in Diptera
of medical importance with special reference to some vectors of malaria. WHO Monogr. Ser., 47, 216 pp., WHO, Geneva
4)Ismail, I.A.H., Notananda, V. and Schepens, J. (1974):
Studies on malaria and response of Anopheles balaba-
censis balabacensis and Anopheles minimus to DDT re-sidual spraying in Thailand. Part1. Pre-spraying observa- tions. Acta Tropica, 31, 129-164
5)Ismail, I.A.H., Notananda, V. and Schepens, J. (1975):
Studies on malaria and response of Anopheles balaba-
censis balabacensis and Anopheles minimus to DDT re-sidual spraying in Thailand. Part 2. Post-spraying obser- vations. Acta Tropica, 32, 206-231
6)Malikul, S. (1988): The current situation of the anti-
malaria programe in Thailand. Southeast Asian J. Trop.
Med. Public Hlth., 19, 355-359
7)Office of Vector Borne Diseases Control 2, Malaria Divi-
sion, Ministry of Public Health, Thailand (1999): Annual Report. 155 pp., Thai Government.
8)Photijitthi, V., Sirichaisinthop, J. and Vongprayoon, S.
(1999): Comparative study on effectiveness of Alpha- cypermethrin and Deltamethrin by indoor residual spray- ing for malaria control in Thasongyang district, Tak prov- ince. Comm. Dis. J., 25, 328-337 (in Thai with English abstract)
9)Prajakwong, S., Suwonkerd, W. and Panart, K. (1997a):
Evaluation of Deltamethrin, Lambda-cyhalothrin and etofenprox household sprays against malaria in Mae Hong Son Province, northern Thailand. Comm. Dis. J., 23, 48-56 (in Thai with English abstract)
10)Prajakwong, S., Aum-Ung, B., Suwonkerd, W. and Sri-
wisan, S. (1997b): Knowledge, attitudes and acceptance in Pyrethroid residual spray of the people in Mae Hong Son province, northern Thailand. Comm. Dis. J., 23, 153- 159 (in Thai with English abstract)
11)Service, M. W. 1993. Mosquito ecology. 2nd ed. 988 pp.,
Elsevier Applied Science, London.
12)Somboon, P., Lines, J., Aramrattana, A., Chitprarop U.,
Prajakwong, S. and Khamboonruang, C. (1995): Ento- mological evaluation of community-wide use of Table 4. Average mortality (±sd) of adult An. minimus s. l. ob-
served by the bioassay test in 3 different month periods after the insecticide spray
*.
Period after 1st
spray (month) Bifenthrin Deltamethrin p 1st spray
1-4 98.50±2.00 77.50±15.92 <0.001 2nd spray
5-8 9-12
97.75±2.91 76.75±12.24
79.75±8.94 72.75±32.01
<0.001 0.674
*The insecticide was sprayed twice; 1st spray= April 2000, 2nd spray= August 2000.
292
lambdacyhalothrin-impregnated bed nets against malaria in border area of north-west Thailand. Trans. R. Soc.
Trop. Med. Hyg., 89(3), 248-254
13)Suwonkerd, W., Prajakwong, S., Tsuda, Y. and Takagi, M.
(1997): A field study on the effects of residual spray of encapsulated fenitrothion on Anopheles minimus popula- tion in Phare Province, northern Thailand. Jpn. J. Trop.
Med. Hyg., 25, 113-115
14)Suwonkerd, W., Takagi, M., Amg-Umg, B. and Prajak-
wong, S. (1995): Seasonal and spatial distribution of 3 malaria vectors at three mountainous villages in north Thailand. Jpn. J. Trop.Med. Hyg., 23, 183-187.
15)Takagi, M., Suwonkerd, W., Tsuda, Y., Kamboonruang,
C., Chitpralop, U., Nakazawa, Kanbara, H. and Wada, Y.
(1995): Seasonal density and malaria vector competence of Anopheles minimus and other anophelines at a shallow valley in north Thailand. Jpn. J. Trop. Med. Hyg., 23, 177-182
16)Vongprayoon, S., Photijitthi, V. and Sirichaisinthop, J.
(1999): The comparative study of the efficacy of Per- methrin and Alphacypermethrin impregnated mosquito nets for malaria control in Maseramat district, Tak prov- ince. Comm. Dis. J., 25, 234-245 (in Thai with English abstract)
17)Wilkinson, L. (1996): Systat 6.0 for windows: statistics.
SPSS Inc., Chicago, IL
18)WHO (1975): Manual on practical entomology in malaria.
Part II. 191 pp., WHO, Geneva.
293
Sudomotor modifications by acclimatization of stay in temperate Japan of Malaysian native tropical subjects
J
EONG-B
EOML
EE1,3, T
IMOTHYO
THMAN2, J
I-S
EONL
EE1,3, F
U-S
HIQ
UAN1, J
EONG-H
WANC
HOI3, Y
OUNG-K
IM
IN3, H
UN-M
OY
ANG3,
T
AKAAKIM
ATSUMOTO4and M
ITSUOK
OSAKA5 Accepted September, 14, 2002Abstract: Tropical subjects regulate core temperature with less amount of sweat against heat compared to temper-
ate subjects through long-term heat-acclimatization. The purpose of the study is to determine whether acclimatiza- tion in tropical subjects decay during a stay in temperate area. Local sweating response activated by acetylcholine (ACh) applied iontophoretically among Malaysians (n=26) with varying duration of stay in Japan and Japanese residents subjects (J-R n=30). Based on their length of stay, Malaysian subjects were divided into three groups, group M-S (n=9) with a duration of stay of1to 12 months, M-M (n=7) with 13 to 36 months and M-L (n=10) with 37 to 72 months. ACh, the primary transmitter for sudomotor innervation, was iontophoretically administered on the forearm. Sweating response elicited directly (DIR) and indirectly via axon reflex (AXR) were evaluated by quantitative sudomotor axon reflex test. The onset-time of AXR was shortened with the longer duration of stay among Malaysian subjects (P <0.01). DIR, sweat volume directly (ACh muscarinic receptors) induced by ACh for 6-11 min, was 0.68±0.35 mg/cm
2, 1.02±0.64 mg/cm
2, 1.45±0.71 mg/cm
2and 2.39±0.47 mg/cm
2in M-S, M-M, M-L and J-R, respectively. These were statistically different (P <0.01). From these results, suppressed neuroglandu- lar response to ACh was confirmed in Malaysians. It is suggested that long-term heat-acclimatization acquired in tropical subjects may decay after immigration to temperate area.
Key words: long-term heat-acclimatization, deacclimatization, sweating response to ACh, Malaysians, Japanese.
I NTRODUCTION
Sweating is a mechanism of heat dissipation for hu- mans when exposed to a hot environment. It is known that sweating response to heat is influenced by climatic condi- tion. Heat-tolerance is achieved by the lowering of thresh- old for sweating and enhanced sweating in short-term accli- mation (Nadel et al., 1974, Ogawa and Sugenoya, 1993). In an area where there is a distinct seasonal fluctuation of am- bient temperature like Japan, various physiological re- sponses may change season by season. During summer, the sweat rate is higher, with a shorter latent period for sweat onset and lower salt concentration in sweat than in winter (Kuno, 1956; Yoshimura, 1960; Hori et al., 1976; Sugenoya et al., 1995). It is generally accepted that tropical natives having acclimatized to heat for a long time begin to sweat more slowly than temperate natives and the salt concentra- tion in sweat in the former is much lower than in the latter
(Kuno, 1956; Yoshimura, 1960; Hori et al., 1976; Ohwatari et al., 1983; Sasaki and Tsuzuki, 1984; Lee et al., 1999).
On the contrary, tropical inhabitants show heat- tolerance with suppressed sweating (Kuno, 1956; Ogawa and Sugenoya, 1993; Matsumoto et al., 1993; Lee et al., 1997; Matsumoto et al., 1997). Adaptation to temporary ex- posure to heat and acclimatization to tropical climate by permanent residents were distinguishable from each other (Kuno, 1956). The thermotolerance with suppressed sweat- ing and enhanced dry heat loss is more predominant than that with enhanced sweating which is seen in short-term heat acclimatization from the view points of body fluid maintenance and osmoregulation (Lee et al., 1997; Matsu- moto et al., 1997).
The natives in torrid zone have the capacity to sweat but have acquired an ability to avoid excessive sweating by acclimatization (Kuno, 1956). For settlers of less than 3 years, the sweat reflex is similar to that of newcomers. It
Jpn. J. Trop. Med. Hyg., Vol.30, No.3,2002, pp.295‐299
1Department of Immunology, Medical College of BK21 Biomedical Sciences, Korea University, Seoul 136-705, Korea
2Department of Pediatrics (Division of Pediatric Endocrinology), Yale University School of Medicine, 464 Congress Avenue, New Haven CT 06520
3Department of Physiology, College of Medicine, Soonchunhyang University, 366-1, Ssang yong-dong, Chenan 330-090, Korea Corresponding
4The 2nd Department of Physiology, Aichi Medical University, School of Medicine, Nagakute, Aichi 480-1195, Japan
5Department of Environmental Physiology, Graduate School of Physical Science, Chukyo University, Toyota 470-0393, Japan
295
has been suggested that more than 6 years of residence in the tropics is necessary to acquire the same capacity as the natives (Kuno, 1956).
An upward shift of threshold core temperature for sweating and decrease in acetylcholine (ACh)-sensitivity of the sweat glands were reported in Thai subjects and Afri- cans. It has been suggested that sudomotor mechanisms is down-regulated both centrally and peripherally in tropical natives (Lee et al., 1997; Matsumoto et al., 1997). In this study to clarify the deacclimatization process of heat- acclimatized tropical subjects through residence in temper- ate zone, local sweating response activated by ACh applied iontophoretically was compared between Malaysians who stay in Japan for a certain period of time and Japanese per- manently staying in Japan under a thermoneutral condition.
M ATERIALS A ND M ETHODS Subjects
Experimental subjects were 56 young sedentary adults male, 26 Malaysians and 30 Japanese between 19-34 years of age with similar physical activity levels. There were sig- nificant differences in weight and height (P <0.01). Based on the length of stay in Japan, Malaysian subjects (n=26) were divided into 3 groups, M-S (n=9) with a duration of stay of 2 to 12 months, M-M (n=7) with 13 to 36 months and M-L (n=10) with 37 to 72 months. Japanese subjects (J- R, n=30) were students and staff of Nagasaki University.
Physical characteristics of the subjects were as shown in Ta- ble1. Malaysia (3° 80’ N, 101° 42’ E) is located in a tropical zone with dry and wet-seasons with minimal seasonal vari- ations. Annual mean ambient temperature is 26.7° C and relative humidity of 81%. Nagasaki (32° 44’ N, 129° 52’ E) is located in a temperate zone with hot summers and cold winters; 16.7° C and 72% relative humidity. The subjects gave informed consent after having been acquainted with the potential risks associated with experimental procedures.
We paid great attention to the subjects in accordance with Helsinki Declaration of 1975.
Measurements and procedures
The experiment was carried out in a controlled cli- matic chamber at 24.0±0.5° C with relative humidity of 40
±3% and less than 1 m/sec air velocity at 2-5 pm. Prior to the test, subjects were dressed lightly and were rested in the climatic chamber for 60 min. Quantitative sudomotor axon reflex test, QSART (Low et al., 1983; Kihara et al., 1993;
Lee et al, 1997; Chemali et al., 2001) was performed to quantitatively evaluate glandular ACh-sensitivity. The QSART capsule consists of three concentric compartments.
ACh iontophoretically applied stimulates the underlying
sweat glands in the outer compartment directly while the glands of the skin in the central compartment of the capsule are activated indirectly via axon reflex. Both direct (DIR) and axon reflex-mediated (AXR) sweat responses were measured. Two sets of QSART capsules were attached on the volar aspect of the forearm with rubber bands, one at the mid portion between the wrist and elbow joint and another at 10 cm proximal to the former. The outer compartment of the former capsule was filled with 10% ACh (Ovisot, Dai- ichi Pharmaceutical Co., Ltd., Japan) solution. A direct cur- rent of 2 mA was applied for5min between an electrode on the ACh cell (anode) of the capsule and a flexible plate- electrode (HV-BIGPAD, Omron, Kyoto) (cathode) attached on the forearm skin just proximal to the wrist joint. The central compartment of the ACh capsule served as the site for sudomotor axon reflex, AXR(1), measurement during the 5 min of iontophoresis. Immediately after the cessation of the current loading, sweat capsules were detached, the skin covered with ACh capsule was wiped up and then the two capsules positions were exchanged. This procedure took less than 20 sec. The data was acquired for another5 min to permit the simultaneous observation of DIR and AXR(2) sweating (Lee et al., 1997).
Sweat onset-time, latent period for sweating after cur- rent loading, and sweat volume for 5 min, area under the sweating curve, 0-5 min for AXR(1) and 6-11 min for AXR (2) and DIR were used for analysis. Sweat rates were meas- ured by the capacitance hygrometer-ventilated capsule method (Matsumoto et al., 1993; Lee et al., 1999). In brief, nitrogen gas flowed into each compartment with a constant flow rate of 0.3 L/min, and the change of relative humidity of effluent gas was detected by a hygrometer (H211, Tech- nol Seven, Yokohama). Sweating rates were recorded with PC (PC 9801, NEC, Japan) every 5 sec (Lee et al, 1997).
Statistical analysis
All data are expressed as means±SD. Statistical sig- nificance was determined by ANOVA with Tukey’s post hoe test for comparison of mean values among M-S, M-M, M-L and J-R at P < 0.05 level.
R ESULTS
The physical characteristics of the 4 groups of subjects
are tabulated in Table1. Japanese native subjects were taller
and heavier than M-S, M-M and M-L (P <0.01). Typical re-
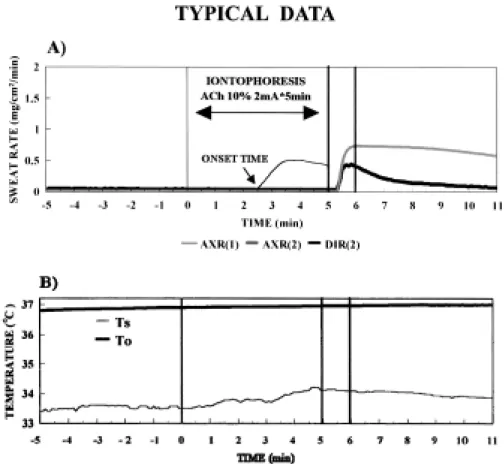
cording of a single subject is shown in Fig.1. When ACh
was applied iontophoretically, AXR sweating occurred after
a latent period (onset-time of axon reflex sweat) and
reached a plateau phase within a few minutes. At the end of
iontophoresis, DIR(2) sweating became sustained, while
296AXR(2) sweating declined to the baseline during the obser- vation.
Sweat onset-time of axon reflex (ACh nicotinic recep- tors) induced by ACh iontophresis, was 2.25±0.43 min, 1.65±0.55 min, 1.45±0.64 min and 1.23±0.38 min in M- S, M-M, M-L and J-R, respectively (Fig. 2). These were sta- tistically different (P <0.01) each other.
Fig 1. Typical recording of the AXR(1), AXR(2) and DIR sweating (upper panel) and of oral and skin temperatures (lower panel) in a Malaysian native subjects (M-M). Iontophoresis of 10% ACh was performed with 2 mA of direct current for 5 min. Just af- ter the cessation of current loading, the sweat capsules were exchanged each other, then recordings were continued for an- other 5 min. Sweat onset-time was 2.33 min. Sweat volume was 0.981 mg/cm
2, 0.662 mg/cm
2and 3.463 mg/cm
2on AXR(1), AXR(2) and DIR, respectively. Ts: Skin temperature just beside ACh capsule, To: Oral temperature
Fig 2. Comparison of the sweat onset-time among Malaysian subjects with different durations of stay in Japan and J- R. Values are means±SD.
Sweat onset-time of axon reflex (ACh nicotinic recep- tors) induced by ACh iontophresis, was statistically dif- ferent in compared with J-R (P <0.01).
Table 1. Physical characteristics of the subjects.
N Age (years) Height (cm) Weight (kg) J-R
M-S M-M M-L
30 9 7 10
25.3±3.9 24.8±2.4 26.1±3.1 28.4±5.3
171.4±4.1 162.3±3.7* 163.2±4.5* 165.2±3.9*
66.90±4.58 57.81±3.27* 59.20±4.41* 60.25±4.83* Values are means±SD. *Significant difference at P <0.01 compared with J-R.
J-R: Japanese native residents
M-S: Malaysian native subject of staying in Japan for 2- 12 m M-M: Malaysian native subject of staying in Japan for 13- 35 m M-L: Malaysian native subject of staying in Japan for 36 - 72 m
297
DIR, sweat volume directly (ACh muscarinic recep- tors) induced by ACh for 6-11 min, was 2.15±0.91 mg/cm
2, 2.92±0.94 mg/cm
2, 3.86±0.79 mg/cm
2and 5.45±1.37 mg /cm
2in M-S, M-M, M-L and J-R, respectively (Fig. 3). The differences were statistically significant (P <0.01).
AXR, sweat volume indirectly induced via axon reflex (ACh nicotinic receptors) by ACh for 0-5 min, was 0.54±
0.41 mg/cm
2, 1.02±0.64 mg/cm
2, 1.58±0.66 mg/cm
2and 2.47±0.80 mg/cm
2in M-S, M-M, M-L and J-R, respec- tively (Fig. 4). These were statistically different (P <0.01) each other.
There was a positive correlation between DIR and the duration of stay in Japan among Malaysian subjects, r=
0.588, P <0.001 (Figure not shown).
D ISCUSSION
In this study, to clarify whether heat-acclimatized tropical subjects loose their nature of acclimatization through residence in a temperate area, we examined the ACh-sensitivity of the sweat glands by QSART in the tropi- cal Malaysians staying in temperate Japan.
Suppression of sweating response to ACh applied ion- tophoretically has been shown in Thai and tropical Africans (Lee et al., 1997; Matsumoto et al., 1997). In this study we showed suppressed sweating response to ACh in Malaysians.
Expression levels of nicotinic ACh receptors and mus- carinic ACh receptors may be genetically determined and/or
regulated by environmental factors such as physiological stress and infection (Sato et al., 1999).
AXR (sweating of ACh nicotinic receptors) and DIR (sweating of ACh muscarinic receptors) in both M-S, M-M and M-L were significantly smaller than those in J-R. Sweat onset-time in Malaysians was longer than in Japanese with the significant differences (P <0.01).
Heat-tolerance is achieved by the lowering of threshold for sweating and enhanced sweating in short-term acclima- tion (Nadel et al., 1974; Ogawa and Sugenoya, 1993). Dur- ing acclimation through daily exercise in a hot environment, these thermoregulatory changes are about three-quarters de- veloped by the end of the first week of exposure and is gen- erally thought be complete after 10-14 days (Pandolf and Young, 1999). Heat acclimation is transient and gradually disappears if not maintained by repeated heat exposure. It is believed that heat acclimation might be retained for 2 weeks after the last heat exposure but then be rapidly lost during the next 2 weeks (Lind, 1964).
According to our knowledge, this is the first report, ex- cept our preliminary report (Saat et al, 1999), showing de- acclimatization process of heat-acclimatized tropical sub- jects through residence in a temperate area. DIR (sweating of ACh muscarinic receptors) sweating of Malaysian sub- jects showed a positive correlation with duration of stay in Japan(P <0.01). It might indicate that long-term heat- acclimatization acquired in tropical subject who had born and raised in a tropical area decays after immigration to a Fig 3. Comparison of DIR, directly activated sweat volume for
6-11 min among Malaysians with different durations of stay in Japan and J-R. Values are means±SD. These were statistically different in compared with J-R (P <
0.01).
Fig 4. Comparison of AXR, axon reflex-mediated sweat vol- ume for 0-5 min, among Malaysians with different du- rations of stay in Japan and J-R. Values are means±SD.
These were statistically different in compared with J-R (P <0.01).
298
temperate area. It is suggested that long-term heat- acclimatization is, at least some part, a phenotypic phe- nomenon.
A CKNOWLEDGEMENT
The authors would like to express sincere thanks to Miss Junko Kawashima and Miss Junko Hayashima for ex- cellent secretarial assistance.
R EFERENCES
1)
Chemali, K.R., Gorodeski, R. and Chelimsky, T.C. (2001):
Alpha-adrenergic supersensitivity of the sudomotor nerve in complex regional pain syndrome. Ann. Neurol., 49, 453-459.
2)Fan, Y.J. (1987): Determination of heat acclimatization by
capacitance hygrometer sweat capture capsule method.
Trop. Med., 29, 107-211.
3)
Hori, S., Ihzuka, H. and Nakamura, M. (1976): Studies on physiological responses of residents in Okinawa to a hot environment. Jap. J. Physiol., 26, 235-244.
4)Kihara, M., Opfer-Gehrking, T.L. and Low P.A. (1993):
Comparison of directly stimulated with axon-reflex- mediated sudomotor responses in human subjects and in patients with diabetes. Muscle Nerve, 16, 655-660.
5)Kuno, Y. (1956): Human Perspiration. Charles C Thomas
Publisher, Springfield, Illinoi.
6)Lee, J-B., Kosaka, M., Othman, T., Matsumoto, T.,
Kaneda, E., Yamauchi, M., Taimura, A., Ohwatari, N., Nakase, Y. and Makita, S. (1999): Evaluation of the ap- plicability of infrared and thermistorthermometry in ther- mophysiology research. Trop. Med. 41, 133-142.
7)Lee, J-B, Matsumoto, T., Othman, T. and Kosaka, M.
(1997): Suppression of the sweat gland sensitivity to ace- tylcholine applied iontophoretically in tropical Africans compared to temperate Japanese. Trop. Med., 39, 111- 121.
8)Lind, A.R. (1964): Physiologic responses to heat. In
Medical Climatology (Licht S eds.; Elizabeth, CT , New Haven CT) pp. 164-195.
9)Low, P.A., Caskey, P.E., Tuck, R.R., Fealey, R.D. and
Dyck, P.J. (1983): Quantitative sudomotor axon reflex test in normal and neuropathic subjects. Ann. Neurol., 14, 573-580.
10)Matsumoto, T., Kosaka, M., Yamauchi, M., Tsuchiya, K,
Ohwatari N., Motomura, K., Otomasu, K, Yang, GJ, Lee, JM., Boonayathap, U., Praputpittaya, C. and Yongsiri, A.
(1993): Study on mechanisms of heat acclimatization due to thermal sweating-Comparison of heat-tolerance be- tween Japanese and Thai subjects. Trop. Med., 35, 23-34.
11)Matsumoto, T., Taimura, A., Yamauchi, M., Tsuchiya, K,
Ohwatari, N., Kosaka, M., Pongchaidecha, A., Praputpit- taya, C., Gomonchareonsiri, S., Boonayathap, U., and Sugenoya, J. (1997): Long-term heat acclimatization in tropical inhabitants. In Thermal Physiology (Nielsen BJ, Nielsen R, eds.; Abstract, August Krough Institute, Co- penhagen) pp 69.
12)Nadel, E.R., Pandolf, K.B., Roberts, M.F. and Stojwijk, J.
A.J. (1974): Mechanisms of thermal acclimation to exer- cise and heat. J. Appl. Physiol., 37, 515-520,
13)Ogawa, T. and Sugenoya, J. (1993): Pulsatile sweating
and sympathetic sudomotor activity. Jpn. J. Physiol., 43, 275-289.
14)Ogawa, T. and Bullard, R.W. (1972): Characteristics of
subthreshold sudomotor neural impulses. J. Appl.
Physiol., 33, 300-305.
15)Ohwatari, N., Fujiwara, M., Iwamoto, J. Fan, Y.J. and
Yang, K. (1983): Studies on heat adaptation. Measure- ment of the sweating reaction of a tropical inhabitant.
Trop. Med., 25, 235-241.
16)Pandolf, K.B. and Young, A.J. (1999): Environmental ex-
tremes and performance. In Endurance in Sport (Shephard RJ and Astrand PO eds.; Blackwell , Oxford) pp. 270-282.
17)Saat, M., Lee, J.B., Matsumoto, T., Kosaka, M., Ohwatari,
N., Motomura, K., Kaneda, E., Taimura, A. and Yamauchi, M. (1999): Relationship between the duration of stay in Japan of Malysian subjects and the suppression of sweat gland sensitivity by iontophoretically applied acetylcholine. Acta Med. Nagasaki, 44, 49-53.
18)Sasaki, T. and Tsuzuki, S. (1984): Changes in tolerance to
heat and cold after migration from subtropics to temper- ate zone. In Thermal Physiology (Hales JRS eds.; Raven Press, New York) pp. 479-482.
19)Sato, K.Z., Fujii, T., Watanabe, Y., Yamada, S., Ando, T.,
Kazuko, F. and Kawashima, K. (1999): Diversity of mRNA expression for muscarinic acetylcholine receptor subtypes and neuronal nicotinic acetylcholine receptor subunits in human mononuclear leukocytes and leukemic cell lines. Neurosci. Lett., 266, 17-20.
20)Sugenoya, J., Ogawa, T., Jmai, K., Ohnishi, N. and Nat-
sume, K. (1995): Cutaneous vasodilatation synchronize with sweat expulsions. Eur. J. Appl. Physiol., 71, 33-40.
21)Yoshimura, H. (1960): Acclimatization to heat and cool.
In Essential Problem in Climatic Physiology (Yoshimura, H., Ogata, K., Itoh, S. eds.; Nankodo, Tokyo) pp. 61-106.
299