【原 著】
Original
本邦における大量輸血症例の検討
―平成 25 年血液製剤使用実態詳細調査(300 床以上)より―
前田 平生1) 阿南 昌弘1) 田中 朝志2) 牧野 茂義3) 紀野 修一4)
「平成 25 年血液製剤使用実態詳細調査(300 床以上)」において 1 日に赤血球濃厚液(RBC)を 10 単位以上輸血さ れた症例(R10 症例)について解析した.1)大量輸血を実施した施設(353 施設,473,391 例)では,約 4.1% の症 例(19,184 例)が RBC 全体の 17.3%(325,173 単位),新鮮凍結血漿(FFP)の 31.8%(263,701 単位)を使用してい た.2)大量輸血を実施したが,輸血量の未回答施設(160 施設)を考慮すると,国内では年間 RBC は約 47 万単位,
FFP は約 38 万単位が使用されており,大量輸血症例数は約 2.8 万人と推定された.3)診療科別(168 施設,5,796 例)では,心臓大血管外科 47%,救急科 13%,消化器外科 11%,産婦人科 6% の順で多く,これら 4 診療科で全体 の 77% を占めていた.4)クリオプレシピテート,フィブリノゲン製剤の投与施設,投与例数は,それぞれ 10 施設,
102 例(1.8%);11 施設,144 例(2.5%)と少数であった.5)両製剤使用群の輸血前フィブリノゲン値は,非使用 群に比較して低く,また,輸血量は多い傾向にあり,より重症例に投与されていると推定された.6)両製剤の止血 効果,有用性を示すためには,疾患ごとの比較研究が必要と考えられた.
キーワード:大量輸血,低フィブリノゲン血症,新鮮凍結血漿,クリオプレシピテート,
フィブリノゲン濃縮製剤
はじめに
大量出血症例に対して,早期からの新鮮凍結血漿(FFP)
を含めた凝固因子の補充,特にフィブリノゲンの補充 により,出血量,輸血量の減少,ひいては患者予後の 改善につながる可能性が報告されている1)〜5).
本邦においても,大量輸血症例の大半は,輸血前フィ ブリノゲン(Fib)値が 150mg!d
l
未満で輸血されてい ること6),また,輸血前 Fib 値と輸血量の間には,負の 相関があり7),クリオプレシピテートあるいはフィブリ ノゲン濃縮製剤の投与により,輸血量を半減できるこ とが報告されている8)9).しかし,本邦においては,ク リオプレシピテートは供給されておらず,また,フィ ブリノゲン濃縮製剤は保険適応がないため,血液製剤 の使用指針に従えば,大量の FFP を投与せざるを得な い10).その結果,FFP のみならず赤血球濃厚液(RBC)輸血量の増加を招き,適正使用に資さないばかりか,
容量過負荷,急性肺障害などの副作用の発生が危惧さ れている11).
献血血液の有効利用により適切な製剤が供給されれ
ば,大量輸血症例において輸血量が半減できる可能性 があるため12)13),2011 年より全国血液製剤使用実態調査 において,大量輸血症例の症例数,RBC,FFP 輸血量,
診療科等について調査を行ってきた14).今回,2013 年 の詳細調査の結果について報告する.
対象と方法
日本赤十字社血液センターより輸血用血液製剤が供 給された医療機関 11,015 施設を対象とし,平成 25 年度 厚生労働省委託事業として日本輸血・細胞治療学会が 行ったアンケート調査結果よりデータを抽出した.
A)「平成 25 年度血液製剤使用実態基本調査」では,
輸血業務・血液製剤年間使用量基本調査項目にて,病 床数,RBC,FFP の輸血単位数を調査した.病床数は,
その規模により 300 床未満,300〜499 床,500〜799 床,800 床以上の 4 群に分けて集計した.大量出血時の 輸血についての項目では,2013 年 1 月〜12 月までの間,
1 日以内に RBC を 10 単位以上輸血した症例(R10 症例)
の有無,R10 症例における RBC,FFP,クリオプレシ
1)埼玉医科大学総合医療センター輸血・細胞治療部 2)東京医科大学八王子医療センター輸血部
3)虎の門病院輸血部
4)日本赤十字社北海道ブロック血液センター
〔受付日:2014 年 12 月 19 日,受理日:2015 年 3 月 24 日〕
Table 1 Red blood cell and fresh frozen plasma utilization in 2013 by number of beds
Number of beds
Number of respondents (institutions)
RBC transfusion FFP transfusion
Number of institutions
Total units transfused
Average number of units
transfused/
institution
Number of institutions
Total units transfused
Average number of units
transfused/
institution
<_ 299 4,122 3,082 1,207,504 392 1,293 212,146 164
300-499 490 456 1,184,942 2,599 408 396,352 971
500-799 221 215 1,385,356 6,444 199 614,082 3,086
>_ 800 61 59 762,569 12,925 59 482,968 8,186
Total 4,894 3,812 4,540,371 1,191 1,959 1,705,548 871
Table 2 Number of institutions classified according to presence or absence of massively transfused patients in 2013
Number of beds I-1* I-2* II* III* Total
<_ 299 6 3 22 4,091 4,122
300-499 188 75 116 111 490
500-799 117 68 12 24 221
>_ 800 42 14 5 61
Total 353 160 150 4,231 4,894
*) I-1: Institutions reporting R10 cases with transfuion amounts, I-2: Institutions reporting R10 cases without transfuion amounts, II: Institutions reporting no R10 cases, III: Institutions with no responses for the R10 case survey
ピテート,濃縮フィブリノゲン製剤使用の有無につい て調査した.
B)「平成 25 年度血液製剤使用実態詳細調査(300 床以上)」では,大量輸血症例に関する詳細項目として,
各施設における R10 症例の有無(300 床以上の設問),
全輸血症例数と総 RBC,FFP 輸血量および R10 症例数 とその RBC,FFP 輸血量を調査した.本邦では,大量 出血の定義は 24 時間以内に循環血液量の 100% 以上の 出血とされている.一方,R10 症例における RBC 総輸 血量は全輸血症例の約 20%,FFP は約 30% であり,
また FFP!RBC 比は 0.8〜1.0 と非 R10 症例と較べて有 意に高いことが知られている.以上のことから,本報 告では R10 症例を大量輸血症例として扱った.なお,
2 日にわたって 10 単位以上の輸血が行われた症例は R10 症例 1 症例として扱い,2 日間とも 10 単位以上の 輸血が行われていた場合は 2 症例として扱った.また,
R10 症例があったと回答していた施設のうち,R10 症例 数や輸血量の記載がなかった施設のデータを推定する ため,各施設の輸血目的に偏りがないと仮定し,病床 数別の施設数比から R10 症例数,RBC,FFP 輸血量を 算出した.
C)「別紙 7 大量輸血症例」報告では,R10 症例個別 の RBC,FFP,クリオプレシピテート,濃縮フィブリ ノゲン製剤の総使用量,FFP を含む凝固因子製剤を使
用する前のフィブリノゲン値,診療科名を調査した.
R10 症例のうち,クリオプレシピテート使用群,フィブ リノゲン製剤使用群,およびこれらの凝固因子製剤を 使用しなかった群の 3 群に分類し,群別平均輸血量を 集計した.また,輸血前フィブリノゲン値を 100mg!d
l
未 満,100 以 上 150mg!dl
未 満,150mg!dl
以 上 の 3 群に分類し,凝固因子製剤使用の有無による輸血量の 違いを調査した.結 果
1.血液製剤使用実態基本調査
平成 25 年度血液製剤使用実態基本調査では,対象と なった 11,015 施設のうち,回答のあった施設数は 4,894
(44.4%)であった.発送時の病床数が不明であった 905 施設をのぞいた 10,110 施設での,病床数別の回答施設 数!対象施設数割合は,300 床未満で 3,875!9,119(42.5%), 300〜499 床 485
!
709(68.4%),500〜799 床 221!
273(81.0%),800 床以上 65
!
75(86.7%)であり,施設規模 が大きいほど回収率は高い傾向であった.RBC 輸血は 3,812 施設で実施され,年間総使用量は 4,540,371 単位で あった.また,FFP 輸血は 1,959 施設で実施され,年間 総使用量は 1,705,548 単位であった(Table 1).2.血液製剤使用実態詳細調査
基本調査報告があった 4,894 施設の内,663 施設から 詳細報告があった.このうち,対象と方法の項目 B)に おいて,①R10 症例があり,かつ輸血量が記載された施 設(I-1 群)353 施設,②R10 症例はあったが,輸血量 の記載がなかった施設(I-2 群)160 施設,③R10 症例 がなかった施設(II 群)150 施設,④詳細報告がなかっ た施設(III 群)4,231 施設であった.病床数別に,それ ぞれの施設数を Table 2 に示す.有効回答施設(I-1:353 施設)での総輸血症例数,R10 症例数は,473,391 例,
19,184 例(4.1%)であり,総輸血量および R10 症例に お け る 総 輸 血 量 は,RBC で 1,875,703 単 位,325,173 単位(17.3%),FFP で 828,057 単位,263,701 単位(31.8%)
であった(Table 3).全輸血症例および R10 症例の 1 症例あたりの RBC,FFP 輸血量および FFP!RBC 比は,
Fig. 1 Massive transfusion cases (RBC) in each department (n=5,796)
Table 3 Number of massively transfused patients and the total amounts of RBC and FFP used Number
of beds
Number of cases RBC units transfused FFP units transfused
All cases R10 cases % R10 cases All cases R10 cases % RBC units All cases R10 cases % FFP units
<_ 299 2,742 58 2.1% 6,521 834 12.8% 2,086 636 30.5%
300-499 137,566 3,862 2.8% 505,229 74,018 14.7% 191,336 60,268 31.5%
500-799 206,300 8,628 4.2% 848,250 136,572 16.1% 334,108 103,183 30.9%
>_ 800 126,783 6,636 5.2% 515,703 113,749 22.1% 300,527 99,614 33.1%
Total 473,391 19,184 4.1% 1,875,703 325,173 17.3% 828,057 263,701 31.8%
Table 4 Estimation of the total amount of RBC and FFP usage in massively transfused patients from the RBC and FFP usage data available in survey responses
Number of beds Institutions Cases Total RBC units transfused Total FFP units transfused
I-1 I-2 I-1 I-2* I-1 I-2* I-1 I-2*
<_ 299 6 3 58 29 834 417 636 318
300-499 188 75 3,862 1,541 74,018 29,528 60,268 24,043
500-799 117 68 8,628 5,015 136,572 79,375 103,183 59,970
>_ 800 42 14 6,636 2,212 113,749 37,916 99,614 33,205
Total 353 160 19,184 8,796 325,173 147,237 263,701 117,535
Total (estimated) 513 27,980 472,410 381,236
*) The number in I-1 group is the actual number, while the italic number in I-2 groups was calculated by the ratio of I-1/I-2 in the Institutions column.
それぞれ 4.0 単位,1.7 単位,0.44;17.0 単位,13.7 単位,
0.81 であった.
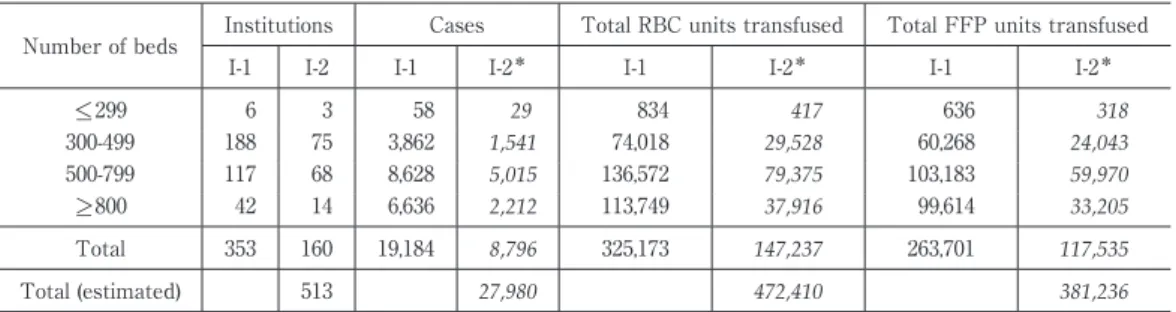
3.大量輸血症例数・輸血量(推定)
上記施設以外に,R10 症例はあったが,輸血量の記載
Table 5a Average nember of units of transfused RBC in patients receiving cryoprecipitate or fibrinogen con- centrate
Department Cryo+ n= Fib+ n= Cryo-Fib- n= Total n= %
Cardiovascular surgery* 29.0 51 21.5 55 18.1 2,624 18.4 2,730 47.1%
Emergency department 23.6 10 28.0 31 18.0 698 18.5 739 12.8%
Gastroenterological surgery 32.8 8 35.2 5 16.8 621 17.2 634 10.9%
Obstetrics and Gynecology 17.3 9 17.4 25 15.9 290 16.1 324 5.6%
Other 18.3 19 15.4 259 15.6 278 4.8%
Orthopedics 22.0 3 15.4 233 15.5 236 4.1%
Gastroenterology 15.0 2 14.4 194 14.4 196 3.4%
Urology 49.0 2 10.0 1 15.3 141 15.7 144 2.5%
Other surgical 28.0 5 17.5 107 17.9 112 1.9%
Cranial nerve surgery 12.0 1 11.3 3 15.5 107 15.3 111 1.9%
Liver transplantation surgery 22.0 3 29.0 2 25.1 96 25.1 101 1.7%
Thoracic surgery 23.4 10 80.0 1 21.5 82 22.3 93 1.6%
Otolaryngology 15.3 29 15.3 29 0.5%
Blank** 18.5 27 18.5 27 0.5%
Heart transplant surgery 17.2 24 17.2 24 0.4%
Kidney transplant surgery 14.5 17 14.5 17 0.3%
Other transplant surgery 26.0 1 26.0 1 0.0%
Total 26.9 102 22.4 144 17.5 5,550 17.8 5,796
*) One patient received both cryoprecipitate and fibrinogen concentrates and was included in the cryoprecipitate group.
**) The name of department was not described.
Table 5b Average number of units of transfused FFP in patients receiving cryoprecipitate or fibrinogen con- centrate
Department Cryo+ n= Fib+ n= Cryo-Fib- n= Total n= %
Cardiovascular surgery* 23.0 51 17.6 55 16.2 2,527 16.4 2,633 50.0%
Emergency department 19.2 10 25.2 31 16.4 637 16.9 678 12.9%
Gastroenterological surgery 26.4 8 28.4 5 14.3 537 14.6 550 10.5%
Obstetrics and Gynecology 15.1 9 23.6 25 15.7 262 16.4 296 5.6%
Other 5.6 17 11.5 210 11.1 227 4.3%
Orthopedics 17.3 3 12.2 188 12.2 191 3.6%
Gastroenterology 10.0 2 10.7 126 10.7 128 2.4%
Urology 29.0 2 7.5 1 10.2 121 10.5 124 2.4%
Other surgical 25.2 5 17.4 95 17.8 100 1.9%
Cranial nerve surgery 14.0 1 7.0 3 10.4 96 10.3 100 1.9%
Liver transplantation surgery 35.3 3 33.0 2 27.1 91 27.5 96 1.8%
Thoracic surgery 15.8 10 62.0 1 18.5 73 18.7 84 1.6%
Blank** 13.2 26 13.2 26 0.5%
Otolaryngology 11.3 23 11.3 23 0.4%
Heart transplant surgery 16.4 23 16.4 23 0.4%
Kidney transplant surgery 14.5 17 14.5 17 0.3%
Other transplant surgery 10.0 1 10.0 1 0.0%
Total 21.8 102 19.4 142 15.5 5,053 15.7 5,297
*) One patient received both cryoprecipitate and fibrinogen concentrates and was included in the cryoprecipitate group.
**) The name of department was not described.
がなかった施設(I-2 群)が 160 施設あった.これらを 病床数別の回答施設割合で症例数,輸血量を推定する と,症 例 数 で 27,980 例,RBC で 472,410 単 位,FFP で 381,236 単位が使用されていたと推定された(Table 4).
4.診療科別大量輸血症例
対象と方法の項目 C)による R10 症例の個別報告は,
168 施設から 5,796 例が報告され,平均 RBC,FFP 輸血
量は,それぞれ 17.8 単位,15.7 単位であった.診療科 別では,心臓・大血管外科 2,730 例(47%),救急科 739 例(13%),消化器外科 634 例(11%),産婦人科 324 例(6%)の順であった(Fig. 1).
5.クリオプレシピテート・フィブリノゲン製剤使用
例個別報告でのクリオプレシピテート(Cryo),フィブ リノゲン製剤(Fib)投与例は,それぞれ 10 施設,102
Table 6 Pretransfusion fibrinogen values in patients receiving cryoprecipitate or fi- brinogen concentrate
Department Cryo+ n= Fib+ n= Cryo-Fib- n=
Cardiovascular surgery* 124.2 50 191.2 33 236.4 1,151
Emergency 77.2 10 93.6 31 190.2 406
Gastroenterological surgery 151.5 8 129.0 4 240.5 230
Obstetrics and Gynecology 155.3 9 95.6 25 189.6 156
Other 126.4 18 242.5 103
Orthopedics 89.0 2 215.9 79
Gastroenterology 152.5 2 185.0 69
Cranial nerve surgery 83.0 1 214.0 1 164.4 49
Urology 121.0 2 239.7 41
Thoracic surgery 92.8 10 254.5 27
Other surgical 463.5 4 249.7 23
Liver transplantation surgery 112.3 3 56.0 2 120.7 9
Otolaryngology 266.0 8
Kidney transplant surgery 133.5 2
Heart transplant surgery 290.5 2
Other transplant surgery 85.0 1
Blank** 161.2 6
Total 133.5 99 129.5 116 222.1 2,362
*) One patient received both cryoprecipitate and fibrinogen concentrates and was included in the cryoprecipitate group.
**) The name of department was not described.
例(1.8%)(平 均 15.5 単 位),11 施 設,144 例(2.5%)
(使用量(g)に関しては記載がバラバラで不明)と非 使用群(Cryo-Fib-)(5,550 例)に比較し少数であった.
これら 3 群での平均 RBC 輸血量は,26.9 単位,22.4 単位,17.5 単位,平均 FFP 輸血量は 21.8 単 位,19.4 単位,15.5 単位と Cryo,Fib 製剤使用群において,非 使用群と比較して使用量は多かったが(Table 5a,b),
輸血前フィブリノゲン(Fib)値は平均 133.5mg
!
dl
(99 例),129.5mg!dl
(116 例),222.1mg!dl
(2,362 例)と 低かった(Table 6).6.輸血前 Fib
値と輸血量輸血前 Fib 値と輸血量の関係を検討するために,輸 血 前 Fib 値 を,100mg!d
l
未 満,100 以 上 150mg!dl
未満,150mg!dl
以上,未検査に分けて,4 群での症例 数,RBC 輸血量,FFP 輸血量を算出した.Cryo,Fib 使用群では,輸血前 Fib 値が 100 未満,150 未満の症例 割合が,それぞれ 45.1%,28.4%;36.8%,21.5% と非 使用群(6.6%,8.0%)と比較して有意に高く,また,輸血前 Fib 値測定についても非使用群(42.6%)に比較 して高率(97.1%,80.6%)に行われていた(Table 7 a).
さらに,上記輸血前 Fib 値による 3 群において,RBC 輸 血 で は,Cryo 群(28.3,25.1,25.0 単 位),Fib 群
(21.4,26.4,22.6 単位)ともに顕著な差は見られなかっ たが,非使用群での輸血量(23.1,18.7,16.9 単位)は 明らかに輸血前 Fib 値と負の相関を示していた.FFP 輸血についても同様であった(Table 7b).
考 察
大量輸血(R10 症例)があった 353 施設において,R10 症例は,全輸血症例の 4.1%(19,184 例)であったが,
総 RBC,FFP 輸血量は,それぞれ 17.3%(325,173 単位), 31.8%(263,701 単位)を占めた.上記施設以外に,大 量輸血はあったが,輸血量の記載がなかった施設が 160 施設あり,これらを病床数別の回答施設割合で使用量 を推定したところ,RBC で約 47 万単位,FFP で約 38 万単位が使用されていたと推定された.ちなみに,前 年度の推定単位数は,1 年間で RBC 約 42 万単位,FFP 約 33 万単位(479 施設)であった15).
これらのことから,国内における R10 症例における RBC 輸血量は年間約 47 万単位,FFP は約 38 万単位と 推定される.また,R10 症例の平均 RBC,FFP 輸血量 は,17.0 単位,13.7 単位であるので,症例数は約 2.8 万例と推定された.このうち,約半数が輸血前 Fib 値 150mg!d
l
以下の適応例とすると推定適応症例数は,約 1.4 万例となる6)16).診療科別報告では,心臓・大血管外科 47%,救急科 13%,消化器外科 11%,産婦人科 6% で,ほぼ前年度 と同程度であり,これら 4 科で全体の 77% を占めてい た.クリオプレシピテートおよびフィブリノゲン製剤 投与例は,全体の 1.8%,2.5% に過ぎなかったが,輸血 前 Fib 値は 150mg!d
l
未満の症例が多く,また,Fib 値の測定割合も 97.1%,80.6% と高く,Fib 値を参考に して投与されていることが窺われた.また,両製剤のTable 7a Average number of units of transfused RBC in patients receiving cryoprecipitate or fibrinogen concentrate ac- cording to pretransfusion fibrinogen levels
Fib values
(mg/dl) Cryo+ n= % Fib+ n= % Cryo-Fib- n= % Total n= %
<_ 99 28.3 46 45.1% 21.4 53 36.8% 23.1 365 6.6% 23.4 464 8.0%
100-149 25.1 29 28.4% 26.4 31 21.5% 18.7 443 8.0% 19.5 503 8.7%
>_ 150 25.0 24 23.5% 22.6 32 22.2% 16.9 1,554 28.0% 17.1 1,610 27.8%
Not tested 39.3 3 2.9% 19.4 28 19.4% 17.0 3,188 57.4% 17.0 3,219 55.5%
Total 26.9 102 22.4 144 17.5 5,550 17.8 5,796
Table 7b Average number of units of transfused FFP in patients receiving cryoprecipitate or fibrinogen concentrate ac- cording to pretransfusion fibrinogen levels
Fib values
(mg/dl) Cryo+ n= % Fib+ n= % Cryo-Fib- n= % Total n= %
<_ 99 24.3 46 45.1% 20.7 53 37.3% 22.1 358 7.1% 22.2 457 8.6%
100-149 20.4 29 28.4% 21.4 29 20.4% 17.0 434 8.6% 17.4 492 9.3%
>_ 150 20.1 24 23.5% 18.7 32 22.5% 14.3 1,468 29.1% 14.4 1,524 28.8%
Not tested 10.7 3 2.9% 15.6 28 19.7% 15.0 2,793 55.3% 15.0 2,824 53.3%
Total 21.8 102 19.4 142 15.5 5,053 15.7 5,297
投与群においては,いずれの輸血前 Fib 値群において も,非投与群に較べて,平均輸血量は多く,両製剤に よる輸血量削減効果については,本調査では確認でき なかった.しかし,特定の疾患群においては,フィブ リノゲン製剤の投与により,輸血量が削減できるとの 報告もあり12)13),今後,対象疾患を限定し,投与時期,
投与量の比較検討が必要であると考えられた.
著者の COI 開示:本論文発表内容に関連して特に申告なし この研究の一部は,平成 26 年度厚生労働科学研究費補助金
(医薬品等規制調和・評価研究事業)「大量出血症例に対する最適
輸血療法の確立に関する研究(H24―医薬―指定―036)」によって行 われた.
文 献
1)Borgman MA, Spinella PC, Perkins JG, et al: The ratio of blood products transfused affects mortality in pa- tients receiving massive transfusions at a combat sup- port hospital. J Trauma, 63: 805―813, 2007.
2)Holcomb JB, Wade CE, Michalek JE, et al: Increased plasma and platelet to red blood cell ratios improves outcome in 466 massively transfused civilian trauma pa- tients. Ann Surg, 248: 447―458, 2008.
3)Fenger-Eriksen C, Lindberg-Larsen M, Christensen AQ, et al: Fibrinogen concentrate substitution therapy in pa- tients with massive haemorrhage and low plasma fi- brinogen concentrations. Br J Anaesth, 101: 769―773, 2008.
4)Schöchl H, Nienaber U, Maegele M, et al: Transfusion in trauma: thromboelastometry-guided coagulation factor concentrate-based therapy versus standard fresh fro- zen plasma-based therapy. Critical Care, 15: R83, 2011.
5)Rahe-Meyer N, Hanke A, Schmidt DS, et al: Fibrinogen concentrate reduces intraoperative bleeding when used as first-line hemostatic therapy during major aor- tic replacement surgery: Results from a randomized, placebo-controlled trial. J Thorac Cardiovasc Surg, 145:
S178―185, 2013.
6)阿南昌弘,大久保光夫,大木浩子,他:大量輸血症例に おける患者フィブリノゲン濃度と輸血量についての検討.
日本輸血細胞治療学会誌,59(1):38―42, 2013.
7)Matsunaga S, Seki H, Ono Y, et al: A retrospective analy- sis of transfusion management for obstetric hemor- rhage in a Japanese obstetric center. ISRN Obstet Gyne- col, 2012: 854064, 2012. doi: 10.5402!2012!854064. Epub 2012 Feb 6.
8)山本晃士,西脇公俊,加藤千秋,他:術中大量出血を防 ぐための新たな輸血治療―クリオプレシピテートおよび
フィブリノゲン濃縮製剤投与効果の検討―.日本輸血細
胞治療学会誌,56:36―42, 2010.
9)岩尾憲明,須波 玲,大森真紀子,他:産科大量出血に
対するクリオプレシピテートの有用性.日本輸血細胞治
療学会誌,58(3):486―491, 2012.
10)厚生労働省医薬食品局血液対策課:血液製剤の使用指針
(改定版),平成 17 年 9 月(平成 24 年 3 月一部改正).
11)Watson GA, Sperry JL, Rosengart MR, et al: Fresh fro- zen plasma is independently associated with a higher risk of multiple organ failure and acute respiratory dis- tress syndrome. J Trauma, 67: 221―230, 2009.
12)Rahe-Meyer N, Solomon C, Hanke A, et al: Effects of fi- brinogen concentrate as first-line therapy during major aortic replacement surgery : a randomized, placebo- controlled trial. Anesthesiology, 118: 40―50, 2013.
13)Yamamoto K, Usui A, Takamatsu J: Fibrinogen concen- trate administration attributes to significant reductions of blood loss and transfusion requirements in thoracic aortic repair. Journal of Cardiothoracic Surgery, 9: 90, 2014.
14)牧野茂義,田中朝志,紀野修一,他:2011 年度日本の輸
血管理体制および血液製剤使用実態調査報告.日本輸血
細胞治療学会誌,58(6):774―781, 2012.
15)前田平生:大量輸血症例およびクリオプレシピテート・
フィブリノゲン製剤投与例における輸血量,輸血前フィ
ブリノゲン値に関する研究.平成 25 年度医薬品・医療 機器等レギュラトリーサイエンス総合研究事業:大量出 血症例に対する最適輸血療法の確立に関する研究報告書
(研究代表者:宮田茂樹),2014.
16)Spahn DR, Bouillon B, Cerny V, et al: Management of bleeding and coagulopathy following major trauma: an updated European guideline. Critical Care, 17: R76, 2013.
THE 2013 NATIONWIDE SURVEY ON MASSIVE TRANSFUSION CASES WITH 10 OR MORE UNITS OF RED BLOOD CELLS IN JAPAN
Hiroo Maeda
1), Masahiro Anan
1), Asashi Tanaka
2), Shigeyoshi Makino
3)and Shuichi Kino
4)1)
Department of Transfusion Medicine and Cell Therapy, Saitama Medical Center, Saitama Medical University
2)
Department of Transfusion Medicine, Tokyo Medical University Hachioji Medical Center
3)
Department of Transfusion Medicine, Toranomon Hospital
4)
Japanese Red Cross Hokkaido Block Blood Center
Abstract:
We conducted a nationwide questionnaire-based survey in 2013 among surgical patients who underwent trans- fusion of
"10 units of red blood cells (RBC) per day (R10) in hospitals with 300 or more beds.
1) Of the 513 hospitals that indicated they had R10 patients, 353 provided the number of R10 patients as well as the amount of RBC and fresh frozen plasma (FFP) used. The remaining 160 hospitals did not provide this information.
2) A total of 473,391 patients were transfused in the 353 hospitals. Of these, there were 19,184 R10 patients (4.1%
of total patients). In R10 patients, 325,173 RBC units were transfused (17.3% of total RBC used in transfused patients), and 263,701 FFP units were transfused (31.8% of total FFP used in transfused patients).
3) For the 160 hospitals that did not respond, we estimated that the total number of R10 patients and amounts of RBC and FFP used were 27,980 patients, 472,410 units, and 381,236 units, respectively.
4) We collected 5,796 detailed case reports for R10 patients from 168 hospitals. The number of R10 patients in each department was as follows: cardiovascular surgery, 2,730 (47%); emergency, 739 (13%); digestive surgery, 634 (11%); and obstetrics!gynecological surgery, 324 (6%). In these 4 departments, 77% of the blood components were used.
5) Of the R10 patients, only 102 (1.8% of reported cases) received cryoprecipitate (CRYO), and 144 (2.5% of re- ported cases) received fibrinogen concentrate (FIB). The fibrinogen values in the pretransfusion period were lower than those of R10 patients that did not receive CRYO or FIB. Further, the average number of units of RBC and FFP used in patients treated with CRYO or FIB were higher than in patients without CRYO or FIB.
We conclude that a further systematic study is needed to confirm the hemostatic effect and clinical indication of CRYO and FIB.
Keywords:
massive transfusion, hypofibrinogenemia, FFP, cryoprecipitate, fibrinogen concentrate
!2015 The Japan Society of Transfusion Medicine and Cell Therapy Journal Web Site: http:!!yuketsu.jstmct.or.jp!