関西学院大学リポジトリ
136
0
0
全文
(2) Contents. General Introduction. 1 Thesis perspective- Development of Raman depth profiling method for in vivo measurements oflayered tissues. 5. 2 Why Raman? - Optical biopsy using near-infrared Raman spectroscopy. 6. 3 Development a newly miniaturized fiber-optic Raman probe with high signal-to-noise ratio. 8. 4 How to achieve Raman depth profiling using miniaturized Raman probes - Optical properties ofBHRPs and its application. 10. 5 Further prospects for measuring layered biomedical tissues using BHRP. 11. 6 Thesisoutline. 12. References. 16. Chapter 1: Basic Study of Raman Sampling Volume in Diffusely Scattering Media. Abstract. 24. Introduction. 25. Experimental. 27. Results and Discussions. 28. Conclusion. 33. References. 34. 2.
(3) Chapter 2: High axial resolution Raman probe made of single holRow optical fiber. Results and Discussions 47. Chapter 3: Subsurface Sensing of Biomedical Tissues Using a Miniaturized Raman Probe: Study of Thin-layered Model Samples. Results and Discussions 68. Chapter 4: Noninvasive Subsurface Analysis Using Multiple Miniaturized Raman Probes: Basic Study of Thin-Layered Transparent Models ofBiomedical Tissues. 3.
(4) Results and Discussions. 94. Conclusion. 97. References. 98. Chapter 5: Raman Study of Brain Functions in Live Mice and Rats: a Pilot Study. Abstract. 105. Introduction. 106. Experimental. 108. Results and Discussions. 110. Conclusion. 116. References. 117. Acknowledgement. 125. List of Publications. 127. 4.
(5) GeneraR Introduction. 1. Thesis perspective - DeveEopment of Raman depth profiling method for in vivo measurements of Rayered tissues The aim of this research is to investigate optical properties of a newly developed. fiber-optic miniaturized Raman probe and develop of methodologies for obtaining depth-resolved Raman signals from biomedical tissues.. In recent years, fiber-optic Raman spectroscopy has become a more prospective method for real-time "optical biopsy" in place of conventional biopsy along with the progression of miniaturized fiber-optic probes.i'3For a noninvasive in vivo diagnosis and detection of epithelial precancer and cancer in organs, it is highly desirable to develop a. depth-resolved Raman spectroscopic technique in order to characterize depth-dependent pathological changes associated with disease transformation in tissue.4 I developed depth. profiling methods using a newly fiber-optic Raman probe, called ball-lens mounted hollow-fiber Raman probe (BHRP) as a term of endearment, on the basic knowledge of optical properties of the Raman probes. Optical biopsy using Raman spectroscopy would improve by introducing the methodology by allowing layered tissues to be monitored in. nonmvaslve manner. The novelty and originality ofthis thesis can be described as follows: First, detailed. information of scattering effects in layered sample are shown experimentally and generally. by Raman spectroscopy. I eliminate an absorption effect of scattering media from the experimental system to highlight a scattering effect for a size ofRaman sampling volume in. depth direction. Second, BHRP are introduced as a miniaturized Raman probe for a. 5.
(6) miniaturized endoscope. Basic properties and functions ofBHRPs are investigated in detail. In this study, it is shown that BHRP has a high-sensitivity, limited depth-of-field optical. property and considerably little background noise enough to use with the miniaturized. endoscope. Third, I present a shape of Raman sampling volume of BHRPs along depth direction in a layered transparent sample. A calculation using chemometrics is introduced to. depict a real form of Raman sampling volumes inside a layered transparent sample. Fourth, I. propose a simple methodology to extract a pure Raman spectrum from embedded layer by using multiple BHRPs. In contact with surface layer of layered transparent materials, multiple BHRPs with different working distances measure different Raman spectra. These spectra includes Raman signal from surface and subsurface layer at the same time if the. Raman sampling volume of BHRPs are thicker than each layers. I clarify a relationship. between a size of Raman sampling volume of BHRPs, thicknesses of surface layers, and measured Raman spectra. Finally, I show a potent example to apply this system to in vivo measurements ofa living rat.. The goal of this research is to demonstrate a performance of BHRP for in vivo measurement of animals in a living state, and show future prospects of optical biopsy using. BHRP.. 2. Why Raman? - Optical biopsy using near-infrared Raman spectroscopy To diagnose disease, the physician's ability is enhanced by the timely availability of objective, quantitative diagnostic information.5 Novel biomedical applications of optical. spectroscopy, such as fluorescence, reflectance and Raman scattering have made advances by their needs to provide such information in clinical practice.5. 6.
(7) Raman spectroscopy is a vibrational spectroscopic technique and can provide the most detailed information about the chemical composition of tissue at the molecular level.. Since light can be delivered and collected rapidly via optical fibers, which can be incorporated into catheters, endoscopes, cannulas and needles, Raman spectroscopy can be. performed in vivo in real time.A promising study of clinical Raman system using a fiber-optic Raman probe has firstly reported by Shim et al. in 1997.6 They introduced a. fiber-bundle Raman probe which consists of a central illumination fiber surrounded by several detection fibers with integrated filters.6' 7 After this report, many kinds of Raman. probes were developed in similar or different manner by a number ofresearch groups. Most. Raman fiber probes are bundled-silica-fiber probes mainly 6 to 15-around-1 multi fiber probes made of silica optical fibers.8'i4Another type of Raman probesarefabricated usinga. hollow-optical fiber, a new type of optical fiber.i5 Note that a new type of Raman probe made ofa hollow fiber will be introduced in this thesis.. For in vivo diagnosis and detection of epithelial cancer and precancer nondestructively, Near-infrared (NIR) Raman spectroscopy has certain advantages. Interference ofwater is relatively small in comparison to Fourier transform IR spectroscopy in NIR region.And a penetration depth ofNIR excitation light is deeper than that in shorter. wavelength.i6Moreover, strong and broadband fluorescence from tissue decreases very rapidly at NIR excitation comparing to visible excitation.5 For CCD-based dispersive spectrometers, excitation wavelengths shorter than 850 nm is usefu1 with silicon-based CCD. detectors because detector efficiency drops of sharply from 1000 to 1100 nm which is. corresponding to the Raman fingerprint region for 850 nm excitation.5 Fluorescence interference in tissue Raman spectra can be reduced even further with 830 nm excitation. 7.
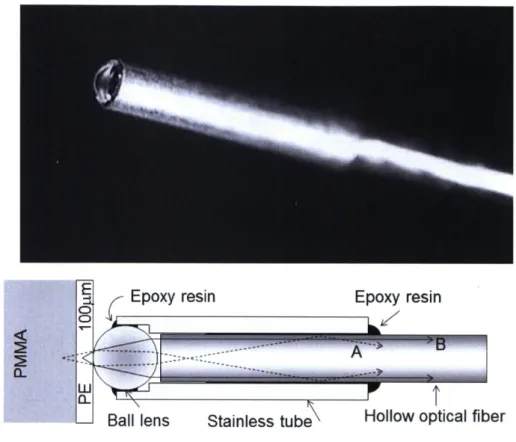
(8) than 810 nm.5 These descriptions may indicate that the laser source at 830 nm or longer. wavelength has advantages for Raman measurement of biomedical tissues with CCD detector. However, for practical Raman systems, laser sources at 830 nm wereinitially used for the fiber-optic Raman systems8' 9' i7' i8 but those at shorter wavelength e.g. 785 nm were introduced especially in the past few years.i• 2• 7• i3• i4. Despite the great advantage that Raman spectroscopy with NIR excitation light could offer, there are technical challenges to overcome using fiber-optic Raman probe.3 First, achieving a high signal-to-noise (SIN) ratio is difficult because Raman scattering from tissue. is inherently very weak. Second, conventional fiber-optic Raman probe made of bundled silica fibers exhibit strong Raman scattering in the fingerprint region. High background. Raman signal must be interfere the real Raman spectra. To collect Raman spectra from tissue with high SIN ratio, optical design problems including spectral interference from the optical fibers themselves must be resolved.. 3. Development a newly miniaturized fiber-optic Raman probe with high signal-to-noise ratio. In 2009, this optical design problems ofminiaturized Raman probes dramatically solved using a new type of optical fiber, called a hollow optical fiber (HOF) developed by Prof. Matsuura.i9The HOF consists of thin glass capillary tubing with a smooth silver film coating its inner surface, and can delivery light in wide range including NIR region with low loss.i9 It generates very little Raman scattering noise during the laser transmission from core. material because the core material of HOF is air. A newly miniaturized Raman probe, ball-lens mounted hollow-fiber Raman probe (BHRP, Fig. 2) was developed with attaching. 8.
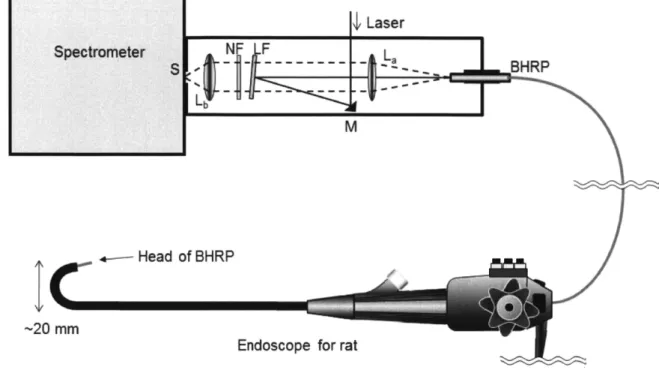
(9) a single ball lens at the distal end of HOF as describes in Chapter 2. So that practically. nought ofRaman scattering noise, BHRP performs to collect Raman signal from any sample. with high SIN ratio. Thus, BHRP have great advantage for optical biopsy using Raman spectroscopy.. The simple design of BHRP brings two merits for Raman optical biopsy system. First, it's not necessary to use an intricate filter system at the distal end ofthe probe. Second,. BHRP can be fabricated not only specialists for optics but also researchers in other field,. even though students like the author. These merits give us the way to make a research of. Raman optical biopsy with low-cost. It means that a high-quality in vivo Raman measurement is available inexpensively and simply by introducing BHRP.. Furthermore, the design strategy of BHRP made a huge improvement in an axial resolution and sensitivity. By introducing a single ball lens to a single HOF, the Raman sampling volume ofBHRP is relatively smaller than that of other types of fiber-optic Raman. probes. A measured working distance and axial resolution of BHRP with a sapphire ball lens are only 28 and 23 um (FWHM) in air (Fig. 3). These are small enough to measure in particular layer in thick-layered biomedical tissues which are already well-known.. BHRP was introduced immediately to a newly-developed optical biopsy system by H. Sato and his collaborators.i The system produced by H. Sato consists ofa miniaturized endoscope, a NIR laser at 785 nm, and a dispersive spectrometer with cooled CCD detector. (Fig .1). Hattori et ali succeeded to measure esophagus of living rat in vivousing the proposed system.. However, for diagnostic use, it is highly desirable to develop a depth-resolved Raman spectroscopic technique because dysplasia-related changes may be associated with. 9.
(10) the thickening of epithelial tissue.4 Axial resolutions of fiber-optic Raman probes in air are. almost ten to several hundred times bigger than a conventional Raman confocal microscope.20 For facilitating the wide applications of Raman spectroscopy in biomedical diagnosis, it is efficient to introduce depth-selected measurement in layered tissue using. fiber-optic Raman probes.. 4. How to achieve Raman depth profiling using BHRP - Optical properties of BHRPs and its application. As written in previous section, axial resolutions of miniaturized Raman probes including BHRPs are relatively much bigger than those of conventional microscopes. To. measure a particular layer by using a BHRP, a depth resolution of the BHRP must be smaller than the thickness of the layer. However, in case of BHRPs, the depth resolution. cannot be improved by modifying any optical configuration. This is because a spatial resolution ofBHRP is limited by an aberration ofa ball lens and a numerical aperture ofthe HOF. To solve this problem, I started trying to imagine an excitation volume, called Raman. sampling volume of a BHRP with thought experimental measurement of a layered transparent material.. Let me consider a place of origin of Raman signals measured by a BHRP (Fig. 4). If a particular layer of a layered sample is thick enough to cover whole Raman sampling. volume ofa BHRP, a Raman spectrum obtained by BHRP includes only pure Raman signal from single layer. But if a thickness of a particular layer is thinner than a Raman sampling. volume of a BHRP, the Raman spectrum has contributions from not only the layer but also. other layers. In other words, when I measure a Raman spectrum by using a probe with a large Raman sampling volume, the Raman spectrum shouldinclude all signals coming from. 10.
(11) inside a whole Raman sampling volume. It means that BHRP can capture all information. within a Raman sampling volume at once including each layer's pure Raman spectrum, chemical compositions and so on. Therefore, I thought that it is possible to extract particular. signal or spectrum ofa particular layer from a Raman spectrumwhich is obtained by BHRP. According to my first inspiration above, I completed to show a potency to extract quantitative information about a thickness ofa subsurface layer by using a BHRP combined with chemometrics as described in Chapter 3. The result proposed a methodology to provide simultaneous determination of the location and chemical composition of subsurface layer. The result is also able to improve a depth resolution ofa BHRP at the same time. Moreover,. I completed to develop a noninvasive subsurface analytical method using multiple BHRPs as described in Chapter 4. I represented a basic theory for explaining a relationship between. spectra from embedded layer and a surface layer thickness of a layered transparent sample.. A pure Raman spectrum of subsurface layer successfully reconstructed using multiple BHRPs with different working distances non-invasively.. These results strongly suggest that my prediction model of Raman sampling volume ofBHRP is essentially correct. Combined with light-scattering effect as described in. Chapter 1, BHRP can assuredly be used to depth-resolved Raman measurement for layered tlssue m vlvo.. 5. Further prospects for measuring layered biomedical tissues using BHRP. BHRP has two major advantages for measuring biomedical tissues and bring new eyes to us for real-time optical biopsy using fiber-optic miniaturized Raman probes. One of the advantages is low signal-noise ratio.This is because very little Raman scattering noise is. 11.
(12) generated from HOF. Another is that we can easily change a working distance ofBHRP by selecting a ball lens at distal end.. I show an example of in vivo optical biopsy of live animal using BHRP in Chapter 5. Particular striking of this study is that Raman spectra of a brain tissue were successfu11y. measured from rats and mice which are kept in a living state. Under anesthesia, the spectra. show differences ofwater condition including water concentration and cluster conformation in the brain. BHRP is sufficiently narrow, flexible enough to measure a brain in vivo and can. bring high-quality Raman spectra. This study opens up a new possibility for brain researchesoflive experimental animals.. Furthermore, in combination with proposal methodologies of Raman depth profiling, I suppose that the system can also be used for in vivo human blood diagnosis in. noninvasive manner (Fig. 5). A working distance ofa BHRP made ofa fused silica lens is several hundred micrometers, enough to achieve capillary blood vessels embedded under. human skin. Thus, we may reconstruct pure Raman spectrum of human blood by using multiple BHRPs noninvasively. Moreover, applying chemometrics, it may be possible to extract quantitative and qualitative information about human blood glucose, human blood. cells and so on. I have completed an application form for a budget about this study. A challenge for noninvasive diagnosis ofhuman blood will be performed by the author and the collaborators in near future.. 6. Thesis outline This thesis consists of five chapters. First, a basic study of scattering effect in. depth-resolved Raman measurement is described in Chapter 1. Second, a new type of. 12.
(13) miniaturized Raman probe is introduced in Chapter 2. Third, a methodology of Raman depth profiling using the Raman probes is reported in Chapter 3 and 4. And last, an in vivo. study using BHRP is shown in Chapter 5 as an important example.. 6-1. Chapter 1: Basic Study of Raman Sampling Volume in Diffusely Scattering. Media In Chapter 1, I experimentally disclose a scattering effect for a depth-resolved. Raman measurement of layered scattering media. An objective lens of conventional Raman microscope is used as an analogue of a BHRP. The layered sample consists of Si wafer, IntralipidTMdilution as light-scattering medium, and silica window.. I investigate a Raman signal from the silicon substrate beneath Intralipid suspension layer with varying a thickness of the scattering layer. Raman collection efficiency depending on the thickness of scattering medium is clearly reported in this section. I also show Raman sampling volume, response curves in depth directionby using Raman signal from embedded layer (Si wafer) through scattering media (Intralipid). I finally. succeeded in this chapter to develop a quantitative model for evaluation of describe an. extinction of Raman signal coming through scattering media detected by lens system quantitatively. These results present a potential ofdepth-resolved Raman measurements for layered tissues using BHRPs.. 6-2. Chapter 2: High axial resolution Raman probe made of single hollow optical fiber. 13.
(14) In Chapter 2, I introduce a miniaturized Raman probe, ball-lens mounted hollow. fiber Raman probe (BHRP). BHRP is specially-fabricated to a newly miniaturized endoscope system,i simply made of single hollow optical fiber and single lens. This miniaturized endoscope is designed for diagnosing diseases of the esophagus, stomach, colon, and rectum in order to continuously study the physiological changes in small living. experimental animals.iWithBHRP, the endoscope system is able to measure in vivoRaman spectra from gastrointestinal tract in rats or mice.. I report a summary of BHRP especially to a structure and optical properties in. depth in this section. Detailed optical properties of the miniaturized Raman probes changinglens materials anddiameters are described here. Merits and weak points of BHRP are also discussed in the same section.. 6-3. Chapter 3: Subsurface Sensing of Biomedical Tissues Using a Miniaturized Raman Probe: Study of Thin-llayered Model Samples In Chapter 3, I discuss a basic knowledge ofa Raman sampling volume ofa BHRP in layered model samples. The model sample consists of two kinds oftransparent polymers.. I also propose a technique to measure a thickness of surface and subsurface layer of two-layered sample using single BHRP in a nondestructive manner. To extract a thickness ofthe first layer, a partial least square (PLS) regression analysis was employed. Curiously, a. shape ofRaman sampling volume ofBHRP in transparent sample is showed up using PLS regression analysis at the same time. A principle of the proposed technique is demonstrated by a simulation study and an empirical study.. 14.
(15) 6-3. Chapter 4: Noninvasive Subsurface Analysis Using MultipRe Miniaturized. Raman Probes: Basic Study of Thin-Layered Transparent Models of Biomedical Tissues. In Chapter 4, I describe a noninvasive approach for subsurface probing using multiple BHRPs with different working distances. The model sample is also made of two kinds of transparent polymers, a polymethylmethacrylate (PMMA) substrate covered with polyethylene (PE) films. I present a theory to reconstruct a pure Raman spectrum of an. embedded layer noninvasively. The theory shows a relationship between a thickness of surface layer and sizes ofRaman sampling volumes ofBHRPs, and indicates a simple way to extract a pure Raman spectrum from embedded layer.I succeeded to extract a pure Raman. spectrum from embedded layer, PMMA, without any invasive measurement experimentally. The method is essentially applicable to other Raman systems, including bundle-fiber Raman. probes, Raman microscopes and so on.. 6-4. Chapter 5: Raman Study of Brain Functions in Live Mice and Rats: a Pilot Study In Chapter 5, I introduce an application of a BHRP for in vivo measurement in small living animals. Brain tissues of live rats and mice under anesthesia are measured using. the BHRP in minimally-invasive manner. This study was successfu11y demonstratedin vivo layered tissue measurements by BHRP. The results would strongly provide us an effective way to study chemical compositions ofbiomedical tissues in vivoat the molecular level.. 15.
(16) References. [1]. Y. Hattori, Y. Komachi, T. Asakura, T. Shimosegawa, G. Kanai, H. Tashiro, and H. Sato, Applied Spectroscopy 61, 6, 579 (2007).. [2]. Z. Huang, S. Teh, W. Zhen, J. Mo, K. Lin, X. Shao, K. Ho, M. Teh, and K. Yeoh, Optics Letters, 758 (2009).. [3]. A. Beljebbar, S. Dukic, N. Amharref, and M. Manfait, Analytical and Bioanalytical. Chemistry, 477 (2010). [4]. J. Mo, W. Zheng, and Z. Huang, Biomedical Optics Express 1, 1, 17 (201O).. [5]. E. B. Hanlon, R. Manoharan, T. W. Koo, K. E. Shafer, J. T. Motz, M. Fitzmaurice, J. R. Kramer, I. Itzkan, R. R. Dasari, and M. S. Feld, Physics in Medicine and Biology 45, 2, Rl (2000).. [6]. M. G. Shim and B. C. Wilson, Joumal ofRaman Spectroscopy 28, 2-3, 131 (1997).. [7]. M. Shim, B. Wilson, E. Marple, and M. Wach, Applied Spectroscopy, 619 (1999).. [8]. H. P. Buschman, E. T. Marple, M. L. Wach, B. Bennett, T. C. B. Schut, H. A. Bruining, A. V. Bruschke, A. van der Laarse, and G. J. Puppels, Analytical Chemistry 72, 16, 3771 (2000).. [9]. J. Motz, M. Hunter, L. Galindo, J. Gardecki, J. Kramer, R. Dasari, and M. Feld,. Applied Optics, 542 (2004). [1O]. Y. Komachi, H. Sato, K. Aizawa, and H. Tashiro, Applied Optics 44, 22, 4722 (2005).. [11]. Y. Komachi, H. Sato, and H. Tashiro, Applied Optics 45, 30, 7938 (2006).. [12]. Y. Komachi, T. Katagiri, H. Sato, and H. Tashiro, Applied Optics 48, 9, 1683 (2009).. [13]. M. A. Short, S. Lam, A. McWilliams, J. H. Zhao, H. Lui, and H. S. Zeng, Optics Letters 33, 7, 711 (2008).. 16.
(17) [14] N. D. Magee, J. S. Villaumie, E. T. Marple, M. Ennis, J. S. Elborn, and J. J.. McGarvey, Journal ofPhysical Chemistry B 1 13, 23, 8137 (2009). [15] Y. Komachi, H. Sato, Y. Matsuura, M. Miyagi, and H. Tashiro, Optics Letters 30, 21,. 2942 (2005). [16] S. K. Teh, W. Zheng, K. Y. Ho, M. Teh, K. G. Yeoh, and Z. Huang, British Journal of. Cancer 98, 2, 457 (2008). [17] T. C. B. Schut, M. J. H. Witjes, H. Sterenborg, O. C. Speelman, J. L. N. Roodenburg,. E. T. Marple, H. A. Bruining, and G. J. Puppels, Analytical Chemistry 72, 24, 6010. (2000). [18] J. Day, R. Bennett, B. Smith, C. Kendall, J. Hutchings, G. Meaden, C. Born, S. Yu,. and N. Stone, Physics in Medicine and Biology, 7077 (2009).. [19] Y. Matsuura, G. Takada, T. Yamamoto, Y. W. Shi, and M. Miyagi, Applied Optics 41,. 3, 442 (2002). [20] N. Everall, I. Priestnall, P. Dallin, J. Andrews, I. Lewis, K. Davis, H. Owen, and M.. George, Applied Spectroscopy, 476 (2010).. 17.
(18) Miniaturized fiber-optic. Forceps channel. Raman Probe. lmage bundle. (Ball-lens mounted hollowfiber Raman probe, BHRP). IIilll$li. Åés.o fpt"K.. EndoscopicRamanprobe rSk y'. at (living). Figure 1. Schematic representation of in vivoRaman measurements using a miniaturized. endoscopic Raman system.. 18.
(19) ,, Working distance (WD, ,"). --"hi--ii Mode filter NA<O.02 Focal. point Ball lens Hollow optical fi ber. (•v1.5m) Figure 2.. ArchitectureofBall-lens mounted hollow-fiber Raman probe (BHRP).. 19.
(20) 40000 Sample (Si wafer) : : : :. s pphire O.5mmÅë. 30000. BHRP. ? •{:•. e. Sapphire O.79mmÅë. g 2oooo. /!i Fus. .fl.. 'i). : : :. ,e. . d silica O.5mmÅë. z. '6. c .Sl. Fused silica O.8mmÅë. E 10000. 100 200 300 400. o. Probe-sample distance z (pm). ' FigureResponse 3. curves ofRaman spectral intensity to probe-sample distances for four. probes with different ball lens. Red lines indicate working distances calculated by a formula (1) in Chapter. 2.. 20.
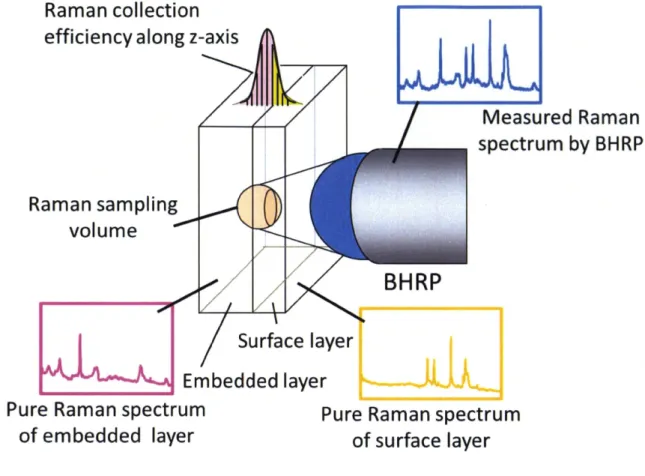
(21) Raman collection efficiency along z-axis. Measured Raman spectrum by BHRP. Raman sampling. volume. BHRP . . - 'ptvsuaVtmauadimal. surface layerl li::;;';;me;}'k"."'.I'ki-tsi•ej:li',sptN. Embedded layer Pure Raman spectrum ofembedded layer Figure 4.. Pure Raman spectrum of su rface 1ayer. Raman sampling volume ofBHRP in layered sample.. 21.
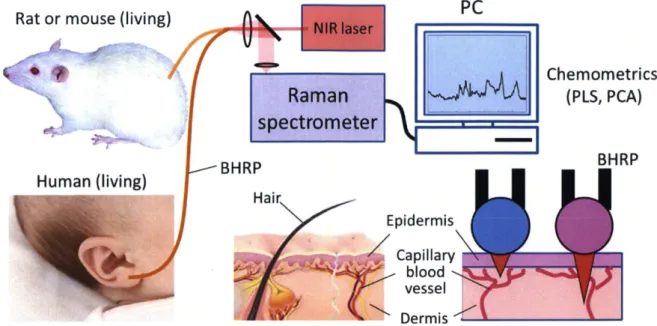
(22) PC. Rat or mouse (living). N1Rlase.r-.'. A• .ry,"')""rr.Ti,tw"e'•,.)..,,. (fe" s. •st"L-k. '. e Raman. tX"ll!1"ii""'t"',',',"2"wh"en""v.. Y;. Chemometrics (PLS, PCA). spectrometer Human (IMng) •-- •-. ;"1,':i/1-i':.?`'e.X'.." f-• ?"`. '"'. ,'. BHRP. BHRP .l#•. Hair Epidermis •erti. fpt. Capillary. ' 9,i2g,q. 'st.la--til. ..r7l-Nz- Dermis. Figure 5. Proposed scheme of optical. biopsy system for in. BHRP.. 22. vivo blood analysis. using.
(23) Chapter 1. Basic Study of Raman Sampling Volume in Diffusely Scattering Media. 23.
(24) Abstract To quantitatively evaluate a scattering effect on Raman sampling volume in layer. structured samples, which is common for biomaterials including skin, we experimentally. and theoretical developed a simple model using conventional Raman microscope. We showed shapes of Raman sampling volumes along depth direction both in air and in scattering condition. The layer structured samples are Si wafer covered with aqueous dilution of IntralipidTM as a scattering media, and silica window. We succeeded to develop a. quantitative model for evaluation of an extinction of Raman signal coming through scattering media detected by lens system quantitatively. A simple function introduced from. Lambert-Beer's law was well fitted to the experimental results. In combination with a previous report, the model is usefu1 for application of fiber-optic Raman probes to real biomaterials.. 24.
(25) Introduction. Raman spectroscopy is a promising tool for in situ diagnosis of epithelial precancerous region. It provides information of molecular compositions from live tissue. without labeling or staining processes.i'2 In the past decade, fiber-probe Raman spectroscopy has become a more prospective method for real-time "optical biopsy" in place. of conventional biopsy.3 For most medical application, fiber-optic Raman probes must be thin, generally smaller than 1-2 mm in diameter, to apply to in vivo observation of human organs and tissue for incorporation into needles, endoscopes, angioscopes and other clinical. devices.4 Several types of Raman probes which meet these criteria are reported previously6'i3 and have been applied for in vivo measurements with an endoscope.3' iO' i2. Meanwhile, analyzing Raman spectroscopic information emitted from tissue still remains complicated for tissue diagnosis and characterization.i'6 The main reason is that the overall. Raman signals acquired from the tissue surface usually contain a mixture of Raman information originating from different tissue depths. To clarify the origins ofRaman signals. collected from tissue by using Raman fiber-optic probes experimentally, it is highly important to depict a sampling volume of the Raman probe which is introduced for in vivo. measurements. However, to investigate a shape of a sampling volume inside scattering media is very difficult because several optical parameters (e.g. absorption coefficient, scattering coefficient, anisotropic factor, refractive index) are may significantly affect it. Moreover,. sampling volumes of fiber-optic Raman probes must be different from one probe to another depending on the optical designs. For these reason, we should measure or calculate a shape. of Raman sampling volumes one by one. Early experimental trials have been reported by. 25.
(26) Shim et al.6 and Komachi et al.9 In both studies, a phantom target was placed in a container fi11ed with scattering liquid and then the probe was retracted from a contact position to the. phantom step by step on the order of hundreds of micrometers. Their results successfu11y showed a shape ofthe sampling volume oftheir own probes in turbid liquid, however, these results are essentially not applicable to the other probes directly. Another way to speculate a. sampling volume's shape of one's own probe in turbid media is to measure that in air condition. The results have been shown by J. Motz, Komachi and Katagiri.5' 9' ii' i4 The other. way to speculate that in transparent polymer substances is shown in our previous study.i5. For one of our fiber-optic Raman probe namely Ball-lens mounted hollow-fiber Raman probe (BHRP),ii the function representing the Raman sampling volume along the depth direction is Gaussian curve in those substances. Nevertheless, the Raman sampling volume in turbid media such as biomedical tissue must be different from these results because ofthe. several optical parameters including scattering effect. In other studies, the Monte Carlo. (MC) simulations have been introduced to calculate the spatial distributions of Raman sensitivity of fiber-optic Raman probes using several optical properties of samples.i' 2' i6 Mc. is a powerfu1 method because it is applicable to a wide range of fiber-optic Raman systems, however, there are substantial needs for experimental study to understand the principles of. Raman sampling volumes in turbid media comprehensively. Although Reble et ali6 succeeded to combine MC simulation and experimental results quantitatively using several optical properties such as absorption coefficient pt., scattering coefficient #,, and Raman scattering cross-section c, the alternative inspection is necessary to clarify the meaning of. optical parameters for the shape of Raman sampling volume using another experimental approach.. 26.
(27) In the present study, we focused on scattering effect ofturbid media for the size of Raman sampling volumes experimentally and quantitatively by using a scattering coefficient. pt,. A lens of Raman microscope is used as an analogue of fiber-optic Raman probe to clarify the scattering effect in several tens to hundreds micrometers. The confocal cross-slit. of the Raman microscope was broaden compared with standard setting to broaden the focal volume of the lens similar to conventional high-volume fiber-optic Raman probes. We drew. out a Raman collection efficiency along the depth direction from whole Raman sampling volume because the analysis in depth direction is very important for diagnostic application.i'. 2• i5• i7 To eliminate the absorption effect, we used Intralipid suspension as an scattering. sample and applied 514 nm laser source. Conventional Lambert-beer's law leads a simple formula ofRaman signal coming from inside layered sample quantitatively and the formula was connected to scattering coefficient #, directly in this study. We note that the present results are well agreed with the report by Reble et al.i6. Experiments a. Instrumentation.. Raman spectra were acquired using an ultra-high-performance Raman microscope (Photon Design Corporation, Japan). The Raman microscope system consists of Ar+ laser. (Spectra Physics, U. S. A.); deep-depletion CCD camera (2048 Å~ 512 pixels at 13.5 umx13.5 um per pixel; image area 27.6 mm Å~6.9 mm, -120Åé, Princeton Instruments); spectrograph (PDP320, f=: 320mm, F14.9, range ofwavelength O-13000A(at 1200 gr 1 mm), Photon Design Corporation, Japan); ultra-long working distance objective lens (Photon. 27.
(28) Design Corporation, Japan); and a variable cross-slit in front of a vertical slit of a spectrograph. The cross-slit was set to 1000 um to broaden a spatial resolution ofa 9Å~ objective. lens (NA O.28) than conventional Raman confocal microscope. The measured spatial resolution of the objective lens along z-axis was 170 um as a fu11 width at half-maximum. (FWHM) (Fig. 1). The 514 nm line of the Ar+ laser was employed as a light source. The laser power was typically 80 mW at the sample and the exposure time was typically 60 s. Raman scattering was collected in a 1800 back scattering geometry. The spectral resolution. was 5 cm-i.. b. Samples and Data processing. 10 O/o Intralipiduv stock solution purchased from Fresenius Kabi (France) was introduced as a light scattering medium. The stock solution was diluted with distilled water to O.1 - 1.0 O/o and mix slowly by upside-down and used within several hours. The scattering coefficient pt, of 1O O/o stock solution was obtained by Staveren et al.i8. The layered model samples consist ofO.1 - 1.0 O/o intralipid suspension and silicon substrate as shown in Fig. 1. Thicknesses ofthe intralipid suspensions are varied with 50 um. to 800 um by changing a spacer made ofpolytetrafluoroethylene (PTFE). A background spectrum originating from a silica window covering the intralipid suspension. was subtracted from raw Raman spectra. Zero depth (A=O) in Fig. 3 was defined as the. maximum point ofRaman signal which is measured by Raman microscope by changing the distance between the sample and the lens. The error limit was within 10 um along depth. 28.
(29) direction. The fitting calculations in Fig. 3 were performed by Origin 8.5 software (Lightstone corp., Japan). Results and discussion a. Raman Sampling Volume along Depth Direction under Scattering Condition. Figure 2 shows a typical Raman spectrum dataset measured from a layered sample with changing the distance from sample's surface and lens as shown in Fig. 1. The layered sample consists of Si wafer, 0.5 O/o intralipid suspension and silica window. To emphasize a. feature of the scattering layer and the embedded Si layer, a spectrum originating from a. silica window covering the intralipid suspension was subtracted from raw Raman spectra dataset individually. A sharp band at 519 cm'i is assigned to Si-Si bonding in the Si wafer. and bands at 1439 and 1654 cm-i are assigned to C-H deformation and C=C stretching modes of the lipid vesicle in Intralipid suspension. A broad band due to water at 1640 cm'i overlaps the band due to the C=C stretching mode.. As shown in Fig.2, we succeeded to measure both layer of Si wafer and Intralipid layer at the same time. And the spectral features changed depending on the distance between the sample and the lens. The result indicates that the sampling volume ofthis setting is large enough to cover both layers by not only a focal point ofthe lens but also surrounding area. It suggests that the optical setting ofpresent work is similar to that of fiber-optic Raman probe. as we described in previous work.i5. Figure 3 depicts Raman response curves along depth direction determined in air, water, and O.5 O/o Intralipid suspension. Band areas at 519 cm-i were plotted against the. sample-lens distance as described in Shim et al.6 These curves were well fitted by Voigt. 29.
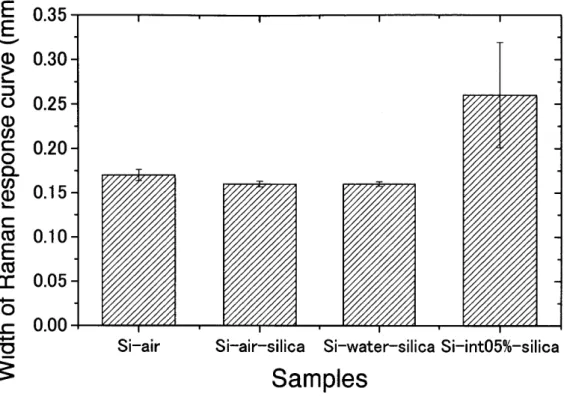
(30) function. Figure 4 indicates a difference of the full width at half maxima (FWHM) of the. Raman response curves shown in Fig. 3. It is clear from Figure 3 and 4 that the FWHM of the response curves are slightly changed due to the refractive indexes of materials, and strongly affected by the scattering effect of them. FWHM of O.5 O/o Intralipid becomes 1.5 times larger than that of air and water.. b. Attenuation ofRaman Signal Passed Through Scattering Media b-1 . Theoretical Approach describing Quantitative Raman Signal through Scattering Media. using Lambert-Beer's Law Let us consider total amount of Raman signal generated from inside the scattering media macroscopically. The basic property of light attenuation written by Lambert-Beer law is given by:. (z) =Uoexp(-ptz) -----(1) Where Uo is the intensity of radiation energy, pt is an extinction coefficient. This basic. formula simply shows that a collimated beam is attenuated in a media of thickness z. Note that the extinction coefficient is connected with the extinction cross section 6t as pt=p6t, where p is the density ofparticles. i9. Raman signal which is generated inside media by incident light is also attenuated as. shown in Lambert-Beer's law. Thus,. URaman(Z) = UORamaneXP(-pttZ) "-"(2) Then the intensity of Raman scattering light must be proportional to the intensity of radiation energy. 20. UORaman(Z) OC U(Z) = UOeXP(-#tZ) --"-(3). 30.
(31) UORaman (Z) =A' UoexP(-#tz) --e"(4). URaman (Z) = A'Uo'exp(- pz)eexp(-#tz) -----(5) URaman (Z) =A' UO ' exp('2pttz) '""'"•--(6) Where A is constant. The extinction coefficient #t can be separated to the absorption. coefficient ". and the scattering coefficient #, as #t =#.+#,. When the scattering media doesn't absorb the excitation light which is used in Raman measurement, the absorption coefficient ". is zero and the extinction coefficient #t must be equal to the scattering coefficient pa,. Therefore,. #t = pts =pa, ----(7) b-2. Comparison Theoretical Approach to Experimental Results Figure 5 shows an experimental result of Raman signal's attenuation in different. concentration of the scattering media which is measured as shown in Fig. 1. The band intensities at 519 cm'i generated from the Si wafer were plotted as a function of the thicknesses of scattering layer for O.1 O/o, O.5 O/o and 1.0 O/o Intralipid suspension. The. absorption coefficient #. of 10 O/o Intralipid suspension at 514 nm is o.gg Å~ lo'5pm-ii8 and negligible in this studybecause it is minus four orders of magnitude of pt,. The solid. lines were fitted by z = zO + A • U - exp (- 2"t z) re ferring from Eq. 6 and the fitted parameters are shown in Table 1. Ofnote is that the parameters #t in Table 1 obtained by the fitting calculation are very reasonable to that of 1O O/o Intralipid obtained by Staveren et al.i8 As shown in Eq. 7, if. the sizes and the number ofparticles in Intralipid suspension does not changed by dilution with water, an extinction coefficient ptt must be proportional to a density of particle p.. Therefore, the "t of O.1, O.5 and 1.0 O/o Intralipid suspension should be a hundredth,. 31.
(32) twentieth and tenth part ofthe "t of 10 O/o. From Table 1, the "t ofO.5 and 1.0 O/o are well. agreed with that of 10 O/o and the errors in the results are within ten to twenty percent. However, the ptt ofO.1 is twice larger than that of 10 O/o. These results might show that the size distribution of Intralipid doesn't change significantly at the concentrations from 1O O/o to O.5 O/o, while that might be change at that ofO.1 O/o.. The present results demonstrate that the present theoretical model is potentially usefu1 to estimate of Raman signal coming through a scattering medium quantitatively. It should be noted that the present results which is simply based on the Lambert-Beer's law. are totally agreed with that of Reble et al. which were calculated based on the MC simulationi6. As we described in this paper, our approach focused on the extinction of Raman signal from embedded substrate due to the scattering effect without any absorption.. Although Reble et al.i6 used both reduced scattering coefficient #,! and absorption coefficient pt. to fit a MC simulation to their experimental results, the models in Reble et al.i6 are well fitted to our present results. Then we concluded that the present model is much. simpler and easier to make a prediction of Raman sampling volume of fiber-optic Raman probes in light scattering samples. Moreover, according to the result of Reble et ali6 and the. present one, a coefficient of absolute Raman signal #R....i6 seems to be connected generally to UR....(z) in Eq. 6. in the present study as a function of depth in scattering sample.,. 32.
(33) Conclusion We show a prediction for Raman sampling volumes of fiber-optic Raman probes along depth direction under scattering condition. We introduced a conventional Raman microscope as an analogue of fiber-optic Raman probes. The Raman response curves along depth direction were well fit by Voigt function. Scattering phantom was made of O.1 to 1.0 O/o Intralipid suspension. Compared with no scattering condition, the response curve in scattering condition extended to 1.5 times in depth direction. Very little effect is appeared by refractive indexes of layered samples including scattering media.. We also propose a quantitative analysis of Raman signal from embedded Si wafer coming through scattering layer. Our results simply show that the Raman signal is extinct. while through a scattering layer exponentially. And in case of no absorption, the total. amount of Raman signal measured by a lens system can be described by a simple equation introduced from Lambert-Beer's law. This result is well agreed with Reble et al.. 33.
(34) References [1]. M. Jianhua, Z. Wei, and H. Zhiwei, Biomedical Optics Express 1, 1, 17 (201O).. [2]. C. Reble, I. Gersonde, C. A. Lieber, and J. Helfmann, Biomedical Optics Express 2, 3, 520 (2011).. [3]. Y. Hattori, Y. Komachi, T. Asakura, T. Shimosegawa, G. Kanai, H. Tashiro, and H. Sato, Applied Spectroscopy 61, 6, 579 (2007).. [4]. E. B. Hanlon, R. Manoharan, T. W. Koo, K. E. Shafer, J. T. Motz, M. Fitzmaurice, J. R. Kramer, I. Itzkan, R. R. Dasari, and M. S. Feld, Physics in Medicine and Biology 45, 2, Rl (2000).. [5]. Y. Komachi, T. Katagiri, H. Sato, and H. Tashiro, Applied Optics 48, 9, 1683 (2009).. [6]. M. Shim, B. Wilson, E. Marple, and M. Wach, Applied Spectroscopy, 619 (1999).. [7]. Y. Komachi, H. Sato, K. Aizawa, and H. Tashiro, Applied Optics 44, 22, 4722 (2005).. [8]. Y. Komachi, H. Sato, Y. Matsuura, M. Miyagi, and H. Tashiro, Optics Letters 30, 21,. 2942 (2005). [9]. Y. Komachi, H. Sato, and H. Tashiro, Applied Optics 45, 30, 7938 (2006).. [1O]. M. A. Short, S. Lam, A. McWilliams, J. H. Zhao, H. Lui, and H. S. Zeng, Optics Letters 33, 7, 711 (2008).. [11]. T. Katagiri, Y. Yamamoto, Y. Ozaki, Y. Matsuura, and H. Sato, Applied Spectroscopy, 103 (2009).. [12]. Z. Huang, S. Teh, W. Zhen, J. Mo, K. Lin, X. Shao, K. Ho, M. Teh, and K. Yeoh, Optics Letters, 758 (2009).. 34.
(35) [13]. N. D. Magee, J. S. Villaumie, E. T. Marple, M. Ennis, J. S. Elborn, and J. J. McGarvey, Journal ofPhysical Chemistry B 1 13, 23, 8137 (2009).. [14]. J. Motz, M. Hunter, L. Galindo, J. Gardecki, J. Kramer, R. Dasari, and M. Feld, Applied Optics, 542 (2004).. [15]. Y. Yamamoto, Y. Oshima, H. Shinzawa, T. Katagiri, Y. Matsuura, Y. Ozaki, and H. Sato, AnalyticaChimicaActa, 8 (2008).. [16]. C. Reble, I. Gersonde, S. Andree, H. J, Eichler, and J. Helfmann, Journal of Biomedical Optics 15, 3 (2010).. [17]. Y. S. Yamamoto, H. Sinzawa, Y. Matsuura, Y. Ozaki, and H. Sato, Applied Spectroscopy 65, 8, 34 (2011).. [18]. H. J. Vanstaveren, C. J. M. Moes, J. Vanmarle, S. A. Prahl, and M. J. C. Vangemert,. Applied Optics 30, 31, 4507 (1991). [19]. V. Tuchin, Tissue 0ptics: Light Scattering Methods and instruments for Medical Diagnosis (SPIE press, USA, 2007), 2nd ed.. [20]. Raman bunko-hou (Raman spectroscopy) (GakkaiShuppan Center, Japan, 1988).. 35.
(36) Å~9 Lens of Raman mlcroscope. Raman response curve along z- axis. FWHW 170um in air n=1 .oo). Silica window. [. Air (n=1 .00). Sample Water (n=1 .33) O.1-1 .0 O/o lntralipid. (n=1 .45). (n=1 .34). O.3mm Spacer •'.•';'".;'f-x. Layered sample. Silicon wafer. Figure. 1. Schematic representation of Raman measurements for layered. . scatterlng. medium. 9Å~ microscope objective lens was introduced with relatively larger. confocal. cross-slit to broaden a spatial resolution ofthe lens.. 36.
(37) 519 1654. >. 1439. a. ...-". co. = o b =. --M,,,,. -. c d. 02. 400 600 800 10001200140016001800 Raman Shift (cm-i). Figure 2. Raman spectra dataset acquired from layered scattering sample with changing the distance from sample's surface and lens. The concentration and the thickness of scattering media is O.5 O/o and 800 um, respectively. The position ofthe objective lens are (a) O.6mm, (b) O.4mm, (c) O.2mm, and (d) -O.9mm from the focal point, respectively.. 37.
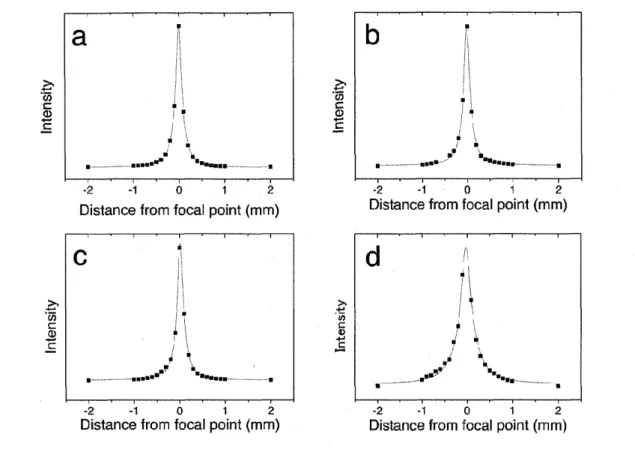
(38) -'g -'g. #mt.t.i ;-.t{-- l-opointt 2 -2Distance "•ofrom a focal 2 point (mrn) Distance-2 from-l focal <mrn). ttttttttt tttt. tt ttt.tt.... '. d if}i il. .,;.N., ..,, 11iiilil,.. -es , 'a i'l. -'O"cr v.-. ' '" '"".. ..".". .. St "wh..Hpt.....-..".v".!ii L''in.Nit...--......".-.. -'"" '-'t. -2 -1 O 1 2 -2 -1 e 1 2. Distance frorri focal point <rnm) Distance from focal point (mm). Figure 3. Raman response curves of spectral intensity at 519 cm-i along z-axis which are measured with layered samples made of (a) Si-air, (b) Si-air-silica, (c) Si-water-silica and (d) Si-O.5 O/o Intralipid-silioa as shown in Fig. 1. The z=O was set at the maximum point of Raman signal. These curves were fitted by Voigt function (solid lines).. 38.
(39) E o.3s A E O O.30. ->. :i. o O.25. o co = O.20 o. g 8 o.ls. = di O.10 E as. C O.05 -o `.- O'OO pii:. Si-air. Si-'air-silica Si-water-silicaSi-int050/o-silica. Samples. Figure 4. FWHMs of Raman response curves along z-axis which are shown in Fig. 3. significant figure Was two.. 39. The.
(40) 60. "A. o r 50 lE 40. i. 'N,. Eco 30 5. 8 2o. y.. 9 io. x x xx xÅ~-.-. xx. t. -Å~4. .NS...x-. -. N XL.,.. Å~. o. $-----•----------e tis c: cs`i. "`. 8. Thickness of scattering media (ptm). Figure 5. Response curve of the Si 519 cm-1 band obtained from a Si wafer beneath a scattering layer which is made of (A) O.1 O/o , (e) O.5 O/o and (-) 1.0 O/o Intralipid suspension.The solid lines were fitted by z = zO +A • U • exp(-2pttz) refening from Eq. 6. and the fitted parameters are shown in Table 1. The measuring points were defined as the. maximum point ofRaman signal searched by changing the distance between the sample and the lens.. 40.
(41) Table 1. Fitted parameters calculated in Fig. 5.. Intra1ipidTM. o.Io/, O.so/, 1.oo/. 1001o ref. 2. zO. A. U. "'t' ij l'ts. ( m-1}. 129253 428813 -O.O0234 O.OO12 2066 608056 -O.O0619 O.O031 IS958 929775 -O.O1387 O.O069 O.077. 41. p {density of 6 article, rate). 1. 5. 10 100. (extinction cross section, rate). 120 62 69 77.
(42) Chapter 2. High Axial Resolution Raman Probe Made of Single Hollow Optical Fiber. 42.
(43) Abstract A ball lens mounted hollow optical fiber Raman probe (BHRP) consisting of a single hollow optical fiber (HOF) and a micro-ball lens was developed for performing a high-axial resolution and high-sensitivity remote Raman analysis ofbiomedical tissues. The. totaldiameter of the probe head is 640 pm. The BHRP is useful in the measurement of thin-layered tissues that are in contact with the probe's surface because the probe has a limited depth-of-field optical property. An optical calculation studysuggested that it is. possible to vary the probe's working distance by selecting different materials and diametersfor the ball lens. Empirical studies revealed that this probe has a higher axial. resolution and a higher sensitivity than an HOF Raman probe without the ball lens.. Thespectrum of a mouse stomach measured with the BHRPhad better quality and considerably lowernoisethan that measured with a conventional Raman microscope. These results strongly suggest that the BHRP can be used effectively in biomedical applications.. 43.
(44) Introduction A miniaturized Raman probe is an attractive tool for the in vivo measurement of living tissues. It can beused with an endoscope to directly observe diseased tissues in a. noninvasive or a minimally invasive manner. These narrow fiber-optic probes have been developed by several groups and have been applied to the study of biological tissues. i-3A. Raman probe with a diameter of 1.5 mm was developed by Shim et al. for performing in vivo medical Raman spectroscopy.iMotzet al. developed a Raman probe (diameter: 2 mm) equipped with filters and a ball lens following Shim et al.'s optical design strategy in order. to optimize the collection efficiency and minimize the noise of the Raman probe.2 The performance of Motzet al.'s probe was tested by conducting simulations and experiments using tissue models and several in vitro tissue types. Further,Komachiet al, developed a. micro-Raman probe with a diameter of O.6 mm for intravascular application. The abovementioned three miniaturized Raman probes are made of bundled optical fibers and equipped with an optical noise filtering system made of band-pass and long-pass filters for. suppressing the fluorescent and Raman background noisedue to the core materialof the optical fibers.3The technological hurdle of constructing a narrow fiber-optic Raman probe. can be eliminated by using the high-wavenumber region (20004000cm-i) of a Raman spectrum. Because no Raman signal is generated in the fiber itself in this spectral region, a single optical fiber can be used for guiding the laser light to the tissue and collectingthe. scattered light.46Kolhenovi6 et al. used the single fiber-optic Raman probe for examining a. sliced porcine brain and succeeded in distinguishing between adjacent brain structures on the basis of their biochemical composition.5Nijssen et al. used the single fiber-optic probe. for obtaining high-wavenumber (2800 to 3125 cm-i) Raman spectra ofbasal cell carcinoma. 44.
(45) and perilesional biopsy specimens.6In contrast, Komachiet al. developed a different type of. miniaturized Raman probeby using a hollow optical fiber (HOF).7 This HOF consists ofthin glass capillary tubing with a smooth silver film coating its inner surface, giving it unique. characteristics.8'9 It generates no Raman scattering or fluorescence noise during the laser. transmission. This property brings two major advantages to the Raman probe made by using an HOF. One is that the complex filter system at the distal end ofthe probe is unnecessary,. and the other is that the single HOF can be used bidirectionally, i.e., for sending the excitation light and for collecting the Raman scattered light.. We developed a miniaturized endoscope system for diagnosing diseases of the esophagus, stomach, colon, and rectum in order to continuously study the physiological. changes in small living experimental animals.iO The endoscope has a small channel (diameter: 800 pm)that guides the miniaturized Raman probes to the measuring point. In our. recent experiments, it was found that the Raman probe should be used in contact with the. sample surface for the best measurement because the tissues in a living body beat continuously because ofblood pulsation and breathing. It is difficult to hold the focus on the. beating tissue surface. It is also preferable for the probe to have a limited depth-of-field optical property for the analysis ofthe layered structure ofmany tissues such as the stomach. wall and skin. Boereet al. adjusted the focal length ofa Raman probe by placing a quartz or. CaF2 window at the end of the probe tip in order to limit the actual measurement volume near the surface in the measurement ofBarrett's epithelium.ii. We have reported a brief summary ofa miniaturized Raman probe made ofa single HOF with a ball lens in the previous work.i2 In the present paper, the detailed optical properties of the probe are described along with a method to control the probe's working. 45.
(46) distance and weak point. The HOF has a considerably smaller numerical aperture (NA) than. conventional glass fibers.7 A small NA is generally considered to be a disadvantage in. optical devices; however, in the case of the BHRP, this property plays a key role in realizinga high axial resolution.. Experimental a. Fabrication ofBHRP Figure 1 presentsthe structure and a photograph of the head of the BHRP. The probe is made of a single HOFthattransmits both excitation and collected light. The HOF. (core diameter: 320 pm, outer diameter: 435 pm, and length: 1.5 m) was fabricated by coating a thin silver film on the inner surface of a flexible glass capillary tube.8'9A ball lens. was mounted on an Al sheath and sealed with an epoxy resin in order to prevent water leakage. Then, the sheath was glued to the distal end ofthe HOF. A fiber chuckwas attached to the other end ofthe HOFto attach to the fiber coupling stage.The mounting position ofthe ball lens was modified in order to improve the efficiency ofthe contact ofthe top ofthe ball. lens to the sample as compared to the BHRP reported previously.i2 In the present study, two kinds of ball lenses were utilized:a ball lens (diameter: 400 pm) made of sapphire glass and. purchased from Edmund Optics (USA) and a ball lens (diameter: 500 pm) made of fused silica from Swiss Jewel Co. (USA). The total diameter ofthe probe head was 640 pm.. b. Raman system setup Figure 2 represents an optical setup ofa coupling stage for the BHRP. The 785-nm excitation light from a background-free electronically tuned Ti:sapphire laseri3'i4 (BF-ETL,. 46.
(47) homemade, pulse repetition rate: 1.8 kHz) is reflected by a long-pass filter (LF, cut-off at. 795.2 nm), and then focused into the HOF-Raman probe via a lens (L,, focal length: 150 mm). The returned light, which includes Raman scattered light,is then collimated by lens La.. This light passes through the long-pass filter LF and the 785-nm notch filter (NF, Kaiser. Optical Systems Inc., USA) and is focused by lens Lb (focal length:80 mm) onto slit S. (width:IOOpm). The Raman spectra were recorded with a single polychromatic Raman spectrometer (F14.9,focal length: 320 mm, grating: 600 grlmm, blaze: 750 nm, Photon. Design Co. Ltd., Japan) and a CCD detector (DU420-OE, Andor Technology Co. Ltd.,. Northern Ireland). For making the Raman microscope measurements, a conventional microscope head with an objective lens (O.4 NA, M PIan NIR 20Å~, Mitutoyo Co. Ltd., Japan) was attached to the Raman spectrometer.. Results and Discussion a. Optical properties ofthe BHRP. A silicon wafer sample with a smooth surface was measured with three types of Raman probes in order to evaluate theoptical properties of these probes in the depth direction, such as the axial resolution and the location ofthe focal point. A comparison was. then made among the three probes that utilized the same HOF. Probe A had a sapphire ball lens (diameter: 400 pm) having a refractive index of 1.76. Probe B had a fused silica ball lens (diameter: 500 pm)having a refractive index of 1.45. Probe C did not have a ball lens.. The curves in Fig. 3 represent the intensities ofa strong silicon Raman band at 519 cm-i plotted as a function of the sample probe distance measured with the probes. The response curve of probeC was almost flat in the measurement range because of the small. 47.
(48) NA of the HOF, as reported by Komachiet al.7 In contrast, the response curvesofprobes A. andB had maximums at 28 and 220 pm for the sample-probe distances, suggesting that the BHRP has a limited depth-of-field optical property. In the following discussion, the distance from the topsurface ofthe ball lens to the sample point at the maximum intensity is referred. to as the working distance (WD) ofthe BHRP. The maximum signal intensities ofprobes A and B were, respectively, approximately twelveand three times larger than the intensity of probeC, i.e., the probe without the ball lens.These results indicate that the sensitivity of a. Raman probe made of HOF is dramatically improved by attaching a ball lens at the probe head. The small NA of HOF is considered to play the role of a modal filter, which passes only well-collimated light to the HOF. The hollow fiber very preferentially transports light. that has a minimum interaction with the hollow fiber walls. The light entering the hollow. fiber at considerably large incident angles (light path A in Fig. 1) has many relatively high-loss reflections against the hollow fiber wall and is hence lost. The light that reached the ball lens at the end ofthe hollow fiber is almost collimated and can therefore be focused.. For the same reason, light scattered from the laser focus and collected by the ball lens is recollimated when it travels through the hollow fiber (light path B in Fig. 1). Light scattered. from other locations does not enter the hollow fiber in a collimated beam and will therefore. experience more interactions with the hollow fiber wall and be lost.As a result, the well-known weak point ofthe HOF,which transports only collimated light or light having as little interaction with the hollow fiber wall as possible very well, is turned into an advantage by placing the ball lens at the tip ofthe fiber.This results in the limited depth-of-field optical. property of the probe. The response curves suggest that the shorter the probe focal length,. the higher is the probe sensitivity.The depth resolutions, which are defined by the FWHMs. 48.
(49) ofthe response curves in Fig. 3, are estimated to be 23 pm for probe A and 1 1Opm for probe B. A conventional miniaturized fiber-optic Raman probe consisting of multiple glass fibers is supposed to have a focal depthof more than several hundred micrometers. It is suggested. that the BHRP has an advantage in subsurface Raman measurementsbecause of its high axial resolution, as compared toa miniaturized fiber-optic Raman probe.i-3. Figure 4 depicts the Raman spectra of a two-layer model sample, consisting of a 100-pm-thick polyethylene (PE) layer and a poly(methylmethacrylate) (PMMA) substrate,. measured with probesA and B. The measurementswere canied out with the probes held perpendicular to the substrate, in contact with the surface of the PE layer (as shown in Fig.. 1). The Raman bands at 1118, 1289, and 1434 cm-i observed in spectrum (a), measured. with probe A, were assigned to the C-C stretching mode, CH2 twisting mode, and CH2 bending mode of the PE, respectively. Those at 799, 976, 1448, and 1731 cm-i observed in. spectrum (b), measured with probe B, were assigned to the CH3 rocking mode, C-O stretching mode, CH2 bending mode, and C=O stretching mode ofthe PMMA, respectively. Spectra (a) and (b) resemble those of pure PE and PMMA very well, although trace bands due to the PE were observed in spectrum (b). According to their WDs, the focal points of probeA and probeB were in the PE and PMMA layers, respectively, suggesting that isolated. information at the focal pointswas obtained by using the BHRP. The resultssuccessfu11y demonstrated that the BHRP has a limited depth-of-field optical property and that its wn can be varied by selecting different focal lengths for the ball lenses.. The BHRP will be used in a miniaturized endoscope system reported in ref. 1O. The probe will be used under a bending condition as shown in Fig. 2. The head ofthe endoscope. has an angle section with a curvature radius of approximately 10 mm. Consequently, the. 49.
(50) performance of the bent BHRP is examined when the probe is used in the endoscope. The curves in Fig. 5 show the attenuation of the excitation energy and Raman signals when the. BHRP is curved. The probe is bent at an angle of ei near the coupling stage, with a curvature radius of200 mm. When ei reaches 1800, the probe is bent at an angle ofe2 near the distal end, with a curvature radius of 10 mm. The HOF has high flexibility, but its transmission efficiency decreases when it is bent. Curve (a) depicts the attenuation of the excitation power. It shows that the excitation power was reduced almost proportionallyto the total bent angle, but was independentofthe curvature radius. In contrast, it seems that curve. (b), showing the Raman intensity, has a sharp reduction when the probe is bent with a small. curvature radius, showing a strong dependency on the curvature radius. This fact suggests that the optical pathways for the excitation light and the collected light are different, even in. the single HOF in the BHRP. This result suggests that the BHRP is suitable for use without strong bending.. b. Theoretical study ofthe working distance and depth resolution forthe BHRP The theoretical working distance(MDt) for the ball lens to the collimated paraxial incident light is estimated by using the following equation:. Dnmed (nbau - 2). mD,= 2(2nmed -nbau mnbaunmed) (1). where D is the diameter of the ball lens and nmed and nb.ii are the refractive indexes of the. surrounding medium andball lens.In the present BHRPs, the surrounding mediumwas air, wherenmed = 1 and the calculated PVDt values were 32 pm for probe A and 153 pm for probe. B. The given function suggests that it is possible to control the working distance by. 50.
(51) selecting materials with differentrefractive indices andror varying the diameter of the ball. lens. The theoretically calculated WDs of the BHRP with various lenses are presented in Table 1. The measured WD agrees well with the theoretical value, but these values are not. identical.The optical property of the HOF is considerably different from that of the conventional glass optical fiber. In principle, a transmission mode thathas the highest transmitting efficiency has a Gaussian-like distribution in the HOF cross section when the fiber is held linearly. However, in the empirical study, the unavoidable slight bent of the HOF and/or subtle deviation ofthe incident angle might result in a mode transition from the. Gaussian-like mode to another mode such as a ring shape mode. The ring shape mode consists of a ray having a large spread angle that elongates the effective focal length. In contrast, the spherical aberration ofa ball lens might shorten the effective focal length. The. difference between the measured and theoretical WDs seems to be attributed to the. abovementioned phenomena. An attempt was made to use ball lenses made of other glass materials, as well as gradient-index (GRIN) lenses instead of the ball lens, but it turned out that the strong. fluorescent andlor Raman emission from the lens material often caused interference, resulting in weak Raman signals for the biological tissues. Accordingly, out of the lenses investigated, only ball lenses made of sapphire glass and quartz were found to be adequate. for the entire range (O-4000 cm-i) ofRaman measurementsin the case ofthe tissue samples.. c. Measurements for biological tissues. Figure 6 shows the Raman spectra of the resected stomach of a rat measured. withprobe A and with a conventional Raman microscope. Both spectra were measured. 51.
(52) under the same excitation power, exposure time, slit width, and Raman system, with the only difference being the objective heads ofthe BHRP and the microscope. The laser power was 29 mW at the sample and the exposure time, 60 s. The spectra shown in the figure are raw and are not treated for baseline correction. Bands marked * appearing below 600 cm-i. are due to the interference from the LP and notch filters. A sharp band at 1560 cm-i observed only in spectrum (b) was assigned to the oxygen in the air contained in the HOF of. the BHRP. The Raman bands at 367, 407, 630, and 738 cm-iobserved in spectrum (b) were assigned to the vibration modes ofsapphire, the material ofthe ball lens. It should be noted. that the intensities of these unnecessary bands generated by the BHRP itself are considerably low,and are comparable to the weak Raman bands of the biological tissue.. Therefore, it is possible to remove them by the usual subtraction with a background spectrum. The spectrum below 300 cm-i is cut off by the edge of the LP filter in order to remove the Rayleigh line. It is suggested that the Raman bands can be observed with a high. signal-to-noise ratio even in the low-frequency region by using the BHRP. It is generally. difficult to measure the low-frequency spectrum with a miniaturized Raman probe made of glass optical fibers. In a glass-fiber Raman probe, the interference filters, such as the BP and LP filters, are attached to the distal end of the optical fibers in order to cut off light with. unnecessary frequencies. Althoughthe optical fiber has a rather large NA, the angular acceptance ofthe interference filter is very small. Consequently, it is impQssible to remove a. part ofthe unnecessary light, and the broad Raman bands due to the glass core appear in the. low-frequency region. The Raman bands at 1257, 1439, and 1654 cm-i are assigned to the. amide III mode, CH2 bending mode, and amide I mode of the protein, respectively. The signal-to-noise ratio of the spectrum measured by the BHRP is similar to that measured by. 52.
(53) the conventional Raman microscope, although approximately one-halfofthe latter.. 53. the spectral. intensity of the. former is.
(54) Conclusion The high performance of the BHRP was successfu11y demonstrated in the present study. It suggested that the axial resolution and sensitivity were dramatically improved by. attaching a ball lens to a single HOF Raman probe.The maximum diameter of the probe is. only 640 pm, which is as narrow as the micro-Raman probe developed by Komachet al., which, as far as we know, is the narrowest Raman probe for measuring the fingerprint region.4The measured WD and axial resolution in airof the BHRP with a sapphire ball lens. (diameter: 400pm) were 28 and 23 pm, and those of the BHRP with a quartz ball lens (diameter: 500 ptm) were220 and 110 pm. The measurement of a layered model sample demonstrated that the BHRP has a limited depth-of-field optical property and is suitable for. depth-resolved Raman measurement.The calculation study showed that it is possible to control the WD of the probe by selecting different materials and diametersfor the ball lens.. The Raman spectrum of a rat stomach tissue was successfu11y measured with the BHRP. The obtained spectra had high quality,as compared to that measured with a conventional Raman microscope, strongly suggesting that the BHRP emits considerably little background. noise. We also discovered a drawback ofthe BHRP. The collection efficiency ofthe Raman scattered light was reduced when the BHRP was used with a small curvature radius. This suggests that the BHRP is only suitable for use without strong bending. For example, it is usefu1 for the measurement of surface tissues such as the walls of the digestive organs and skin, andlor the measurement of inner tissues by inserting it into the tissues. However, when it is necessary to pass a probe through a winding pathway such as a blood vessel, it is better. to use a micro-Raman probe made with glass fibers.. 54.
(55) References [1] M. G. Shim, B. C. Wilson, E. Marple and M. Wach, Appl. Spectrosc. 53, 619 (1999). [2] J. T. Motz, M. Hunter, L. H. Galindo, J. A. Gardecki, J. R. Kramer, R. R. Dasari and M. S. Feld, Appl. Opt. 43, 542 (2004).. [3] Y. Komachi, H.Sato, K.Aizawa,H.Tashiro, Appl. 0pt., 44, 4722 (2005).. [4] L. F. Santos, R.Wolthuis, S. Koljenovic', R. M. Almeida and G. J. Puppels, Anal.. Chem.77, 6747 (2005).. [5] S. Koljenovic', T. C. Bakker Schut, R. Wolthuis,A. J. P. E. Vincent, G. Hendriks-Hagevi,L. Santos, J. M. Kros, and G. J. Puppels,Anal. Chem. 79, 557 (2007).. [6] A. Nijssen, K. Maquelin, L. F. Santos, P. J, Caspers, T. C. Bakker Schut, J. C. den Hollander, M. H. A. Neumann, and G. J. Puppels,JI. Biomedical Opt.12, 034004 (2007).. [7] Y. Komachi, H. Sato, Y. Matsuura, M. Miyagi, and H. Tashiro, 0pt. Lett., 30, 2942. (2005). [8] Y. Matsuura, G. Takada, T. Yamamoto, Y. Shi, and M. Miyagi, Appl. Opt. 41, 442. (2002). [9] M. Mohebbi, R. Fedosejevs, V. Gopal, and J. A. Harrington, Appl. Opt. 41, 7031. (2002). [10]Y. Hattori, Y. Komachi, T. Asakura, T. Shimosegawa, G. Kanai, H. Tashiro, H. Sato, Appl. Spectrosc., 61,579 (2007).. [11]I. A. Boere, T. C. Bakker Schut, J. van den Boogert, R. W. F. de Bruin andG. J. Puppels, Vibrational Spectrosc., 32, 47 (2003).. [12]Y. Matsuura, S. Kino, E. Yokoyama, T. Katagiri, H. Sato, and H. Tashiro, IEEE J. Selected Topics in euantum Electronics, 13, 1704 (2007).. 55.
(56) [13]H. Sato, S. Wada, M. Ling and H. Tashiro, Appl. Spectrosc. 54, 1 163 (2000).. [14]H. Sato, S. Wada and H. Tashiro, Appl. Spectrosc. 56, 1303 (2002).. 56.
(57) Table 1.. Calculated working distances ofthe BHRPs made with different types ofball. lenses.. Table 2. LensMaterial. LensDiameter(mm) WorkingDistance. (m). Sapphire. Quartz. O.4. O.5. O.6. O.7. O.4. O.5. O.6. O.7. 32. 39. 47. 55. 122. 153. 183. 214. 57.
(58) E8-r--li. EpoxyresinEpoxyresin {. tt ttx"'. 'i. -".s-.,$'----. .........:L..-::':--'S'' -.--P-t--'---. •-'a. Figure 1.. A'"'''. r----r--TBalllensStainlesstubeHollowopticalfib. Structure ofthe BHRP head and its photograph.. 58.
(59) Jt Laser. Spectrometer. iOb. s. NF F. .L.a. a. ..... BHRP. " -d- -e. M. .--- Head of BHRP. i .!' i..., i" """ ''th'""'/'i""',ie.re" '"•."•k'/•'xt .t tt. •-20 mm. Endoscope. for rat. ww Figure 2. Schematic representation ofthe system setup for Raman measurement using the. BHRP.. 59.
(60) 1200. g NE . 'g. 800. Probe-A. 9. ,gt. 400. Probe-B. ....."..-. X•--• "''. Probe-C. o. O 100 200 300. Probe-Sample Distance z (pm). Figure 3. Response curves ofRaman spectral intensity to probe-sample distances for three probes A(sapphire, 400 pm), B(quartz, 500 pm), and C(no lens).. 60.
(61) co 't'"i-. NC.i.. v". N cv). r- e ',r-ee. (a). .-• r,. D <. cs) (5). v. l'•-•-•-. >-•, •.-.. co. = o -=. co. o. iC IMi. E'•---,.. •ii S'. (s). -. (b). 'sr-m.. ". ?s lliiii. 200. 600. 1000 1400. Raman Shift (cm-i). 1800. Figure 4. Raman spectra ofa two-layer model sample in which a 100-pm-thick PE film covers a flat PMMA substrate, measured with probeA (a) and probeB (b).. 61.
(62) t.2. 1. : : : : : : : : :. --. "t`h'. ----- l. (a). .k -. ..-.--.---. I. ..)--. -O.8. S-- J- ll) ------ -- s. 2. ---. : : 1. .:le. e-. fi O.6 l... e o.4 O.2. : : : : : :. e2. : : : :. R2=1Ommel Rl=200 mm. o e, ----. o. e2 -o. (b). : : : : :. 90 180 o. Angle of bending (degrees). Figure 5. Response curves of intensities of transmitted excitation light (a) and collected. Raman scattered light (b) to changes in the curvature and curvature radius. The BHRP is bent up to 1800 at acurvature radius of200 mm; then, the distal end ofthe probe is bent at a. curvature radius of 1O mm.. 62. 90.
(63) *. pa. o o v" .- > ). rt rt. (a). or. mo Nct) " V r- " ir"'"'. EiS. ,•iti Iiii;. v >i•t•. ...J. ut sl. o =. .-N,. -. !iS2. hY. 9. or. o pt oe. o o '. (Nti). l. l,t'). 1. il/!1. (b). 200 Raman 600Shift 1000 1400 1800 (cmi) Figure 6. Raman spectra ofa resected rat stomach measured with a conventional Raman microscope (a) and BHRP (b). Bands marked with "*" are generated by filters.. 63.
(64) Chapter 3. Subsurface Sensing of Biomedical Tissues Using a Miniaturized Raman. Probe: Study of Thin-layered Model Samples. 64.
(65) Abstract A ball lens hollow-fiber Raman probe (BHRP) is a powerfu1 tool for in vivo nondestructive subsurface analysis of biomedical tissues in a living body. It has confocal-like optical properties, but its collection volume is rather large in comparison with. that ofa conventional confocal Raman system. Therefore, the obtained Raman spectra have contributions from the upper and lower layers at different rates dependingon the thickness of. the upper layer when the measurement point is close to the boundary surface of the two layers. In the present study, we describe a methodology to extract quantitative information. about the thickness of the subsurface layer structure by using a BHRP combined with the. partial least-square regression (PLSR) analysis. The simulation study indicates that distribution ofthe collection efficiency in the collection volume ofthe BHRP is similar to a. Gaussian distribution. The empirical study suggests that the PLSR model built with only a principal component (PC) 1 based on the linearized depth data gives good prediction.. 65.
(66) Introduction Raman spectroscopy finds applications in various fields, particularlyin biomedical fieldsi-3. It has recently been identifiedas a potential alternative diagnostic method for. variousforms of cancer. One ofthe major objectivesofbiomedical Raman spectroscopy is to. provide a method forthe simultaneous determinationof the location and chemical composition of subsurface tissues in a less-invasive or non-invasive manner. The required depth resolution is varied depending on the size of the tissue under study. Komachiet aL. developed a micro-Raman probe comprising optical fibers;the probe, which is 600 pm in total diameter, is as narrow as an intravascular endoscope and can be inserted into arteries4.. Hattori et al. succeeded in obtaining the Raman spectra ofthe esophagus and stomach walls of live rats by using a miniaturized endoscope with a diameter of2.5 mm equipped with the. micro-Raman probe5. The use ofthe miniaturized Raman probe under endoscopic guidance enables us to obtain the Raman spectrum oftissues that are present deep in the entire body. The depth resolution is assumed to be a few millimeters, depending on the resolution of the endoscopic image and the skill ofthe manipulator. The accessible region will extend to most of the digestive organs and other organs through which thick arteries pass. Matouseket al.. described several methodologies for the effective retrieval of the Raman spectra of the subsurface layers in diffusely scattering media6'7. Ultrafast temporal gating and spatially offset technologies are extremely beneficialfor obtaining information regarding subsurface biological tissues. In the former technique, the detection of the subsurface Raman signals. was optimized by varying the time delay using a Kerr gate6. In the latter technique, the Raman spectrum was collected from the regions spatially offset from the point of incidence. of the probe laser beam on the surface of a diffusely scattering sample7. In such a small. 66..
(67) region, the location accuracy would be defined by the depth and lateral resolutions. According to these papers, it is estimated that the depth resolution and detectable depth are a. few hundred micrometers and several millimeters, respectively. The lateral resolution of the. spatially offset method depends on the offset distance, and that of the ultrafast temporal. gating method would depend on the optical setup used in the measurement. On the other hand, a conventional confocal Raman microscope has very high spatial resolution. Froud. investigated the use of a confocal Raman microscope with immersion lenses in Raman depth profiling, and eleven layers of polymer laminate over a depth of 100pm were successfully resolved8. According to their results, it is estimated that the depth resolution is. less than 1 pm.. In situ biomedical applications often require that the following two conditionsbe. satisfied simultaneously: remote sampling and depth resolved measurement. The miniaturized fiber Raman probe is suitable for the remote sampling4'5'9i3. since the anatomic considerations strictly limit the size of the probes, the use of the conventional. confocal microscope and spatial offset method is not suitable for the purpose. Bakker Schutet al. employed a miniaturized optical-fiber Raman probe to study a dysplastic tissue. in the epithelium of the palate of a rat mode19. Their probe efficiently recorded a Raman signal at a distance of 100--600ptm from the probe tip end. To achieve the maximum signal collection efficiency at the palatal tissue surface, which was in contact with the probe tip. during the measurement, a 200-pm thick CaF2 window was used as a spacer between the probe tip and the tissue.. We have developed miniaturized Raman probes based on hollow optical fibers (HOFs)iO'ii. The ball lens hollow-fiber Raman probe (BHRP) is well-suitedfor investigating. 67.
図


+7


Outline
関連したドキュメント
[r]
Introduction to Japanese Literature ② Introduction to Japanese Culture ② Changing Images of Women② Contemporary Korean Studies B ② The Chinese in Modern Japan ②
3 学位の授与に関する事項 4 教育及び研究に関する事項 5 学部学科課程に関する事項 6 学生の入学及び卒業に関する事項 7
[r]
[r]
[r]
[r]
[r]
