ORIGINAL ARTICLE
INVESTIGATION OF BISPECTRAL INDEX ASYMMETRY IN PATIENTS WITH CEREBRAL INFARCTION
Masahiro Sawada1),Hitoshi Yoshida2), and Kazuyoshi Hirota3)
Abstract Bispectral index (BIS) monitoring is widely used for assessing the depth of anesthesia using a unilateral forehead electroencephalogram. We previously experienced a case of low BIS during general anesthesia in a patient with subacute unilateral cerebral infarction (CI). We hypothesized that patients with unilateral CI sequelae show asymmetric BIS values during propofol-based general anesthesia. Fifty patients with or without CI sequelae (25 patients each) were enrolled in this study. BIS was monitored by symmetrically attaching BIS sensors to the forehead, while anesthesia was induced and maintained with mainly propofol. The primary endpoint was the laterality of BIS and 95% spectral edge frequency (SEF) during surgery in the CI group. The median CI duration was 48 months (interquartile range, 23–96). There was no significant BIS and SEF laterality in the control group (P=0.174 and P=0.417, respectively). In the CI group, BIS and SEF laterality failed to achieve statistical significance (P=0.069 and P=0.381, respectively). In addition, there was no significant difference in BIS and SEF asymmetry between groups (P=0.271 and P=0.238, respectively). Therefore, the findings for patients with chronic CI in this study were not consistent with those of our previous case.
Hirosaki Med.J. 65:156―163,2014 Key words: bispectral index; cerebral infarction; electroencephalogram; general anesthesia.
1) Department of Anesthesiology, Hirosaki University School of Medicine Hospital
2) Department of Emergency and Disaster Medicine, Hirosaki University Graduate School of Medicine
3) Department of Anesthesiology, Hirosaki University Graduate School of Medicine
Correspondence: M. Sawada
Received for publication, December 18, 2013 Accepted for publication, December 26, 2013
1) 弘前大学医学部附属病院麻酔科
2) 弘前大学大学院医学研究科救急・災害医学講座
3) 弘前大学大学院医学研究科麻酔科学講座
別刷請求先:澤田匡宏 平成25年12月18日受付 平成25年12月26日受理
原 著
脳梗塞患者における Bispectral index 値の左右差に関する検討
澤 田 匡 宏1) 吉 田 仁2) 廣 田 和 美3)
抄録 Bispectral index (BIS)は片側前頭部の脳波を用い麻酔深度を推測するモニターである.我々は亜急性期の脳梗 塞患者の BIS 値が左右差を呈した症例を経験した.今回,脳梗塞既往患者においてプロポフォールを中心とした全身 麻酔中に BIS モニターに左右差を示すかどうか,BIS 値および95% spectral edge frequency (SEF)を脳梗塞既往のな い患者と比較した.患者は各群それぞれ25名.主要評価項目は脳梗塞群の手術中の BIS 値の左右差とした.脳梗塞の 発症からの時間は,中央値で48ヶ月だった(四分位値,23-96).BIS および SEF は対照群(P=0.174および P=0.417)脳 梗塞群(P=0.069および P=0.381)いずれも左右差を認めず,両群のBISおよびSEFの左右差もなかった(P=0.271および
P=0.238).慢性期の脳梗塞患者では BIS の左右差はなかった.
弘前医学 65:156―163,2014 キーワード:bispectral index;脳梗塞;脳波;全身麻酔.
157 BIS Asymmetry in Patients with Cerebral Infarction
CI. In this study, we investigated whether asymmetric BIS values could occur in patients with CI and those with no past history of stroke, and compared the degree of BIS asymmetry between the groups.
Methods
Study Population
This single-center, prospective, case–control study was approved by the Ethics Committee of Hirosaki University Graduate School of Medicine
(Japan). Written consent was obtained from all patients or their next of kin. From March 2008 to August 2012, 25 adult patients with CI sequelae such as hemiplegia or aphasia who were scheduled for surgery under general anesthesia were enrolled. The control group comprised 25 age-matched patients without a past history of CI. Patients who could not be monitored by BIS sensors, such as neurosurgical patients, were excluded from this study.
Study Design
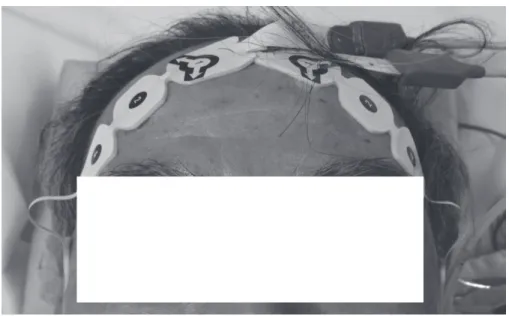
Each patient was premedicated with 2–10 mg of oral diazepam 1.5–2 h before arrival in the operating room. Before induction of anesthesia, BIS monitoring (A-2000, Aspect Medical Systems, Natik, MA, USA) was completed by symmetrically attaching BIS sensors to the forehead (Fig. 1). In addition, standard monitoring (electrocardiography, noninvasive or arterial blood pressure measurement if indicated, and pulse oximetry) was performed.
Anesthesia was induced with 0.5–1.5 mg/kg of propofol, 0.5–1.0 mg/kg of ketamine, and 0.2–0.5 μg/kg/min of remifentanil or 50–200 μg of fentanyl. Rocuronium (0.6 mg/kg) was used to facilitate tracheal intubation. Ketamine, fentanyl, or remifentanil was administered when necessary, and rocuronium dosing was repeated as needed for muscle relaxation. The propofol infusion rate was titrated to maintain
Introduction
Bispectral index (BIS) monitoring is widely used during general anesthesia to assess the depth of anesthesia1). The BIS system processes frontal electroencephalographic signals using a unique algorithm to calculate a patient’s level of consciousness. BIS values range from 0, indicating suppression of detectable brain electrical activity, to 100, indicating an awake state. A target range of 40-60 reflects adequate hypnotic level.
Despite its widespread use, the effects of BIS monitoring on the prevention of awareness during anesthesia remains controversial1,2)
because a number of pathological conditions that cause alterations in raw electroencephalogram
(EEG) and BIS values can be causative factors besides general anesthesia. These include cerebral hypoperfusion3), decreased cardiac output4), and acute cerebral infarction (CI)5). If these factors affect brain activity unilaterally, BIS values derived from the pathological hemisphere would result in inaccurate assessment of the depth of general anesthesia because BIS requires a unilateral forehead EEG.
In general, CIs are typically monohemispheric.
During recovery from CI, an asymmetric brain response can be observed6). Similarly, as per our clinical experience (see Appendix), CI due to unilateral middle cerebral artery occlusion can cause BIS asymmetry; in the case we encountered, BIS values derived from the affected hemisphere were lower than those derived from the contralateral hemisphere during general anesthesia. However, whether or not CI can lead to asymmetric BIS has not been clarified.
Therefore, we hypothesized that patients with CI sequelae would show asymmetric BIS values during propofol-based general anesthesia, and the degree of BIS asymmetry would be larger than that shown in patients without
158 M. Sawada, et al.
the BIS values between 40 and 60 because this range is considered to be adequately hypnotic during surgery. Normal brain hemisphere BIS values were used for propofol titration in the CI group. In the controls, computer-generated randomization was used to determine the brain hemisphere to be used for propofol titration with BIS. The pseudonormal hemisphere was defined as the titration side, while the pseudoaffected hemisphere was considered to be the opposite side.
Data Collection
Age, gender, weight, height, the opioid used, surgical and anesthesia duration, and the American Society of Anesthesiologists Physical Status (ASA-PS) were recorded. BIS values and 95% spectral edge frequency (SEF; the frequency below which 95% of the total power of a given EEG signal is located) were recorded on a laptop using HyperTerminal software
(Hilgraeve Inc., Monroe, MI, USA). The smoothing time was 5 s. BIS (mBIS) and SEF
(mSEF) values during surgery were averaged for each patient.
Statistical Analysis
First, the difference in mBIS and mSEF values between the right and left hemispheres was assessed in each group. Then, we compared the degree of mBIS and mSEF asymmetry between the control and CI groups as follows:
CI group asymmetry = normal side value – CI side value; control group asymmetry = propofol titration side (pseudonormal side) value – opposite side (pseudoaffected side) value. The primary endpoint was BIS and SEF laterality during surgery in CI patients. The secondary endpoints were BIS and SEF laterality during surgery in patients without CI and the degree of asymmetry between patients with and without CI. Means and standard deviations are used to express age, weight, height, surgical and anesthesia duration, and mBIS and mSEF values. Where appropriate, data were compared between groups using the Mann–Whitney U-test, the chi-square test, Fisher’s exact test, and an unpaired Student’s t-test. The Wilcoxon signed-rank test or a paired t-test was used for intragroup comparison of mBIS and mSEF values. All statistical analyses were performed using SPSS statistical software (version 20.0,
Fig. 1 Bispectral index (BIS) sensors attached symmetrically.
22
Fig. 1
159 BIS Asymmetry in Patients with Cerebral Infarction
SPSS Inc., Chicago, IL, USA) and Microsoft Excel. P-values of <0.05 were considered statistically significant.
Results
Except for gender and ASA-PS, the patient characteristics were similar between the control and CI groups (Table 1). In the CI group, the median CI duration was 48 months
(interquartile range, 23–96 months). BIS and
SEF values were recorded manually every 5 min in six controls and one CI patient because recording software was not available. Table 2 shows the results of intragroup comparison of mBIS and mSEF values. There was no significant difference in mBIS and mSEF values between pseudonormal and pseudoaffected side in the control group (P = 0.174 and P = 0.417, respectively). In the CI group, we failed to find any significant differences in mBIS and mSEF between normal and infarction side (P = 0.069
Table 1 Patient demographics
Group Control CI P value
Age (yr) 63.6±9.9 68.6±9.3 0.069
Gender (M/F) 12/13 20/5 0.018
Weight (kg) 55.7±7.9 59.6±14.5 0.367
Height (cm) 158.1±7.7 160.9±9.2 0.258
ASA-PS (1/2/3) 1/20/4 0/10/15 0.003
Opioid (fentanyl/remifentanil) 11/14 12/13 0.777 Duration (min)
Surgery 131±93 205±201 0.282
Anesthesia 178±102 265±192 0.067
All data except gender, ASA-PS, and anesthesia are expressed as means ± standard deviations.
CI, cerebral infarction; ASA-PS, American Society of Anesthesiologists- Physical Status.
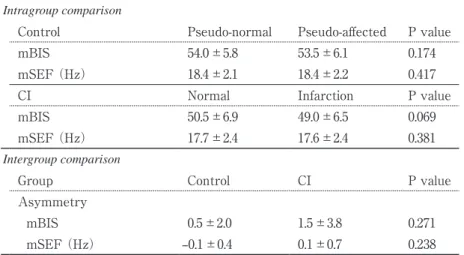
Table 2 Intragroup comparison of bispectral index (BIS) values and 95%
spectral edge frequency (SEF) and intergroup comparison of BIS and SEF asymmetry
Intragroup comparison
Control Pseudo-normal Pseudo-affected P value
mBIS 54.0±5.8 53.5±6.1 0.174
mSEF (Hz) 18.4±2.1 18.4±2.2 0.417
CI Normal Infarction P value
mBIS 50.5±6.9 49.0±6.5 0.069
mSEF (Hz) 17.7±2.4 17.6±2.4 0.381
Intergroup comparison
Group Control CI P value
Asymmetry
mBIS 0.5±2.0 1.5±3.8 0.271
mSEF (Hz) –0.1±0.4 0.1±0.7 0.238
All data expressed as means ± standard deviations.
mBIS, averaged bispectral index during surgery; mSEF, averaged 95%
spectral edge frequency during surgery; CI, cerebral infarction.
and P = 0.381, respectively). There was no significant difference between the CI and control groups in terms of the degree of mBIS and mSEF asymmetry (Table 2; P = 0.271 and P = 0.238, respectively). We did not find significant BIS and SEF laterality during propofol-based general anesthesia in patients with or without CI sequelae.
Discussion
To our knowledge, this is the first study to compare BIS asymmetry during general anesthesia between CI and control groups.
Although we previously experienced a case in which the CI-side BIS and SEF values were lower than those for the contralateral side during general anesthesia, in this present study, we did not find significant BIS and SEF laterality during propofol-based general anesthesia in patients with or without CI sequelae. In addition, the degree of BIS and SEF asymmetry between patients with and without CI sequelae was not statistically significant.
BIS is an EEG-based monitoring process for assessing the depth of general anesthesia.
Although the thorough algorithm for calculating BIS values has not been disclosed, the following factors are correlated with BIS values: EEG β-wave activity, SEF values, or suppression ratio (the EEG fraction spent in suppression per epoch) when BIS was over 60, between 40 and 60, or under 40, respectively7). Therefore, neurological diseases that alter EEG values can affect BIS calculation during general anesthesia.
Several reports have revealed that the mechanisms underlying general anesthesia are partly involved in endogenous non-rapid eye movement sleep (NREMS) accompanied by similar EEG patterns such as a sleep spindle8-11). In patients with acute stroke, burst suppression and slow waves such as δ- and θ-waves are dominant on ipsilateral EEGs recorded during
NREMS12). Acute hemispheric stroke (≤10 days after stroke) is also characterized by a lower sleep spindle peak size during NREMS13). In contrast, such changes in sleep spindle peak size can be improved during the chronic phase of hemispheric stroke (>60 days after stroke)13), a finding consistent with our results. Our data may indicate that BIS sensors can be applied to the affected side of the forehead in chronic post-stroke patients; however, residual neuronal impairment should be considered.
The findings of the present study were not consistent with those of our previous clinical case (Appendix), where the patient’s CI was classified as subacute. These patients can show subacute-specific EEG changes during NREMS. After hemispheric ischemia, both NREMS electrical activity and humoral signals that regulate sleep in the brain change over the course of the disease. For example, tumor necrosis factor-α, a sleep regulator, accumulates during the subacute phase of CI in the brain14). When applied to the cerebral cortex, it increases slow-wave EEG activity during NREMS15). Such phase-specific changes may also occur during general anesthesia.
This study has several limitations. First, our assessment of CI may not be sufficient; stroke assessment scoring systems should have been used13); furthermore, neurological imaging such as computed tomography or magnetic resonance imaging was not used to avoid more invasive examinations. Second, two different opioids were used in this study (fentanyl or remifentanil).
Both opioids belong to a congener of the fentanyl family of opioids that act through the μ-opioid receptor, wherein the high clearance rate of remifentanil allows the use of larger doses during general anesthesia compared with that of fentanyl. Therefore, a possible difference in drug concentration may have affected BIS values because this group of opioids is known to decrease SEF in a dose-dependent manner16).
161 BIS Asymmetry in Patients with Cerebral Infarction
In conclusion, we did not find any BIS and SEF laterality during propofol-based general anesthesia in patients with or without CI sequelae. In addition, BIS and SEF asymmetry were comparable between the experimental groups.
Appendix: Case Report
A 66-year-old man was diagnosed with gastric and metastatic transverse colon cancer.
Seven weeks before surgery, he developed CI due to occlusion of the right middle cerebral artery. Thrombolytic therapy with tissue plasminogen activator was not administered because of hemorrhagic gastric cancer. When distal gastrectomy and transverse colectomy were scheduled, he developed left hemiparesis.
Following standard monitoring, two BIS sensors were symmetrically placed on the forehead and attached to two Aspect XP BIS monitors
in order to assess differences in BIS values between the right and left brain hemispheres.
The patient was anesthetized with 5–6 mg/
kg/h of propofol, 14.5 μg/kg of fentanyl, and 0.1 mg/kg/h of ketamine. The estimated effect-site concentration of propofol and fentanyl during surgery was 2.7–3.4 μg/ml and 1.7–5.4 ng/ml, respectively.
The cardiovascular system was stable;
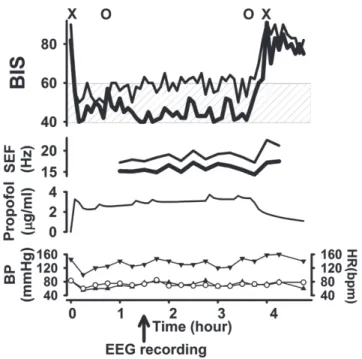
systolic arterial pressure and heart rate were maintained at 120–160 mmHg and 60–80 bpm, respectively. The BIS values in each brain hemisphere were stable, but those for the CI- affected side were lower (around 40) than those for the normal side (around 60; Fig. 2). In addition, SEF was also asymmetric. However, we did not find obvious EEG differences between the normal and CI-affected sides (Fig.
3).
Fig. 2 Changes in bispectral index (BIS) and 95% spectral edge frequency (SEF) effect-site concentration of propofol and hemodynamics.
In BIS and SEF: thin line, normal side; thick line, infarction side; hatched area, target BIS range during general anesthesia; X, start and finish of anesthesia; O, start and finish of surgery.
For hemodynamic changes: ▼, systolic blood pressure (BP); ▲, diastolic BP; ○, heart rate (HR).
23
Fig. 2
162 M. Sawada, et al.
Acknowledgements
The authors would like to thank Enago
(www.enago.jp) for the English language review.
References
1)Myles PS, Leslie K, McNeil J, Forbes A, Chan MTV. Bispectral index monitoring to prevent awareness during anaesthesia: the B-Aware randomised controlled trial. Lancet 2004;363:1757- 63.
2)Avidan MS, Zhang L, Burnside BA, Finkel KJ, Searleman AC, Selvidge JA, Saager L, et al.
Anesthesia awareness and the bispectral index. N Engl J Med 2008;358:1097-108.
3)Hayashida M, Chinzei M, Komatsu K, Yamamoto H, Tamai H, Orii R, Hanaoka K, et al. Detection of cerebral hypoperfusion with bispectral index during paediatric cardiac surgery. Br J Anaesth 2003;90:694-8.
4)Hemmerling TM, Olivier JF, Basile F, Le N, Prieto I. Bispectral index as an indicator of cerebral hypoperfusion during off-pump coronary artery bypass grafting. Anesth Analg 2005;100:354-6.
5)Welsby IJ, Ryan JM, Booth JV, Flanagan E, Messier RH, Borel CO. The bispectral index in the
diagnosis of perioperative stroke: a case report and discussion. Anesth Analg 2003;96:435-7.
6)Tecchio F, Zappasodi F, Tombini M, Oliviero A, Pasqualetti P, Vernieri F, Ercolani M, et al.
Brain plasticity in recovery from stroke: an MEG assessment. Neuroimage 2006;32:1326-34.
7)Morimoto Y, Hagihira S, Koizumi Y, Ishida K, Matsumoto M, Sakabe T. The relationship between bispectral index and electroencephalographic parameters during isoflurane anesthesia. Anesth Analg 2004;98:1336-40.
8)Franks NP. General anaesthesia: from molecular targets to neuronal pathways of sleep and arousal.
Nat Rev Neurosci 2008;9:370-86.
9)Franks NP, Zecharia AY. Sleep and general anesthesia. Can J Anaesth 2011;58:139-48.
10)Nelson LE, Guo TZ, Lu J, Saper CB, Franks NP, Maze M. The sedative component of anesthesia is mediated by GABA(A) receptors in an endogenous sleep pathway. Nat Neurosci 2002;5:979-84.
11)Wolter S, Friedel C, Bohler K, Hartmann U, Kox WJ, Hensel M. Presence of 14Hz spindle oscillations in the human EEG during deep anesthesia. Clin Neurophysiol 2006;117:157-68.
12)Epstein JA, Lennox MA, Noto O. Electroencepha- lographic study of experimental cerebro-vascular occlusion. Electroencephalogr Clin Neurophysiol Fig. 3 Raw electroencephalogram (EEG) of normal and affected hemispheres during general anesthesia.
24
Fig. 3
163 BIS Asymmetry in Patients with Cerebral Infarction
1949;1:491-502.
13)Gottselig JM, Bassetti CL, Achermann P. Power and coherence of sleep spindle frequency activity following hemispheric stroke. Brain 2002;125:373- 83.
14)Wang J, Yang Z, Liu C, Zhao Y, Chen Y. Activated microglia provide a neuroprotective role by balancing glial cell-line derived neurotrophic factor and tumor necrosis factor-alpha secretion after subacute cerebral ischemia. Int J Mol Med 2013;31:172-8.
15)Yoshida H, Peterfi Z, Garcia-Garcia F, Kirkpatrick R, Yasuda T, Krueger JM. State-specific asymmetries in EEG slow wave activity induced by local application of TNFalpha. Brain Res 2004;
1009:129-36.
16)Egan TD, Muir KT, Hermann DJ, Stanski DR, Shafer SL. The electroencephalogram (EEG) and clinical measures of opioid potency: defining the EEG-clinical potency relationship ('fingerprint')
with application to remifentanil. Int J Pharmaceut Med 2001;15:11-19.