Autonomous regulation of mast cell
degranulation through an inhibitory receptor
CD300a
著者(英)
Yaqiu Wang
year
2019
その他のタイトル
抑制性受容体CD300aを介した肥満細胞脱顆粒の自己
調節
学位授与大学
筑波大学 (University of Tsukuba)
学位授与年度
2019
報告番号
12102甲第9261号
URL
http://doi.org/10.15068/00158048
School of Integrative and Global Majors,
University of Tsukuba
Ph.D. Program in Human Biology
Yaqiu Wang
2019
Autonomous regulation of mast cell
degranulation through an inhibitory
receptor CD300a
Table of Contents
0. Abstract ... 3
1. Introduction ... 4
1.1 Mast cells and allergic response ... 4
1.2 Mast cell degranulation machinery and its regulation by inhibitory receptors .... 6
1.3 PS exposure during apoptosis and cell activation ... 9
1.4 The function of apoptotic PS exposure ... 11
1.5 The function of live cell PS exposure ... 12
1.6 CD300a on MCs and live MCs PS exposure ... 13
2. Purpose of this study ... 15
3. Materials and methods ... 16
3.1 Cells ... 16
3.2 Antibodies, other reagents, and flow cytometry ... 16
3.3 Degranulation and other stimulations ... 17
3.4 Live imaging ... 18
3.5 Phagocytosis assay ... 20
3.6 Passive systemic anaphylaxis ... 21
3.7 Western blot analysis ... 22
3.8 Statistical analysis ... 22
4. Results ... 23
4.1 Characterization of PS exposure during mast cell degranulation ... 23
4.1.1 PS exposure is fast and persistent ... 23
4.1.2 PS exposure is associated with degranulation ... 24
4.1.3 PS+ MCs after degranulation are not subject to phagocytosis ... 24
4.2 Interactions of exposed PS and PS receptor CD300a during MCs degranulation ... 25
4.2.1 Co-localization of CD300a and PS during MCs degranulation ... 25
4.2.2 Interaction of CD300a and PS during MCs degranulation ... 25
4.3 Functional analysis of PS and CD300a interaction during MCs degranulation in vitro ... 26
4.3.1 PS-CD300a interaction inhibits MCs degranulation ... 26
4.3.2 PS-CD300a interaction mediated inhibition of MCs degranulation is cell intrinsic and cell-cell interaction independent ... 27
4.3.3 cis-interaction of CD300a with PS specifically suppresses FcεRI-mediated MCs degranulation ... 27
4.4 Phenotype of CD300a deficient mice in a MC-dependent PSA model ... 28
4.4.1 Impaired recovery of CD300a deficient mice in a passive systemic anaphylaxis model .. 28
4.4.2 Involvement of MCs CD300a and PS cis-interacting in vivo in a PSA model ... 28
4.5 CD300a mediated inhibition of degranulation is a cell-intrinsic feedback mechanism ---- additional evidence from a mathematic modeling approach ... 29
5. Discussion ... 31
5.1 Cis vs trans-interaction and their pathophysiological significance ... 31
5.2 PS exposure and recovery ... 32
5.3 CD300a specificity ... 33
5.4 Technical advances and caveats ... 34
5.4.1 PSVue as degranulation monitoring reagent ... 34
5.4.2 Protein-lipid FRET ... 34 5.4.3 Mathematical modeling ... 35 5.5 Future directions ... 35 6. Conclusion ... 37 7. Figures ... 38 8. Reference ... 58 9. Acknowledgement ... 69 10. Abbreviation ... 70 Reference ... 71
0. Abstract
Although phosphatidylserine (PS) confined to the inner leaflets of plasma membrane is exposed on the cell surface when cells undergo apoptosis, viable cells also
externalize PS in certain cellular states. However, the pathophysiological significance of PS exposure on viable cells remains elusive. Through imaging analyses, we found that PS was exposed on the plasma membrane of live mast cells (MCs) during degranulation. Although the exposed PS did not promote phagocytes engulfment of live MCs, it colocalized with CD300a, an inhibitory immunoreceptor that recognizes PS. Fluorescence resonance energy transfer (FRET) experiment reveals the direct cis-binding between CD300a and PS during degranulation. Functionally, I observed that degranulation was greater after stimulation with an IgE–antigen complex in MCs deficient in CD300a than in wild-type MCs. Pretreatment of MCs with a neutralizing anti-CD300a antibody efficiently upregulated the degranulation of wild-type MCs as a result of interference of cis-interaction between CD300a and PS as evidenced by decreased FRET efficiency. Consistently, CD300a-deficient mice or in vivo treatment with a neutralizing
CD300a antibody showed slower recovery of body temperature compared with wild-type mice in MCs-dependent passive systemic anaphylaxis. Our study suggests self-regulation of MC degranulation through cis-interaction of PS with CD300a to down regulate allergic response, adding another layer of regulation in allergic responses.
1. Introduction
1.1 Mast cells and allergic response
Mast cells (MCs) are one of the evolutionally conserved cell types among all the vertebrate1. First described by German physician Paul Ehrlich in 1878 based on its
unique cellular morphology with granules and the ability to retain basic aniline dyes, MCs are widely distributed among many tissues, including vital organs such as brain, intestine, skin and lungs. The heterogenicity of MCs is now a well-established concept, as two distinct MCs populations – mucosal-type MCs and connective tissue-type MCs – could be defined in rodents based on their different expression profile of MCs protease2; and three different populations of human MCs are
proposed by their different serine proteases expression, namely, tryptase-only (MCT), chymase-only (MCC), and tryptase and chymase double positive (MCTC)
MCs3.
It is now appreciated for MCs’ important roles in mammalian physiology and pathology4. Despite the increasing research interests of MCs roles in normal
physiology, such as angiogenesis, tissue remodeling, wound healing and immune regulation, the effector function of MCs activation in allergic response remain to be a significant research area5 .
Although MCs are the major effector cell type involved in IgE-dependent allergic responses, the link between MCs activation and allergic symptoms (e.g. anaphylactic shock) was only established half century later after the discovery of MCs, when histamine and heparin, the major effector molecules for anaphylactic shock, were found mainly released from MCs by series works from Riley and West in 1950s6–8. In 1966 and 1967, K Ishizaka and T Ishizaka found IgE and their
hypersensitivity-induction activity from atopic patients9,10. The successful culture of
rat basophilic leukemia cell line (RBL) later on enabled the detailed characterization of IgE-binding property of basophil and mast cell, as well as the histamine release from some RBL cells after IgE binding11,12 . Finally, in 1989, the complete structure
of high affinity IgE receptor FcεRI was cloned and expressed13.
It is clear now that antigen-specific IgE sensitize MCs through binding to the IgE binding site on α chain of FcεRI. The presence of multivalent antigen aggregates more than one FcεRI. The colligation of this receptor activates MCs and cause the release of pro-allergic substances, a process termed “degranulation”, as the granules which contain the pre-stored pro-allergic substances, are released during such MC activation. Besides histamine and heparin, the activation of MCs also triggers the release of a large panel of other effector molecules, including cytokines, such as TNF-α13 and various proteases13. Activated MCs are also capable of releasing lipid
mediators, chemokines and growth factors through de novo synthesis14,15. The
released mediators play important roles in not only allergic responses, but also bacteria killing16,17, leukocyte recruitment 18,19 and adaptive immune response
induction20.
The importance of MCs in physiology and pathology is revealed using MC-deficient mice as powerful research tools21–23. Indeed, MC-deficient mice are
completely protected from IgE-mediated passive systemic anaphylactic shock, highlighting the vital role of MCs as effector cells during anaphylactic shock24.
Reconstituting MCs in MC-deficient mice is a compelling method to dissect the critical pathways and regulatory components involved in MC degranulation, allergy and anaphylaxis. CD300lf and Allergin-1, for example, are inhibitory receptors on MCs and inhibit FcεRI-mediated degranulation. Transfer of CD300lf24 or
than wild-type MCs-transferred group in a passive systemic anaphylaxis (PSA) model, confirming the inhibitory function of these receptors in vivo. Using such strategy, studies identified many factors regulating mast cell degranulation and their further implications in allergy and anaphylaxis26–28.
1.2 Mast cell degranulation machinery and its regulation by inhibitory receptors
On MCs, FcεRI is composed of one each of α and β chain with two γ chains. β and γ chains contain immunoreceptor tyrosine-based activation motifs (ITAMs). Upon colligation, ITAMs in both β and γ chains are quickly phosphorylated by the Src family kinase Lyn, which is constantly associated with β chain. The phosphorylation of ITAMs results in the Syk recruitment to the γ chain and Syk phosphorylation. Phosphorylated Syk further phosphorylate other adaptor proteins and kinases in the signal cascade, including phospholipase C gamma (PLC γ), a key molecule to
catalyze the hydrolysis of phosphatidylinositol bisphosphate to inositol trisphosphate (IP3) and diacylglycerol (DAG), which result in cytosolic Ca2+ mobilization and
protein kinase C (PKC) activation, respectively. The activated PKC further phosphorylate the light chain of myosin within the actin-myosin complex under cytoplasm membrane and cause the disassembly of the complex. SNARE complex is formed as a result of increased cytosolic calcium and the inactivation of its inhibitory machineries by activated PKC. Formed SNARE complexes mediate the membrane fusion between granules and cytoplasmic membrane, which results in the release of processed granule contents as well as the change of surface markers of the
cytoplasmic protein (Fig. 1).29
The consequences after granules and cytoplasm membrane fusion provide sensitive and complementary methods for measuring the degranulation
experimentally. For example, the release of histamine30, serotonin31 , catalytic
enzymes (e.g. beta-hexosaminidase)32 and cell surface expression of endosomal
markers (e.g. LAMP-1)33 are frequently used for such propose.
The degranulation process is a well-organized cellular and molecular event with the cooperation among various pathways and signaling molecules
aforementioned. The defects of certain components involved in this event will cause the altered degranulation and subsequent change of in vivo phenotype (e.g. allergic response, anaphylaxis)33 . For example, the genetic deletion of FcεRI α chain causes
a complete loss of degranulation of MCs and therefore the MCs-deficient mice receiving a transfer of FcεRI α-deficient MCs are protected from allergic symptoms in a food allergy model27.
The deficiency of src-famlimy kinase Lyn, however, generates confusing results with decreased34,35, increased35,36 and comparable37 degranulation in vitro, as
well as controversial phenotypes in vivo. This is probably because of the multiple functions of Lyn to process inhibitory phosphorylation on C-terminal Src kinase (Csk)-binding protein (Cbp)36 and on the FcεRI β chain35 , as well as the increased
activation of SHIP-1 phosphatase activity in Lyn-deficient MCs38.
The Syk-deficient MCs showed defect to phosphorylate both PLCγ1 and PLCγ2 and failed to increase the cytosolic calcium concentration upon FcεRI activation and failed to degranulate39. Similarly, PLCγ2 deficient MCs showed
impaired calcium mobilization, therefore a decreased degranulation in response to FcεRI stimulation40.
The pathology of allergic diseases and anaphylaxis is largely contributed by mast cell degranulation triggered by FcεRI activation24,41. Therefore, the specific
inhibitory machinery of degranulation is thought to be of therapeutic
MCs degranulation, including using the inhibitors of key signaling pathways44,45,
modulation of actin-regulatory proteins46 and cell intrinsic SNARE inhibitory
proteins47 as well as ITIM-bearing cell surface receptors42,48.
Because the molecules involved in degranulation signal transduction and machinery are often found to be universally expressed in other cell types and have fundamental functions in steady state (e.g. SNARE49 proteins and actin50), which
rendered their specificity for targeting MCs degranulation. On the other hand, MCs naturally express many inhibitory receptors which bearing the immunoreceptor tyrosine-based inhibition motif (ITIM) in their cytoplasmic domains (e.g. FcRIIB51,
gp49B152, SIRPα53, LILRB254, CD300a55, CD300lf56 and Allergin-125). These
receptors are expressed on more specific cell populations and specifically be
activated in the presence of their ligands or agonistic antibodies42. Upon activation,
phosphorylation of tyrosine residues in ITIMs enables the recruiting of phosphatase such as SHP-1, SHP-2 and/or SHIP, which will dephosphorylate several kinases and their downstream targets of the FcεRI pathway, thus suppresses MC activation. For example, colligation of FcεRI with ITIM bearing receptors, such as gp49B152,
CD300lf57 and Allergin-125 with receptor-specific monoclonal antibodies, showed
effective decrease of FcεRI-mediated mast cell degranulation without obvious requirement of their natural ligands.
Among the inhibitory receptors on MCs, LILRB2 is able to suppress FcεRI-mediated mast cell degranulation without colligation with FcεRI. Indeed, the ligand of LILRB2 is found to be MHC-I, which is originally expressed on the same cell and form constant cis-interaction and activation of LILRB2. Such cis-interaction may regulate the activation threshold of MCs54 .
In contrast, CD300lf shows intriguing requirement of its proposed ligands for inhibitory function. Izawa and colleagues identified ceramide as natural ligands of
mouse CD300lf and blocking interaction of ceramide and CD300lf by an anti-ceramide antibody effectively abolished the inhibitory function of CD300lf in a passive cutaneous anaphylaxis model, resulting in elevated vascular leakage57.
Indicating the inhibitory function of indigenous ceramide through its receptor CD300lf, intriguingly however, exogenous administration of ceramide could also negatively regulate MCs function in the same model in a CD300lf dependent manner57, raising a question of the relative importance of indigenous ceramide in
CD300lf function.
Although therapeutically effective, in many cases, the physiological significance of those inhibitory receptors on MCs remains unknown due to lack of knowledge of their natural ligands42,48, proposing a big challenge for therapeutically
targeting. (Fig. 1)
1.3 PS exposure during apoptosis and cell activation
Eukaryotic cell membrane is composited of lipids, proteins and carbohydrates, with the lipid bilayers as scaffold, membrane proteins stay in or anchored on the lipid bilayer and carbohydrates mainly exist as glycolipid or glycoprotein58. The lipid
compartment is mainly consisted of phospholipids, sphingolipids and sterols59.
Although the exact composition of lipids differs across cell types and status, the major structural lipids in eukaryotic membrane is phospholipids:
phosphatidylcholine (PC), phosphatidylethanolamine (PE), phosphatidylserine (PS), phosphatidylinositol (PI) and phosphatidic acid (PA), with PC as dominant
component (>50%) 59,60. One important feature of the lipid bilayer is the asymmetric
distribution of lipid components on live cells, with consists predominantly of PC, sphingomyelin, and glycolipids dominant the outer leaflet, whereas the inner leaflet
contains PE, PS and PI and cholesterol is distributed in both leaflets58. The
asymmetric distribution is largely due to the P4-ATPases flippase activity, which translocate the aminophospholipids PS and PE towards the cytosolic leaflet61,62.
However, PS is exposed on the surface after death induction (e.g. apoptosis) or cell activation63–66.
During cell apoptosis, PS exposure can be triggered by the inactivation of flippase as well as the activation of scramblase, a group of enzymes functioning to transport lipids following the existing lipid gradient without specificity and direction between the inner and outer leaflets67,68. Nagata’s group identified a caspase
cleavage site in a flippase ATP11C and a scramblase Xkr8. The activation of caspase during apoptosis causes the cleavage and inactivation of ATP11C together with cleavage and activation of Xkr8 and lead to the exposure of PS during apoptosis; indeed, a mutation on the caspase cleavage site maintained the ATP11C flippase activity or suppressed Xkr8 activation during apoptosis and results in lack of PS exposure and resistance to phagocytosis 69,70.
Upon cell activation, Elliott and colleagues found that PS can be exposed on CD45RB negative T cell population as well as T cell activated through P2X7
receptor by ATP64. Similarly, the same group also reported that B cell PS exposure is
also negatively correlated with CD45 phosphatase activity, as CD45-deficient B cells expose PS constantly on their surface63. Interestingly, PS exposure on activated
platelets is caused by the increased cytosolic calcium concentration, where a
calcium-dependent scramblase TMEM16F is activated in high calcium environment. Lack of TMEM16F dampens the PS exposure during platelet activation71. Indeed, a
constitutive active form of TMEM16F is enough to expose PS on the cell surface when transduced into lymphoma cell72. Although, the responsible flippase and/or
scramblase remain unknown in both PS+ live T and B cells, PS exposure on activated
T cell was also correlated with increased cytosolic calcium64 , pointing out the
possibility for a calcium-dependent scramblase during PS exposure of activating T cell.
1.4 The function of apoptotic PS exposure
PS exposed on apoptotic cell is well-known as an “eat me” signal which promotes its recognition and engulfment by macrophages73,74. Accordingly, macrophages express
receptors recognizing PS (e.g. Tim-4) and bridging proteins binding to PS (e.g. ProteinS, Gas6) to mediate receptor tyrosine kinase Tyro3/Axl/Mer (TAM)-dependent phagocytosis75. PS exposure on apoptotic cells is an important factor
contributing to phagocytosis, since incubating apoptotic cells with PS masking molecule, Annxin-V76 or a mutated Milk fat globule-EGF-factor 8
(MFG-E8-D89E)77 efficiently decreased the phagocytosis of apoptotic cells by macrophages.
Nagata’s group proposed a “two-step” engulfment model for apoptotic cell phagocytosis, tethering and engulfing. PS may participate in both steps, as in an artificial Baf3 phagocytes expressing PS receptor Tim4 and integrin α(v)β(3), Tim-4 function as tethering through PS binding and integrin α(v)β(3) complex together with MFG-E8 mediate engulfment78,79. However, a recent study reported that Tim-4
may not be required for all the phagocytosis events in some types of macrophage80
as Mer can function in both tethering and engulfing steps81.
Besides functioning as an “eat me” signal, PS exposed on apoptotic cells also functions as a ligand for the PS receptor CD300a, expressed on many myeloid cells including MCs and dendritic cells (DCs). Nakahashi-Oda and colleagues found that PS from apoptotic epithelial cells bind to the same PS receptor CD300a on CD11b+
intestinal DCs and effectively suppressed TLR-4-TRIF-mediated interferon-β (IFNβ) production, a cytokine involved in regulatory T cell abundance. In an in vitro co-culture system of DCs and apoptotic cells, masking PS by MFG-E8-D89E
dramatically increased the IFNβ from DCs to the similar level as CD300a deficient DCs after fecal contents stimulation82. Apoptotic cells are known for their immune
regulatory ability83, this finding highlighted the immune modulatory ability of
apoptotic PS and its sensing machinery, as represented by a PS receptor CD300a.
1.5 The function of live cell PS exposure
As an “eat me” signal, PS-coated beads or PS liposomes can be effectively phagocytosed by macrophages84–86, paradoxically, PS-exposing live cells are not
sufficient to trigger phagocytosis, as a constitutive active scramblase-expressing lymphoma cell line, which expose comparable level of PS with that on apoptotic cells failed to be engulfed by phagocytes both in vivo and in vitro72. On the other
hand, a recent report from the same group observed a loss-of-function mutation in flippase ATP11C conferred the PS exposure on live pre-B cells and pre-B cell-specific engulfment by macrophages in a PS-dependent manner87. It seems the
flippase inactivation or scramblase activation induced PS exposure on living cell may differ from each other in the stability of surface PS and result in the distinct outcome of phagocytosis69,73.
Despite the intriguing role of live cell exposed PS in live cell engulfment, the functions of PS exposed on activated platelet and T cells were investigated by different groups.
PS on activated platelets provides interacting platform for factor Va and Xa, interacts with proteins in prothrombinase complex and promotes its assembly65,88,
explaining previous observation that PS-containing vesicles can sufficiently induce activation of prothrombinase in an in vitro artificial system89. Platelet incapable of
exposing PS after activation due to a lack of scramblase TMEM16F failed to induce coagulation and mice with TMEM16F deficiency suffered from mild bleeding71.
On T cell activated by ATP, PS exposure was shown to correlate with CD62L shedding64. In the same study, blocking PS by Annexin-V, inhibited the T
cell migration both in vitro and in vivo64. However, the responsible molecules
directly involved in PS translocation and recognition are still unknown. Moreover, PS exposure and its function on B cell are still controversial63,90,91.
1.6 CD300a on MCs and live MCs PS exposure
MC is known to be AnnexinV positive upon FcεRI co-ligation induced degranulation 66,92,93. The PS exposure is not associated with cell death and is
reversible within 24 hr after stimulation66,93. However, the detailed characteristic
(e.g. time scale, intensity) and physiological functions of PS externalization on MC remain elusive94.
Interestingly, MCs highly express PS receptors CD300a which has three ITIMs in its cytoplasmic region55 and was shown to be a receptor of
phosphatidylserine (PS), which is expressed on apoptotic cells95. Nakahashi-Oda and
colleagues reported that PS from apoptotic cells can robustly suppress the TLR-4-MyD88-mediated pro-inflammatory signals on MCs through interaction with MC CD300a. This suppression reduced the proinflammatory cytokine production in MCs during a murine sepsis model, rendered bacteria clearance and led to increased mortality19. Blocking CD300a and apoptotic PS interaction by a blocking antibody
function of CD300a19. This study highlights the importance of CD300a in sensing
apoptotic cells and mediating the immunosuppressive function during severe inflammation where apoptotic cells are abundant, however, apoptotic cells are quickly removed by phagocytes and therefore absent in normal tissue96, raising a
curiosity of CD300a function on MCs activation during non-inflammatory condition. Despite the suggestions by many researchers that CD300a may play an
inhibitory role in MC degranulation through its intracellular ITIM motifs after colligation with FcεRI receptor 94,97, little is known about the physiological function
of CD300a on FcεRI-mediated MCs degranulation, especially the interaction between CD300a and its natural ligand PS, which is exposed during the degranulation.
2. Purpose of this study
Characterization of PS exposure during FcεRI-mediated MCs degranulation; functional analysis of externalized PS during MCs activation from the view of PS receptor CD300a.
3. Materials and methods
3.1 Cells
Bone marrow (BM)-derived cultured MCs (BMMCs) were generated by culturing wild-type (WT) and Cd300a-/- mouse BM cells in the presence of 10 ng/ml stem cell
factor (SCF) (455-MC/CF, R&D Systems) and 4 ng/ml IL-3 (403-ML, R&D Systems) as previously described25. Briefly, weekly passages were performed by
seeding 2 × 10⁶ cells in 10 ml medium. Cells were cultured for 5 to 8 weeks before
use. Cd300a-/- mice were described previously 25. Cultured human synovial MCs
were prepared and maintained as previously reported 98. All mice experiments were
conducted in accordance with the guidelines of the animal ethics committee of the University of Tsukuba Animal Research Center. The human mast cell study was approved by the Ethics Committee of the Nihon University School of Medicine (RK-160112-2), and all the subjects provided written informed consent in accordance with the Helsinki Declaration of the World Medical Association.
3.2 Antibodies, other reagents, and flow cytometry
Anti-mouse CD107a (1D4B), anti-mouse c-Kit (2B8), anti-mouse IgE (RME-1), mouse IgG1 (MOPC-21), anti-human CD107a (H4A3), anti-Flag (L5) antibodies and FITC-Avidin were purchased from Biolegend. Human IgE Myeloma (401152) was purchased from CALBIOCHEM. Anti-human IgE (Dε2) (E124.2.8) was
purchased from BECKMAN COULTER. Annexin V, Trinitrophenyl (TNP)-specific mouse IgE (C38-2) was purchased from BD Bioscience. Anti-Syk (#2712) and anti-pSyk (#2711) antibodies were purchased from Cell Signaling Technology. TNP– ovalbumin (OVA), MFG-E8-D89E, MFG-E8-EPT, neutralizing and
CD300a-human Fc protein and anti-human CD300a (mouse IgG1, TX49) were made in our laboratory, as previously described 55,95.
1-oleoyl-2-{6-[(7-nitro-2-1,3-benzoxadiazol-4-yl) amino] hexanoyl}-sn-glycero-3-phosphoserine (NBD-PS) was from Avanti. Lipopolysaccharide (LPS; L2880) derived from Escherichia coli O55:B5, ATP (A26209), Ionomycin (I9657) were purchased from Sigma-Aldrich. PSVue480 and PSVue643 were purchased from Molecular Targeting Technologies. Recombinant mouse IL-33 was purchased from R&D (3626-ML).
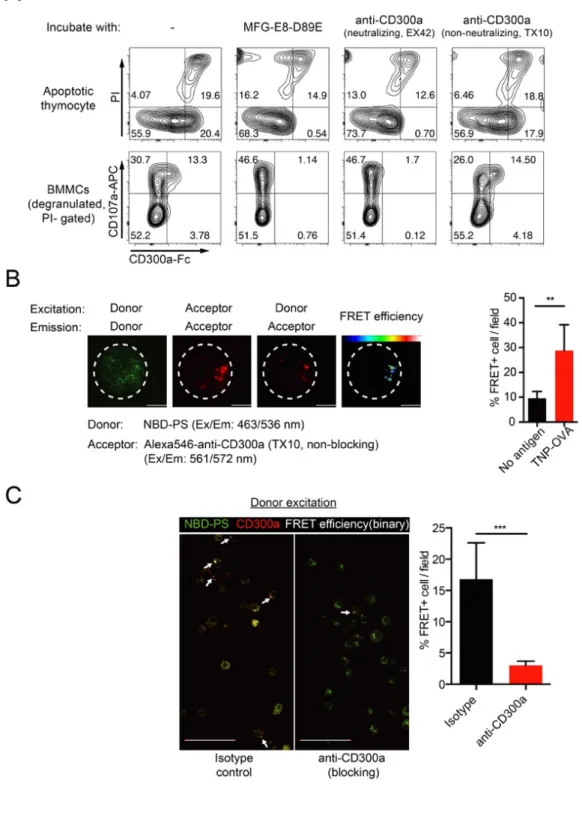
CD300a-Fc blocking experiment was done with either apoptotic cell induced by dexamethasone or degranulated BMMCs. Briefly, 105 cells were incubated with
CD300a-Fc together with 50ng anti-CD300a antibody (TX10 or EX42) or 100ng MFG-E8-D89E on ice for 15min, and further stained by anti-CD107a (for BMMCs only) and anti-human IgG Fc-PE (M1310G05, Biolegend) and PI.
Flow cytometry analyses were performed using a LSRFortessa system (BD Bioscience), and data were analyzed by using FlowJo software (BD).
3.3 Degranulation and other stimulations
For mouse in vitro stimulations, MCs were sensitized with 1 μg/ml TNP-specific IgE overnight, washed twice with Tyrode’s buffer, pre-incubated with reagents as
indicated for 30min, and then challenged with 1ng/ml TNP–OVA for 30min or indicated time point. β-Hexosaminidase activity was measured as previously reported 25. Briefly, 50 μl of the culture supernatant was mixed with 50 μl of
4-nitorophenyl-N-acetyl-β-D-glucosaminide (1.3 mg/ml; Sigma, N9376) in substrate buffer (0.4 M citric acid, 0.2 M NaH2PO4, pH 4.5) and incubated at 37°C for 3 h. The reaction was stopped by adding 100 μl of glycine (0.2 M, pH 10.7), the solution was thoroughly mixed, and then absorbance of 415 nm was determined. CD107a was measured by flow cytometry after staining with anti-cKit and anti-CD107a
antibodies and PI. Apoptotic thymocytes were induced in 0.2mM dexamethasone with 107 cell/ml RPMI medium for 12 hr. Cell density pictures were acquired under
20X objective lens under bright field and converted into binary by ImageJ.
For human MCs stimulation, cultured human synovial MCs were sensitized with 500ng/ml human IgE, stained with 50ug/ml anti-human CD300a or isotype control antibody, challenged with 300ng/ml anti-human IgE antibody for 30min, followed by staining with anti-human CD107a and PI, and analyzed by flow cytometry.
For measuring PS exposure of BMMCs after stimulations by LPS (1 μg/ml), IL-33 (150 ng/ml), TNP-OVA (10 ng/ml), ATP (0.5 mM), or ionomycin (2500 ng/ml), the cells were incubated with indicated reagents for 20 min after IgE
sensitization and then stained with antibody against CD107a, annexin V and PI. For measuring degranulation after ATP (0.5mM) or ionomycin (500ng/ml) stimulation, the stimulation time was 30min.
3.4 Live imaging
For time lapse-imaging, BMMCs were sensitized as mentioned above and then incubated in 500 µl of Tyrode’s buffer containing 1 mM PSVue-643 fluorescent probe (Polysciences, Inc.) in a glass-bottom dish (CELLview, Greiner Bio-One) for 30 min before gently adding 10 μl of TNP–OVA (100 ng/ml). Cells were monitored under a laser scanning confocal microscope (Olympus FV10i) at 10 s intervals under 60× optical magnification. Data were analyzed and exported by FV10-ASW
(Olympus). The video and montage were generated by ImageJ software with 10 frames/s. The confocal images of single mast cells were also collected and analyzed on the same platform with PS stained by PSVue480 and CD300a by Alexa647 conjugated anti-CD300a.
For imaging flow cytometry, the Image Stream Mark II system (Amnis) was used to observe single cells after 15min degranulation and staining. Data were acquired and analyzed by using the Inspire and Ideas software packages (Merck), respectively. The Bright Detail Similarity R3 Feature (based on Pearson correlation coefficient) was adopted as the localization measurement according to the
manufacturer’s instructions. Briefly, the Bright Detail Similarity R3 Feature value was calculated with a customized imaging mask to identify aggregation of the molecule of interest (CD107a or PS) on the cell surface. To detect colocalization of CD107a and PS, the mask was set on the CD107a channel with the following parameters: Threshold (M05, Ch05, 73) & Peak (M05, Ch05, Bright 10). To detect colocalization of CD300a and PS, the mask was set on the PS channel with
following parameters: Threshold (M05, Ch05, 60) & Peak (M05, Ch05, Bright 4). The data were exported as an FCS (Flow Cytometry Standard) file and analyzed by FlowJo (TreeStar).
For FRET analysis, TNP-specific IgE sensitized BMMCs was firstly stained by non-blocking anti-CD300a antibody TX10 (Alexa546 conjugated) for 15min and then labeled by 500nM NBD-PS in Hank's Balanced Salt Solution (HBSS) with 1mM CaCl2 for 8min in room temperature. The cells were immediately washed by 5
mg/ml fatty acid-free Bovine Serum Albumin (BSA) in HBSS with 1mM CaCl2. The
stained cells were challenged by TNP-OVA and observed under live imaging conditions with laser set 471nm/559nm and filter set 490nm-540nm and 570nm-620nm.
FRET efficiency was calculated by sensitized emission according to the FRET package instructions in FV10-ASW (Olympus).
Efficiency (E) = 1 − . . + 01234 ∗ 6Ψ88 Ψ99: ∗ ( Q8 Q9)
Ψ88, Ψ99: collection efficiency in donor and acceptor channel;
Q8, Q9 : Quantum yield of the donor and acceptor; 01234 = = − >?@4 − A?@4 =: Acceptor with donor excitation
>?@4 = 6B9: ∗ . A?@4 = 68C: ∗ D e: Donor with donor excitation
D: Acceptor with acceptor excitation
e, f and D were obtained using donor and acceptor double stained samples (FRET samples).
DSBT (donor spectral bleedthrough) and ASBT (acceptor spectral bleedthrough) were calculated by images from the donor/acceptor single stained sample excited by designated laser according to the package instruction to obtain the value a, b c and d. FRET+ cell percentage was calculated by counting the FRET+ cells in each field.
3.5 Phagocytosis assay
8-week old mouse were intraperitoneally injected with 2ml thioglycolate. Four days later, peritoneal cells were harvested by complete DMEM (10% FBS) and seeded in 48-well plate. Wash by warm PBS twice before adding degranulated and stained BMMC.
BMMC were sensitized by TNP-specific IgE for two hours and degranulated with 10ng/ml TNP-OVA in Tyrode’s buffer for 10min. After degranulation, BMMC were washed by warm Tyrode’s buffer and stained by 100ng/ml pHrodo Red
(ThermoFisher) in HBSS+1mM CaCl2 for 30min RT, followed by wash with
complete DMEM (10% FBS). Suspend 106 cells/ml in complete DMEM (10% FBS).
Add degranulated and stained BMMC into macrophage wells at 1:1 ratio and incubate for 60min. The reaction was stopped by aspirating the medium and adding 1mM EDTA and incubation for another 10min. Macrophages were detached by pipetting and stained for CD3e-FITC (145-2C11), CD19-FITC (1D3), NK1.1-FITC (PK136), Ly6G-FITC (1A8), KIT-Alexa488 (2B8), F4/80-APC (CI:A3-1), CD11b-APC-Cy7 (M1/70) with 2.4G2 on ice 30min. Phagocytosis was measured by YG-PE+ cells in lineage (FITC)-CD11b+F4/80+ gate.
Apoptotic thymocytes induced by 1µM dexamethasone overnight were used as positive controls.
3.6 Passive systemic anaphylaxis
WT and Cd300a-/- mice (age-matched 8- to 14-week-old females) were sensitized by
intravenous (i.v.) administration of 5 μg of TNP-specific IgE (BD Biosciences, C38-2) for 24 h and then i.v. challenged with 40 μg TNP–OVA. Body temperature was measured intrarectally at the indicated time points. For antibody blocking, a neutralizing anti-CD300a or isotype (400μg/mice) was injected i.p. 5 h before antigen challenge.
For staining ear tissue sections, 50 μg/mice MFG-E8-D89E (Flag-taged) were i.v injected together with or without 40μg/mice antigen. Ear tissue was harvested 10min after injection and fixed with formalin. Paraffin sections were deparaffinized, antigen retrieval was done by using AR6 buffer (PerkinElmer), staining for MCs by using FITC-Avidin (Biolegend) and PS by using PE-anti-Flag (L5, Biolegend).
3.7 Western blot analysis
One hundred thousand BMMCs were degranulated as described above and immediately washed with ice-cold PBS at the indicated time points. Cells were stimulated with 1 mM sodium orthovanadate and then lysed with 1% (w/v) NP40. The lysates were immunoblotted with antibodies against Syk or phosphorylated Syk.
3.8 Statistical analysis
Statistical analyses were performed using GraphPad Prism software (GraphPad Software). For comparing between two groups, statistical significance was
determined by 2-tailed unpaired Student t test with or without correction by Holm-Sidak method. For comparing more than two groups, statistical significance was determined by 2way-ANOVA multiple comparisons with Bonferroni's or Sidak's test. Error bars indicate SEM except for elsewhere mentioned.
4. Results
4.1 Characterization of PS exposure during mast cell degranulation 4.1.1 PS exposure is fast and persistent
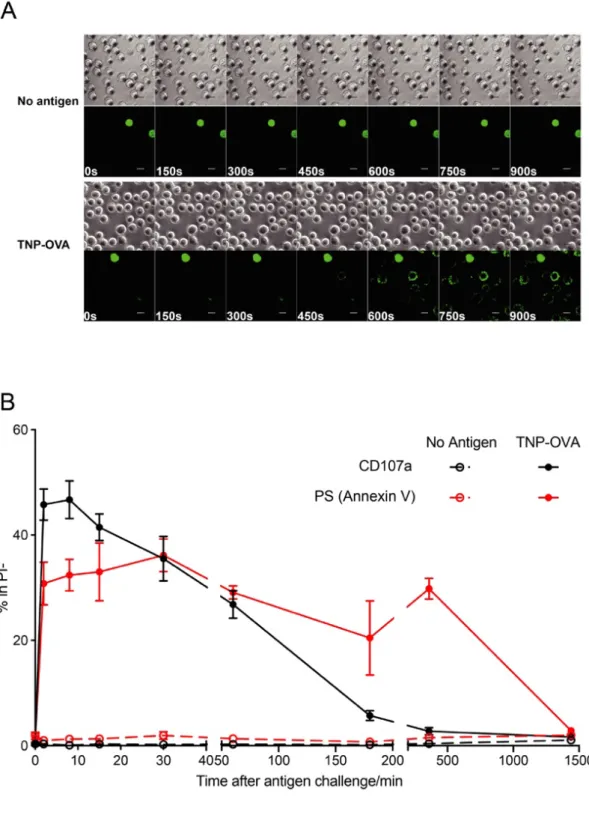
To observe PS externalization on the cell surface of viable MCs, we monitored surface PS exposure on TNP-specific IgE sensitized bone marrow-derived cultured MCs (BMMCs) by confocal microscopy during stimulation with TNP-OVA in the presence of PSVue 643, a fluorescent dye with rapid binding capacity for PS. The dye began to accumulate on the cell surface of live BMMCs within 600 s after gentle addition of antigen (FcεRI stimulation), whereas the non-stimulated BMMCs
remained negative for the staining (Fig. 2, A), indicating that PS is externalized within 10 min after activation.
In the time-laps imaging, antigen reached BMMCs through spontaneous diffusion because antigen addition must minimize the disturbance of the culture to maintain the focus. Therefore, the time after no-mixing antigen addition does not reflect the time after the FcεRI stimulation in the imaging culture. To further investigate the kinetics of PS exposure during degranulation, A quick mixing of antigen and BMMCs was performed immediately after the antigen addition. BMMCs were stimulated for indicated time period and transferred into ice cold Tyrode’s buffer to stop the degranulation, then PS exposure along with a degranulation marker - surface CD107a were measured by flow cytometry. As short as 2 mins after FcεRI stimulation, MCs strongly degranulated and externalized PS (Fig. 2, B). Different with degranulation marker CD107a, which began to decrease from 8 mins after stimulation, the exposed PS on MCs last for more than 6 hours without significant decay (Fig. 2, B). The PS exposure is reversible and disappeared 24 hours after antigen stimulation (Fig. 2, B), in consistency with the previous report.
4.1.2 PS exposure is associated with degranulation
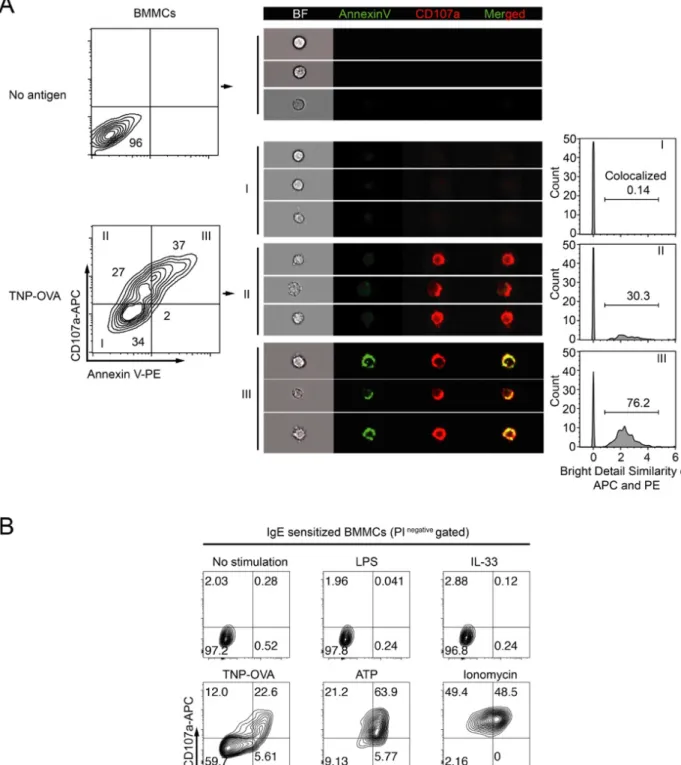
MCs can be activated by other non-degranulating stimulations, such as LPS and IL-33; MCs degranulation can also be induced by other stimulators other than FcεRI signaling. We tested PS exposure under different stimulations including
non-degranulators LPS and IL-33, and non-degranulators ATP and inonmycin. Interestingly, PS exposure was observed only under degranulation condition (Fig. 3, A and B). Both stimulations through TLR-4 by LPS and ST2 by IL-33 failed to induce PS externalization (Fig. 3, B). Indeed, the degranulation marker CD107a showed strong colocalization on the degranulated MCs with exposed PS (i.e., CD107a+
Annexin-V+) as observed by imaging flow cytometry, suggesting that PS exposure on the cell
surface of MCs is associated with degranulation (Fig. 3, B). Together, these data demonstrate that PS was promptly exposed together with CD107a during
degranulation of MCs.
4.1.3 PS+ MCs after degranulation are not subject to phagocytosis
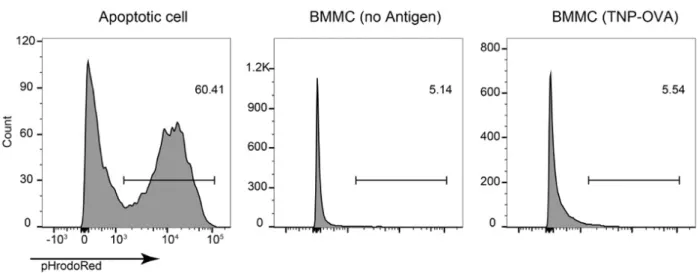
PS exposure on apoptotic cells serves as an “eat-me” signal for phagocytes engulfment. The relative long-time PS exposure (> 6hrs, Fig. 2, B) on stimulated MCs raised a question: Can phagocytes engulf PS+ live MCs?
To test this possibility, BMMCs were degranulated by FcεRI stimulation and stained with pHrodo, then co-cultured with mouse thioglycolate-induced peritoneal macrophages. No difference of the pHrodo-positive macrophage (CD11b+ F4/80+
gated) population was found between degranulated and non-degranulated MCs, although macrophages did strongly engulf apoptotic cells (Fig. 4). Therefore, PS+
4.2 Interactions of exposed PS and PS receptor CD300a during MCs degranulation
4.2.1 Co-localization of CD300a and PS during MCs degranulation
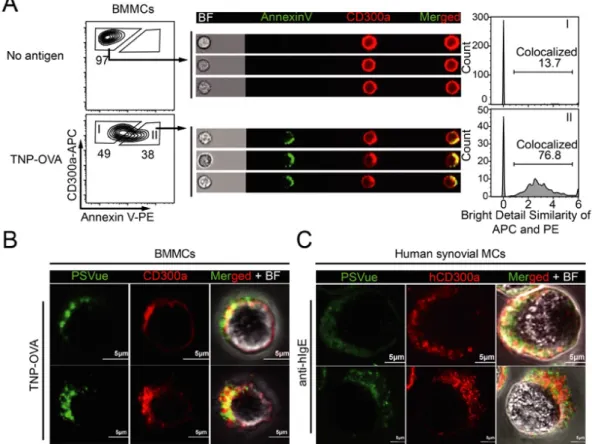
To investigate the function of exposed PS during MCs degranulation, we focused on an inhibitory immunoreceptor for PS, CD300a, which is abundantly expressed on MCs. By imaging flow cytometry analysis, we found that both PS and CD300a were polarized and co-localized on the cell surface of mouse BMMCs (Annexin V
stained) 15 min after FcεRI stimulation (Fig. 5, A). Higher magnification images by confocal microscopy revealed that the colocalized region of PS and CD300a also contained dot-like sub-regions on both mouse BMMCs and cultured human synovial MCs after degranulation (Fig. 5, B and C).
4.2.2 Interaction of CD300a and PS during MCs degranulation
To measure the direct interaction of CD300a and PS during MCs degranulation, fluorescence resonance energy transfer (FRET) analysis was performed using NBD-PS as a donor and a non-neutralizing anti-CD300a antibody (TX10, Fig. 6, A) conjugated with Alexa546 as an acceptor. The fluorescent PS (NBD-PS) was incorporated into MCs by incubation in RT and non-bounded PS was absorbed by 1% BSA. FRET efficiency calculated by sensitized emission between CD300a and PS was increased after degranulation compared with non-stimulated cells (Fig. 6, B). Moreover, treatment with a neutralizing anti-CD300a antibody (EX42) that
interferes the binding of CD300a with PS (Fig. 6, A) dramatically decreased the FRET+ cell number during degranulation (Fig. 6, C), demonstrating the direct
cis-interaction between CD300a and PS in the colocalized region of degranulating MCs. These data suggest that PS externalized during degranulation bound to CD300a on the same MC.
4.3 Functional analysis of PS and CD300a interaction during MCs degranulation in vitro
4.3.1 PS-CD300a interaction inhibits MCs degranulation
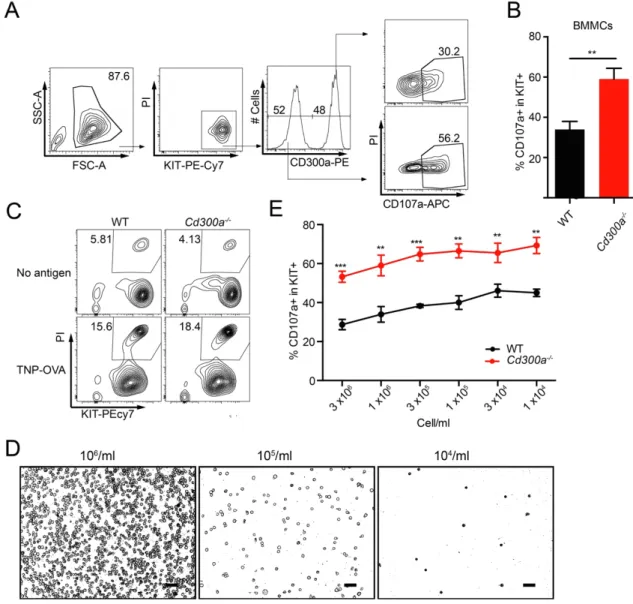
To examine the functional consequence of cis-binding between CD300a and PS, we next examined the degranulation of WT and Cd300a-/- BMMCs following
stimulation of FcεRI by addition of TNP-specific IgE and TNP–OVA. Flow
cytometry analysis showed that the size of the CD107a+ population was significantly
larger in Cd300a-/- BMMCs than in WT BMMCs from 8 min (480 s) to 30 min
(1,800 s) after stimulation (Fig. 7, A and B). Moreover, Cd300a-/- BMMCs produced
a larger amount of β-hexosaminidase than did WT BMMCs when they were analyzed 30 min after stimulation (Fig. 7, C).
Treatment with a neutralizing anti-CD300a antibody (EX42) increased CD107a expression on WT BMMCs to a level comparable to that of Cd300a-/-
BMMCs (Fig. 7, D). Similarly, a neutralizing anti-human CD300a antibody
increased the CD107a expression during FcεRI-mediated degranulation of cultured human synovial MCs (Fig. 7, E).
Interestingly, FcεRI stimulation also induced a polarization of FcεRI and colocalization of FcεRI with CD300a and PS (Fig. 7, F, G). Thus, the same spatio-temporal localization of CD300a, PS and FcεRI on MCs might cause CD300a-mediated suppression of FcεRI-CD300a-mediated CD107a expression during degranulation. Indeed, Syk phosphorylation was higher in Cd300a-/- BMMCs than in WT BMMCs
after antigen challenge at 10 min (600 s) after FcεRI stimulation, but was
comparable between WT and Cd300a-/- BMMCs at 2 min (120 s) after stimulation
(Fig. 7, H), consistent with our observation that degranulation was significantly higher in Cd300a-/- than WTBMMCs at 8 min (480 s), but not 2 min (120 s), after
indicate that the cis-interaction of CD300a with PS suppresses FcεRI-mediated signaling for degranulation of MCs.
4.3.2 PS-CD300a interaction-mediated inhibition of MCs degranulation is cell intrinsic and cell-cell interaction independent
To confirm the cell-intrinsic effect of CD300a on degranulation, equal numbers of WT and Cd300a-/- BMMCs were mixed and stimulated with TNP-specific IgE and
TNP–OVA. The CD107a+ population was again observed to be larger in Cd300a
-/-BMMCs than in WT -/-BMMCs (Fig. 8, A and B). We also measured that the population of PI+ dead cells were comparable between the cultures of WT and
Cd300a-/- BMMCs before and after stimulation of FcεRI (Fig. 8, C). Moreover, even
in the low concentrations of BMMCs in the culture, in which trans-interactions of CD300a with PS were unlikely, Cd300a-/- BMMCs still showed increased
degranulation compared with WT BMMCs (Fig. 8, D and E). These data suggested that the cell-cell interaction-mediated trans-interaction between PS and CD300a had little effect of the inhibitory function of CD300a. Therefore, the inhibitory function of CD300a on FcεRI-mediated MCs degranulation is dependent on cis-interaction between self-PS and CD300a.
4.3.3 cis-interaction of CD300a with PS specifically suppresses FcεRI-mediated MCs degranulation
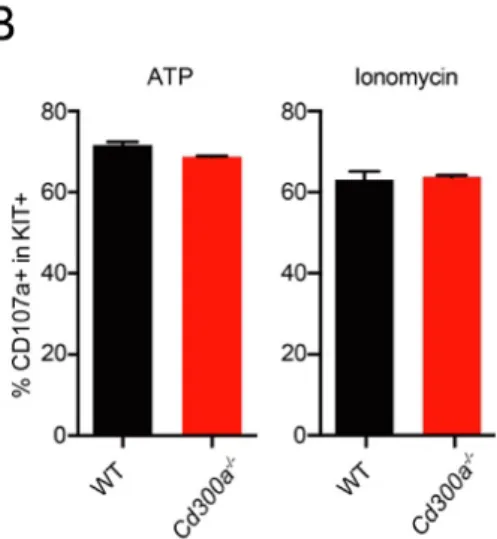
To gain insight of CD300a-mediated suppression of MCs degranulation induced by other degranulator other than FcεRI colligation, we visualized BMMCs by staining PS and CD300a after degranulation induction by ATP and ionomycin. Interestingly, although PS was promptly exposed after stimulation, CD300a did not aggregate on the cell surface therefore did not show polarized colocalization with PS (Fig. 9, A).
The degranulation measured by CD107a expression was also comparable between WT and Cd300a-/- BMMCs (Fig. 9, B). These data suggest the inhibition of MCs
degranulation mediated by cis-interaction of CD300a with PS maybe specific to FcεRI signaling.
4.4 Phenotype of CD300a deficient mice in a MC-dependent PSA model 4.4.1 Impaired recovery of CD300a deficient mice in a passive systemic anaphylaxis model
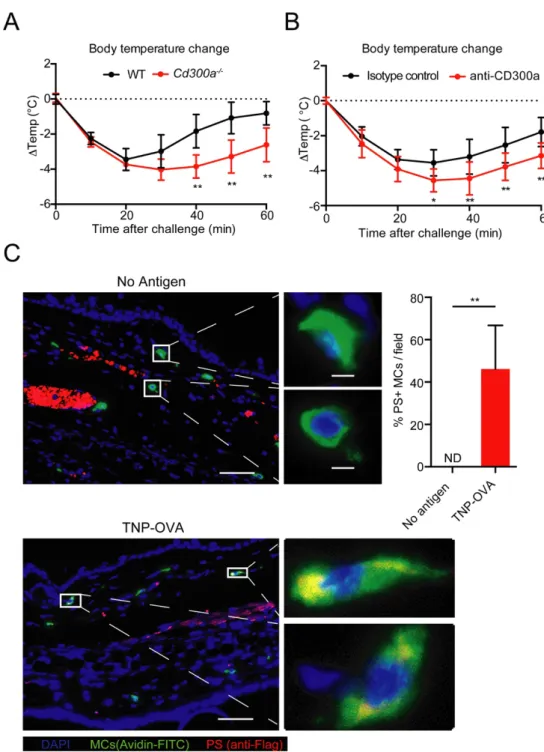
To investigate the in vivo function of CD300a-mediated degranulation suppression, we analyzed the role of CD300a in the pathogenesis of passive systemic anaphylaxis. WT and Cd300a-/- mice were i.v. injected with TNP-specific IgE, followed by an i.v.
challenge with TNP–OVA. Although rectal temperature of WT and Cd300a-/- mice
decreased to a similar level by 20 min (1,200 s) after the challenge, the recovery of the rectal temperature after this period was slower in Cd300a-/- mice than in WT
mice (Fig. 10, A), consistent with the time course of the self-regulation of MCs degranulation in vitro by CD300a. Similar results were also observed when mice were i.p. injected with a neutralizing anti-CD300a antibody (EX42) (Fig. 10, B), suggesting that the CD300a-PS interaction suppressed PSA.
4.4.2 Involvement of MCs CD300a and PS cis-interacting in vivo in a PSA model To investigate the possibility of cis-interaction between CD300a and PS on MCs in vivo during the course of PSA, Flag-tagged MFG-E8-D89E was intravenously injected together with TNP–OVA and ear tissue was harvested 10 min after the injection. As expected, polarized PS was detected only in the tissue MCs, rather than at regions surrounding MCs, ruling out the possibility of trans-interaction between
CD300a and PS in vivo, at least in this model. These results suggest that the cis-interaction regulated MCs degranulation in vitro as well as in vivo.
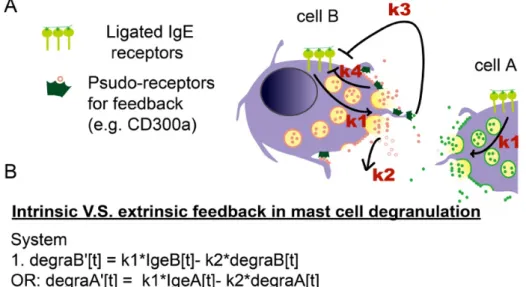
4.5 CD300a-mediated inhibition of degranulation is a cell-intrinsic feedback mechanism ---- additional evidence from a mathematic modeling approach To discriminate between the cell-intrinsic and cell-extrinsic mechanism of degranulation inhibition, a system of differential equations was constructed as a simplified mathematical representation of a two-cell interacting system (Fig. 11, A). System:
1. The degranulation change of Cell B (DegraB) = IgE signaling of cell B (IgeB) – self decay of degranulation product.
E(DegraB)
EK = L1 × IgeB(K) − L2 × DegraB(K) Or for degranulation change of Cell A,
E(DegraA)
EK = L1 × IgeA(K) − L2 × DegraA(K)
where, L1 is the efficiency of IgE signaling causing degranulation; L2 is the self decay rate.
2. The population of mast cell is assumed to be homogenous in response to antigen stimulation.
IgeA(K) = IgeB(K)
3. The Cell A IgE signaling change = intrinsic inhibition from Cell A itself + extrinsic inhibition from Cell B.
E(IgeA)
Or for IgE signaling change of Cell B, E(IgeB)
EK = −L4 × IgeB(K) − L3 × DegraA(K) where, L3 is the extrinsic inhibition efficiency and L4 is the intrinsic inhibition efficiency.
In this simplified system, both compromised intrinsic- and extrinsic- inhibition of MC degranulation gave higher degranulation than the normal system before the termination (Fig. 11, B). However, system with compromised intrinsic-inhibition, as manipulated by decreased L4, terminated the degranulation at similar time point as the Normal system, while system with compromised
extrinsic-inhibition, as manipulated by decreased L3, had longer time of degranulation and terminated at a later time point than the Normal system (Fig. 11, B).
Interestingly, the Cd300a-/- BMMCs not only showed increased
degranulation before termination, but also terminate the degranulation at a similar time point as WT BMMCs did (Fig. 7, B and Fig. 11, B), representing traits of the system of compromised intrinsic-inhibition. Therefore, Cd300a-/- BMMCs is
impaired of cell-intrinsic but not extrinsic inhibition of degranulation, consistent with the notion that PS-CD300a cis-interaction-mediated inhibition of MCs degranulation is cell intrinsic and cell-cell interaction independent.
5. Discussion
5.1 Cis vs trans-interaction and their pathophysiological significance
In current study, we identified a novel regulatory pathway where externalized PS on degranulated MCs serve as a cell-intrinsic negative feedback to down-regulate the degranulation after the onset by binding to an inhibitory receptor CD300a on the same cell, adding another layer of regulation on the MCs degranulation (Fig. 12).
In contrast with previous report, MCs CD300a-mediated inhibition on TLR-4 signaling is dependent on trans-interaction between MCs and apoptotic cells in a cecal ligation puncture model of sepsis19. Indeed, TLR-4 stimulation did not induce
the PS exposure on MCs (Fig. 3, B), indicating the distinct ligand origins and
requirements of CD300a in different MCs activation condition. As shown in the PSA model, the PS availability for MCs is restricted to itself, suggesting the probable cis-interaction between CD300a and PS in vivo. Lack of CD300a-PS cis-cis-interaction resulted in impaired recovery of body temperature from this PSA model. Although how enhanced MCs degranulation translated into impaired recovery in vivo remains intriguing, these results highlight the importance of cis-interaction between CD300a and self-PS in the pathogenesis of PSA. Therefore, previous and this study together clearly suggested that the relative importance of trans- and cis- interaction between receptors and ligands depends on their availability in different pathophysiological situations.
CD300a in this study is an example of cis-interaction mediated self-regulation of MCs degranulation. MCs express many other receptors on their cell surface which have regulatory functions on MCs activation while their natural ligands are largely unknow 42,99. The degranulated MCs may express their ligands on
region and human IgG1 constant region (CD300a-Fc) bound to MCs after
degranulation (Fig. 6, A). Using chimeric protein of other MCs receptors might be able to identify candidates functioning in the similar scenario as CD300a during MCs degranulation.
Importantly, given the rich inflammatory mediator and protease content released after MCs degranulation, MCs activation is a strong immunogenic and maybe disruptive process, therefore should be extensively controlled. However, given that MCs distribution in the tissue in a scattered manner3, the ligands of its
receptors may not be always available without inflammation, highlighting the importance of self-regulatory characteristic of MCs in their activation control.
5.2 PS exposure and recovery
Although PS exposure is a well-established phenomenon after MCs degranulation, the detailed kinetics and characteristics are unknown. In this study, we examined degranulating MCs by live imaging, imaging flow cytometry and flow cytometry with different focus. Live imaging of PS exposure during degranulation identified the PS exposure is minutes-scale event (Fig. 2, B) distinct from apoptotic PS exposure, which takes hours to occur100. In addition, imaging flow cytometry
identified the co-localization of externalized PS and a degranulation marker surface CD107a as well as an inhibitory PS receptor CD300a. Interestingly, the co-localized areas were often polarized on the cell membrane together with IgE receptors (Fig. 3, B, Fig. 5, Fig. 7, F, G), indicating the PS exposure is directly associated with
degranulation which happened primarily in the vicinity of the initial FcεRI clusters. The PS+ area contained both patches-like and dot-like PS+ regions (Fig. 2 and Fig. 5,
observations may support the idea that PS is present on the inner membrane of intracellular vesicles (e.g. endosomes or secretory granules)101.
Exposed PS of apoptotic cell is an “eat-me” signal for macrophages. On the other hand, PS+ MCs after degranulation cannot be engulfed by phagocytes (Fig. 4),
even the PS persisted on the membrane for more than 6 hrs after degranulation (Fig. 2, B). Nonetheless, the MCs internalized PS within 24 hrs after degranulation (Fig. 2, B) with unknown machinery94, presumably depend on the flippase activity as
evidenced in other types of cell62. This MCs specific flippase is of particular interest
because flippase mutated cells with stable PS exposure can be engulfed by
phagocytes through TAM receptors87. A stable PS exposure after MCs degranulation
maybe essential for its engulfment by phagocytes68,73.
5.3 CD300a specificity
CD300a-PS interaction during MCs degranulation showed specific inhibition on FcεRI signaling but not ATP or ionomycin induced degranulation pathways (Fig. 9). In a rat basophilic leukemia cell line, transduced CD300a suppresses FcεRI signaling by phosphatase recruitment through its ITIM motifs102. In FcεRI mediated
degranulation, Syk phosphorylation is one of the important targets of CD300a (Fig. 7, H). It is likely that ATP and ionomycin induced degranulation by causing calcium influx directly into the cytoplasm through activation of cation channels and initiate degranulation without primary requirement of upstream kinase (e.g. Syk)
phosphorylation, therefore the inhibitory effect of CD300a was negligible in these situations. In contrast with our observation, another inhibitory receptor of CD300 family, CD300lf, showed modest inhibition of ATP induced MCs degranulation, although the targeted signaling pathway remain elusive103.
5.4 Technical advances and caveat
5.4.1 PSVue as degranulation monitoring reagent
In this study, we frequently used a small molecule PSVue as a probe for PS detection. The fast binding of PS and PSVue provided a possibility of real-time monitoring of MCs degranulation through its PS exposure. This method is similar with previously reported method using fluorochrome-labeled avidin. Further comparison might be performed to evaluate both methods in parallel.
5.4.2 Protein-lipid FRET
FRET is a sensitive and challenging method frequently used to address protein-protein interactions using FRET parries of fluorescent protein-proteins or fluorophores in situ104. However, functional interactions in a biological system are not limited to
proteins. For example, cells express receptors for lipids (e.g. PS) and carbohydrates (e.g. nuclic? acids). However, FRET technique is rarely used to assess these
interactions in situ, probably due to lack of proper labeling methods of lipids and carbohydrates.
In current study, we utilized a fluorescent labeled lipid NBD-PS as a FRET donor and non-neutralizing anti-CD300a antibody (TX10, alexa546 conjugated) as an acceptor to perform FRET analysis between CD300a and its natural ligand PS on degranulated MCs. We observed FRET signals (sensitized emission) after MCs degranulation indicating the direct binding of CD300a and its ligand. Moreover, this binding is further confirmed by the dramatic decrease of FRET signals after
treatment of a neutralizing antibody against CD300a to block PS binding (Fig. 6, C). Although NBD-PS did not represent all the PS in MCs, which probably lead to the underestimation of all the FRET event, this is the first method to measure in situ
The further modification of this method should consider optimal lipid labeling condition and using fluorescence protein-tagged target protein instead of fluorescence-conjugated antibody.
5.4.3 Mathematical modeling
Our mathematical modeling of MCs degranulation reflects the impacts of cell-intrinsic and extrinsic feedbacks on MCs degranulation process. The system is composed of two cells with three differential equations and is capable of simulate the differential influence of cell-intrinsic and extrinsic feedbacks on the termination of degranulation. It is obvious that the system is over-simplified and further
modification of this system should increase the complexity of the signaling networks and cellular components. Nonetheless, current model provides an additional
evidence upon our imaging and functional analysis, supporting the cis-interaction between CD300a and PS.
5.5 Future directions
CD300 deficient MCs and mice only showed a modest phenotype in degranulation and PSA, respectively, raising possibility of other candidates participating in the regulation pathway with similar scenario (negative feedback). In addition, Fc protein of certain inhibitory receptors on MCs could bind to degranulated MCs as CD300a-Fc did (data not shown). Therefore, identifying other candidates by strategy
described in 5.1 may provide further evidence and the significance of the cis-interaction mediated negative-feedback in MCs degranulation regulation.
Other cell types, such as other granulocytes, natural killer cells, cytotoxic T cell and neurons, are also capable of degranulation. The presence of such
degranulation regulatory machinery in other cell types is of great interest and should be systematically investigated.
6. Conclusion
In conclusion, by combining imaging and functional analysis of MCs degranulation, we revealed the physical and functional associations of externalized PS with CD300a via cis-interaction on viable MCs during degranulation. Given that MCs are widely distributed in many tissues in a scattered manner without contact each other and apoptotic cells, such self-regulation of MC degranulation represents a novel strategy that MCs evolved to control their own activation, adding another layer of regulation in allergic responses (Fig. 12).
7. Figures
Fig. 1 FcεRI signaling and inhibitory receptors in MCs degranulation.
Cross-linking of FcεRI by antigen drives the phosphorylation of Syk by Src family kinases. Phosphorylated Syk further phosphorylates protein kinase C (PKC) and phospholipase C gamma (PLC γ), resulting in degranulation. The inhibitory
receptors play important yet unclear roles in suppressing degranulation through their interaction with their natural ligands on neighboring cells, MCs itself or not yet identified.
Fig. 2 Kinetics of PS exposure during MCs degranulation
(A) BMMCs were sensitized with TNP-specific IgE and stimulated or not with TNP– OVA in the presence of PSVue643. Time-lapse montage of BMMCs by confocal microscopy shows PS externalization. Dead cells were used as a PSVue-643 staining positive control. Scale bars, 10 μm.
(B) Flow cytometry analysis of cell surface CD107a and PS expression. TNP-specific IgE sensitized BMMC were stimulated or not by 10 ng/ml TNP-OVA for indicated time and stained with CD107a and PSVue on ice then analyzed by flow cytometry.
Fig. 3 Characterization of PS exposure during MCs activation
(A) BMMCs were sensitized with specific IgE, stimulated or not with TNP-OVA for 15 min, stained with anti-CD107a antibody and annexin V, and
PS was analyzed using bright detail similarity R3 based on images of single cells in corresponding gates (right, see section 3.4).
(B) BMMCs were sensitized with TNP-specific IgE, stimulated with indicated reagents for 20 min, stained with anti-CD107a, annexin V and PI, and analyzed on the gate of PI- cells by flow cytometry.
Fig. 4 PS+ MCs after degranulation are not subject of phagocytosis by macrophage.
BMMCs were sensitized with TNP-specific IgE and degranulated or not with 10 ng/ml TNP-OVA, then stained with pHrodoRed, cocultured with peritoneal macrophages for one hour. Macrophages after coculture were detached and live Lineage- CD11b+ F4/80+ cells were gated for pHrodo+.
Fig. 5 Localization of PS and PS-receptor CD300a on degranulated MCs
(A) BMMCs were sensitized with specific IgE and stimulated or not with TNP-OVA for 15 min, then Stained with anti-CD300a and annexin V, and analyzed by
imaging flow cytometry. Representative gating (left); single cell images (center); and colocalization of CD300a and PS analyzed using bright detail similarity R3 based on images of single cells (see section 3.4) in the indicated gate (right). (B) BMMCs were sensitized with TNP-specific IgE, stimulated or not with TNP-OVA
for 15 min, stained with anti-mouse CD300a, and analyzed in the presence of
PSVue480 under confocal microscopy.
(C) Cultured human synovial MCs were sensitized with human IgE, stimulated with anti-human IgE or isotype control antibody for 15 min, stained with anti-human CD300a, and analyzed in the presence of PSVue480 under confocal microscopy.
Fig. 6 FRET measurement between CD300a and PS
(A) Apoptotic mouse thymocytes induced by treatment with dexamethasone or degranulating BMMCs induced by antigen stimulation were incubated with MFG-E8-D89E, neutralizing anti-mouse CD300a (EX42), or non-neutralizing anti-mouse CD300a (TX10) together with chimeric mouse CD300a-Fc, followed
by an PE-conjugated antibody against human IgG and PI, in the presence of CaCl2, and analyzed by flow cytometry.
(B) BMMC was sensitized with TNP-specific IgE, labeled with NBD-PS and non-neutralizing anti-CD300a antibody (TX10, alexa546 labeled) and stimulated by TNP-OVA. FRET analysis between CD300a and PS: representative confocal pictures (left) and FRET+ cell quantification (right) (see section 3.4). Scale bars,
5 μm. Error bars indicate SD.
(C) FRET analysis of the CD300a-PS interaction on BMMCs as in (B) except that the cells were pretreated with either isotype or anti-CD300a neutralizing antibody during degranulation. Representative merged image (left) and FRET+
Fig. 7 Functional interaction between CD300a and PS externalized during degranulation of MCs
(A-C) WT or Cd300a-/- BMMCs were sensitized with TNP-specific IgE and
stimulated or not with TNP–OVA for 30 min (A, C) or the indicated time (B). (A) Representative plots showing CD107a expression on the gate of PI- c-Kit+ cells.
(B) Kinetics of CD107a expression after antigen stimulation. (C) β-hexosaminidase release in the culture after degranulation.
(D) WT and Cd300a-/- BMMCs were sensitized with anti-TNP IgE and pretreated
with a neutralizing anti-CD300a antibody or control antibody, followed by challenge with TNP-OVA antigen. BMMCs were then analyzed for CD107a expression on the gate of PI- c-Kit+ cells by flow cytometry.
(E) Cultured human synovial MCs were sensitized with human IgE and pretreated with a neutralizing anti-human CD300a antibody or control antibody, followed by challenge with anti-human IgE, and then analyzed for CD107a expression by flow cytometry on the gate of PI- c-Kit+ cells by flow cytometry.
(F, G) BMMCs were sensitized with specific IgE, challenged or not with TNP-OVA antigen for 15 min, then stained with anti-IgE and anti-CD300a antibodies (F), or PSVue643 plus either anti-IgE or anti-cKit (G), and analyzed by imaging flow cytometry.
(H) Western blot analysis of Syk phosphorylation in whole cell lysates of degranulated WT and Cd300a-/- BMMCs at indicated time points. The relative
amount of phosphorylated Syk, as determined by densitometry, before and after stimulation is also shown. Data are representative of two independent experiments.
Fig. 8 Increased degranulation in Cd300a-/- BMMCs is cell intrinsic and independent
of cell-cell interaction
(A, B) WT and Cd300a-/- BMMCs were equally mixed and sensitized with
TNP-specific IgE, stimulated with TNP–OVA for 30 min, stained with antibodies against CD107a, c-Kit, and CD300a and PI and analyzed by flow cytometry. Data are representative plots (A) and the mean CD107a expression (B) showing in WT and Cd300a-/- BMMCs.
(C) WT and Cd300a-/- BMMCs were sensitized with anti-TNP IgE, challenged with
TNP-OVA for 30 min, stained with anti-c-Kit and PI, and analyzed by flow cytometry.
(D, E) WT and Cd300a-/- BMMCs were sensitized with anti-TNP IgE, diluted into
different density (scale 50μm) (D), and then challenged with TNP-OVA for 30 min. BMMCs were then stained with antibodies against CD107a and c-Kit and PI, analyzed by flow cytometry (E).
Fig. 9 ATP and ionomycin induced MCs degranulation
(A) BMMCs were sensitized with TNP-specific IgE, stimulated with indicated reagents for 20 min, stained with anti-CD300a antibody and PSVue643, and analyzed by imaging flow cytometry.
(B) WT and Cd300a-/- BMMCs were stimulated with 0.5 mM ATP or 500 ng/ml
ionomycin, stained with anti-CD107a, anti-cKit and PI, analyzed by flow cytometry.
Fig. 10 Involvement of CD300a-PS cis-interaction in a PSA model.
(A) Change in intrarectal temperature in WT (n = 6) and Cd300a-/- (n = 6) mice
after i.v. sensitization with TNP-specific IgE, followed by i.v. challenge with TNP–OVA. Data are pooled from two experiments and error bars indicate SD.
(B) Change in intrarectal temperature in mice injected i.p. with control (n = 8) or anti-CD300a (n = 9) antibody after i.v. sensitization with TNP-specific IgE,
followed by i.v. challenge with TNP–OVA. Data are pooled from three experiments and error bars indicate SD.
(C) Immunohistochemistry analysis of PS exposure in MCs during PSA. WT mice were sensitized with TNP-specific IgE 24hr before injection of 50 μg MFG-E8-D89E (Flag-taged) together with or without 40 μg TNP-OVA antigen. Ten min after the injection, ear tissue sections were stained for MCs by FITC-conjugated Avidin and for PS by PE-conjugated anti-Flag antibody. Scale bars: 50 µm (tissue view) and 5 µm (enlarged cell view).
Fig. 11 Mathematical modeling of MCs degranulation with intrinsic and extrinsic feedback regulation
Fig. 12 Graphical summary