九州大学学術情報リポジトリ
Kyushu University Institutional Repository
高温高圧下における低含水率デンプンの熱溶融特性 に関する研究
井倉, 則之
https://doi.org/10.11501/3135195
出版情報:Kyushu University, 1997, 博士(農学), 論文博士
CJ
CHEMICAL AND PHYSICAL CHARACTERIZATION OF LOW-MOISTURED STARCH MELTS AT HIGH TEMPERATURE AND HIGH PRESSURE
BY
NORIYUKI IGURA 1998
LABORATORY OF FOOD PROCESSING, DEPARTMENT OF FOOD SCIENCE AND TECHNOLOGY, FACULTY OF AGRICULTURE
KYUSHU UNIVERSITY
CONTENTS
Chapter I Introduction 1
Chapter II Effect of water states on thermal properties of starches 11 1
2 3 4
Chapter III
1 2 3 4
Chapter IV 1 2 3 4
Introduction
Materials and methods Results and discussion Summary
Effect of moistur e content and applied pr essur e on flow- starting temperature of starch melts
Introduction
Materials and methods Results and discussion Summary
Flow properties of low-moisturized starch melts Introduction
Materials and methods Results and discussion Summary
11 13 16 32
34 34 36 40 46
47 47 49 53 64
Chapter V Effect of shearing force on depolymer ization of starch melts at an elevated temperature
1 Introduction
2 Materials and methods 3 Results and discussion 4 Summary
Chapter VI Effect of longer heating time on depolymer ization of starch melts
1 Introduction
2 Materials and methods 3 Results and discussion 4 Summary
Chapter VII Effect of time-temper atur e and strain histor y on flow property and de polymerization of starch melts
1 2 3 4
Introduction
Materials and methods Results and discussion Summary
65 65 67 73 88
89 89 91 92 101
102 102 104 107 115
Chapter VIII Conclusion 117
References 123
Acknowledgment 135
CHAPTER I
Introduction
It is well known that all heterotrophs, including the human race and another animals, directly and/or indirectly assimilate an organic compound which is photosynthesized by green plants. The major product from plant photosynthesis is a car bohydr ate which includes a starch, a saccharose and a cellulose. The starch especially is a major plant carbohydrate used in germination. This starch is distributed around the plant kingdom, particular ly in the storage tissue of gr ain and root crop, for example in r ice, wheat, cor n, potato and sweet potato and so on. These grains and root crops have been used as a major food source for the human race and by other animals (Nakamura, 1977). This starch is stored in plants as compact micron-sized (2""' 150 nm) granules that are partly crystalline
and, hence, water-insoluble, thus facilitating the isolation and handling of starch (Zobel, 1984).
Starch is a homoglycan composed of a single sugar unit regardless of the sour ce of the starch, and was discovered by happenstance during investigations by Kirchoff, a German attached to the Russian Imperial Academy of Sciences at St. Peter sburg. Kirchoff obtained, unexpectedly, a sweet tasting product, a-D
glucose, on extended hydrolysis of wheat and potato starches with dilute sulfuric acid (Kirchoff, 1811). However it had been believed that the molecular structure
of starch was made of only one polymer composed of glucose, until Meyer eta!.
(1940) found that star ch was made of two diff erent polymer type, as they wer e
r esearching the hot water extracting capabilities of corn starch. One is amylose which is linked with a-1-4 glucosidic bond to a linear chain structure, the other is amylopectin linked with a-1-4 glucosidic bond and a-1-6 glucosidic bond to a branched structure. It is not an overstat ement to say that the study of the molecular structure of starch has progressed rapidly because of this finding.
The industrial utilization of starch has also been going on for a long time.
Starch has been used not only as foods but also as an ingredient in manufacturing a wide range of industrial products, such as paper, textiles, and building materials. A first step in starch utilization generally is one that disrupts the granular structure leading to granule swelling and hydration, and solubilization of starch molecules. These events, referred to collectively as starch gelatinization, are commonly effected by heating granules that ar e slurried in water (Zobel, 1984). The physical and chemical properties of star ches change by the
gelatiniazation. Many investigations on the measurement of starch gelatinization have been performed following changes such as change in light transmission, loss of birefringence, thermal transition and structural changes in starch granules and the crystalline region (Morgan, 1940; Schoch & Maywald, 1956; Watson, 1964;
Borch & Marchessault, 1968; Kainuma et al., 1968; Stevens & Elton, 1971;
Miller et al., 1973).
Furthermore, the starch is frequently modified by the addition of heat, acids,
oxidizing agents and several functional gr oups in order to obtain availabilities other than gelatinization only. Heating dry starch to high temperature, dry
roasting, causes the depolymerization of starch and the condensati on of starch fragments, which are called pyrodextrins or dextrins. Dextrins are the most important modified starch obtained by dry-roasting (Ogura, 1977). Dextrins are classified into three gr oups based on the method of preparation (Greenwo od, 1967� Tomasik et al., 1989). White dextrins are prepared from starch in the presence of an acid catalyst for a relatively short time (3 � 8 hours) in
temperature ranges between 79 and 120 °C, yell ow or canary dextrins are prepared from starch in the presence of an acid catalyst 6 to 18 hour at 150 t o 220 ° C , and British gums are prepared from starch without any catalyst for 10 t o 20 h our at 130 to 220 °C. Many researches have been performed on the physical
and chemical properties of dextrins, starches dry-roasted at elevated temperature (Thompson et al., 1953, 1954� Jencks, 1959� Bryce & Greenw o od, 1963a, b;
Lorenz & Johnson, 1972; Kainuma et al., 1973; Uen o et al., 1976; Prey et al., 1977� Prey & Gruber, 1977a, b; Gloyna et al., 1991).
Starches, or grains and root crops c ontaining starch, are als o widely used for food additives, such as sweeteners and sticks, and as components of food products, such as snacks and pastas in order t o pr ovide the taste, characteristic visc osity, texture and consistency. Since food is usually subjected to thermal treatment in processing or c ooking, as the behaviour of gelatinization and starch modificati on by thermal treatment, mentioned ab ove, must be c onsidered.
Extrusion cooking is one in which food processing is done with ther mal treatment. Usually extrusion cooking is performed under high temperatures and high pressures with low moisture content in order to produce a variety of products using food polymer, such as protein and starch. Food polymers with low moisture content have fluidity in the condition of high temper ature and pressure, as in an extruder barrel. Clarification of the flow behavior of the food polymer is available for the development of an apparatus and the process control.
Several researchers have attempted to develop a viscosity model for the food polymers at high temperatures and pressures using an extruder. Remsen & Clark ( 1978) developed a viscosity model for cooking dough as a function of applied shear rate, moisture, temperature and time-temperature history using an extruder. Morgan et al. (1989) and Dolan et al. (1989) applied the effect of strain history to the four variables above in a model to protein dough and starch dispersion model, respectively. Mackey & Ofoli (1990a, b) modified the model of Morgan et al. (1989) for use in determining the viscosity of starch based products using an extruder. Although extrusion cooking is, however, carried out within one piece of equipment, it cannot be considered as a unit operation, because it performs a large number of functions as the food mix or dough progresses along the screws and barrel: transport, grinding, hydration, shearing, homogenization, mixing, dispersion of residence times, compression, degassing, thermal treatment, compacting, agglomeration, pumping, orientation of molecules or aggregates. Furthermore, since retention time in the extrusion
barrel varies by varying of the shear rate, screw speed and feed rate, the effect of time-temperature history and strain history on materials also vary. This is not say that the viscosity model using an extruder precisely represents the flow property of starch. Thus the flow properties of starch with low moisture content at high temperature and pressure, using a capillary tube viscometer, which can be used at high temperatures and pressures without evaporating moisture, are investigated.
Native starch usually forms an insoluble granular structure, as mentioned above, and has a solid phase at a low moisture content at room temperature. As native starches with high moisture content heat up, the starch granules swell, disrupt and fluidify causing gelatinization. Collison & Chilton (1974), however, reported that potato starch containing up to
30
% water(0.43
g-H20 I g-solid)was not gelatinized by heating. Thus gelatinization could not happen in an extruder using low moisturized starch. When observing the detailed structure of a starch granule, it is generally believed that there are two regions in the native starch granule. One is a crystalline region and the other is an amorphous or gel phase (French, 1984). A perfectly crystalline polymer melts at a defined temperature. Discontinuous changes in volume and enthalpy, primary thermodynamic variables, accompany melting. In an amorphous polymer at lower temperature, the molecular motion of the polymer chains is "frozen" in a random conformation, rendering it glassy and immobile. When thermal energy is applied, molecular motion is initiated and the molecules have sufficient energy
to slide past one another (Levine, 1983). At this point, the polymer becomes viscous, rubbery and flexible. This physical change is called the glass transition.
These thermodynamic transitions can be often measured by calorimetric methods. Some researchers have studied the thermodynamic transition of low moisturized starch using a differential scanning calorimeter (DSC) (Donovan, 1979; Biliaderis et al., 1980, 1986; Wang et al., 1991; Qu & Wang, 1994). They
reported that two peaks are observed in the DSC curves of starches at low moisture contents. The phase transition peaks of the lower temperature range can be considered starch gelatinization (include glass transition), and that of the higher temperature range can be considered to be the melting of starch crystallites. These researches conclude that these phase transitions are affected by the moisture content, that gelatinization occurred at a relatively high moisture content, and that melting occurred at a relatively low moisture content.
Incidentally, it is well known that there are roughly two states of water in polymeric materials. One is free water, the other is bound water (Ross, 1978;
Nakamura et al., 1981; Noguchi, 1992). The bound water is often measured by DSC or differential thermal analysis (DT A) as the unfreezable water is unable to freeze well below 0 OC (Duckworth, 1971; Muffet & Snyder, 1980).
Gelatinization and melting can be affected by the water states of starch under the conditions of low moisture contents in which unfreezable water can be dominant.
Thus, the effect of the water states on the phase transitions of starches at low moisture contents is investigated here using DSC.
In an extrusion cooking, the food polymers are subjected to not only heat but also to shearing-force by kneading in the extrusion bar rel. Thus, how the shearing-force also affects the food polymers in order to obtain optimal products by extrusion cooking must also be considered. Many researchers have investigated the physico-chemical and structural changes of starches in which the screw speed was regarded as shearing-force. Initial studies on extrusion cooking were done by Conway et al.
(1968)
and Anderson et al.(1969).
They felt that low moisture extrusion, which provided high temperatures and shear rates, enhanced the degradation of starches and the for mation of dextrins. Mercier & Feillet(1975)
investigated the effect of the extrusion temperature and moisture contentof cereal starches on expansion ratio, paste viscosity, water absorption index and aqueous ethanol or water solubility. They concluded that the amount of soluble star ch increased with increasing extrusion temperature and with decreasing moisture content, without the formation of maltodextrin.
Chiang & Johnson
( 1977)
studied the influence of extrusion variables on the gelatinization of wheat flour using a single screw extruder. At temperatures above80
°C, gelatinization of starch in the sample sharply increased. Higher moisture also gave a higher degree of gelatinization. Increasing screw speeds gave lower levels of gelatinization because it reduced the residence time of the sample in the extruder. On the other hand, Gomez & Aguiler a(1983, 1984)
observed that decreasing moisture content resulted in a higher degree of gelatinization for both ground white cor n and corn starch. Bhattacharya &
Hanna ( 1987) also obtained similar results with waxy and ordinary corn that the degree of gelatinization increased as the moisture content of the sample decreased, and the extruder barrel temperature increased.
Gomez & Aguilera (1983) reported that the extent of starch degradation progressed during low moisture content and high shear extrusion. Owusu-Ansah et al. (1983) also pointed out that the overall physicochemical results indicated some hydrolytic breakdown of starch during extrusion. After this research, many researches showed that the effect of extrusion variables on the degradation (depolymerization) of starches were performed in view of molecular weight distribution from gel permeation chromatography, average molecular weight from intrinsic viscosity (Davidson et al., 1984a, b; Chinnaswamy & Hanna, 1990; Tang & Ding, 1994) and surface observation by scanning electron microscopy (Gomez & Aguilera, 1984; Owusu-Ansah et al., 1984).
These investigations were carried out using an extruder, and considered the effects of the temperature of the extruder barrel and moisture content before extrusion, which related to feed rate, screw speed regarded as residence time, and shearing-force on starchy products in the barrel. However, an extruder include various unit operations, mentioned above, such that the behaviour of materials in an extrusion barrel is very complex. For this reason, the extent of physicochemical changes including depolymerization of starch, tend to be irregular in terms of the type of extruder. Thus how the physicochemical properties of starches are effected by temperature, moisture content, shearing-
force, strain history and time-temperature history us1ng capillary tube viscometer have been investigated, along with the way in which the shearing force can be generated through the capillary tube only .
The main purpose of this research is to characterize the thermal properties of starch with low moisture content in order to obtain the most basic information on processing food using starchy materials. The present study makes it clear that potato, sweet potato, corn and wheat starches melt under high temperatures and high pressures, and that the properties of starch melt using a capillary tube viscometer. Furthermore, this study introduces the effects of heat and shearing-force on breakage or depolymerization of low moisturized starches under high temperatures and high pressures .
All the investigations carried out in the present study are su1nmarized as follows:
1)
The effect of moisture content and water state on gelatinization and melting starch has been determined using a differential scanning calorimetry .2)
The effect of moisture content and applied pressure on flow-starting temperature in low moisturized starch melts has been determined using a capillary tube viscometer.3)
The flow properties of low moisturized starch melting at an elevated temperature has been determined using a capillary tube viscometer.4)
The effect of shearing force, which was taken place through a capillar y tube, on starch granules and the depolymerization of starch melting at anelevated temperature has been determined.
5)
The effect of longer heating time on depolymerization in starch melting atan elevated temperature has been determined.
6) The effect of time-temperature and strain history on flow property and depolymerization of star ch melting at an elevated temperature has been determined using a capillary tube viscometer.
CHAPTER II
Effect of water state on thermal properties of starches
11-1
IntroductionHeating starch in the presence of excess water produces gelatinization.
Simultaneously, a number of physical and chemical changes occurred, such as granule swelling, an increase in suspension viscosity, a change in transmittance and a loss of birefringence. Several measurements for gelatinization of starches, e.g. measuring the transmittance using a photopastegraph (Kainuma et al.,
1968)
and the birefringence us1ng a polarizing microscope (Schoch &Maywald,
1956)
have been developed by following these phenomena.Differential scanning calorimetry (DSC) is one of these measurements which detects heat flow changes during starch gelatinization as phase transition phenomena. The first use of DSC for measuring the heat of gelatinization was by Stevens and Elton
(1971).
This method can be used for measuring starch gelatinization with a low moisture content and a high temperature range. Also, it requires only a small sample and is easy to measure. With these merits, many researchers have used DSC for the observation of starch gelatinization (Donovan,1979;
Biliaderis et al.,1980, 1986;
Ghiasi et al.,1982;
Krueger etal.,
1987;
Hari et al.,1989;
Wang et al.,1991;
Qu & Wang,1994).
Donovan
(1979)
reported that two peaks were observed in DSC curve of potato starch at low moisture contents. The phase transition peaks of the lowertemperature range can be considered starch gelatinization, and that of the higher temperature range can be considered the melting of starch crystallites.
At a lower moisture content, e. g. fewer than four water molecules per anhydrous glucose unit, the peak of gelatinization disappeared, and only that of the melting appeared. Biliaderis et al.
(1980, 1986),
Wang et al.(1991)
and Qu& Wang
(1994)
also reported the phase transition peak of melting of starchcrystallites was appeared with low moisturized starches.
It is well known that there are roughly two states of water in polymeric materials. One is free water, the other is bound water (Ross,
197 8;
Nakamuraet al.,
1981;
Noguchi,1992).
The bound water is often measured by DSC ordifferential thermal analysis (DT A) as the unfreezable water is unable to freeze well below
0
OC (Duckworth,1971;
Muffet & Snyder,1980).
Thegelatinization and melting can be affected by the water states of starch under the conditions of low moisture contents in which unfreezable water can be dominant. There is, however, little research discussing the effect of water states for the thermal phase transitions of starches. Therefore in this chapter, relationships between water states and phase transitions of starches at low moisture contents are investigated by use of DSC.
11-2 Materials and Methods
11-2-1 Starches
Potato, corn and wheat starches were purchased from NACALAI TESQUE Inc. (Tokyo, Japan; potato, Lot No. M1E-5704; corn, M1H-9367; wheat, M9R- 4368) and sweet potato starch was also purchased from W AKO PURE CHEMICAL INDUSTRIES Ltd. (Osaka, Japan; Lot No. DSG1269). So the
initial moisture contents of the starches were about 0.20 g-H20/g-solid. The starches were pre-dried at 70 OC for 48 hours in order to adjust the moisture content easily. After drying at 105 OC for 10 hour, the moisture content was defined as zero.
II-2-2 DSC measurement
The dried starch was weighed on a silver pan with distilled water to moisturize 0.25 to 2.50 g-H20/g-solid. About 5 mg starch by dry weight was used for the measurement of freezable and unfreezable water. About 2.5 mg starch by dry weight was used for the measurement of gelatinization and melting endotherms. The pans were hermetically sealed and allowed to stand overnight in a refrigerator at 4 °C. Before scanning the thermal phase
transitions, the pans were centrifuged for 10 min at 1,000xG to efficiently conduct heat to their bases.
DSC measurements were performed with a DSC 100 equipped with a SSC 5000 Thermal Analysis Station (SEIKO Instruments Inc., Tokyo, Japan).
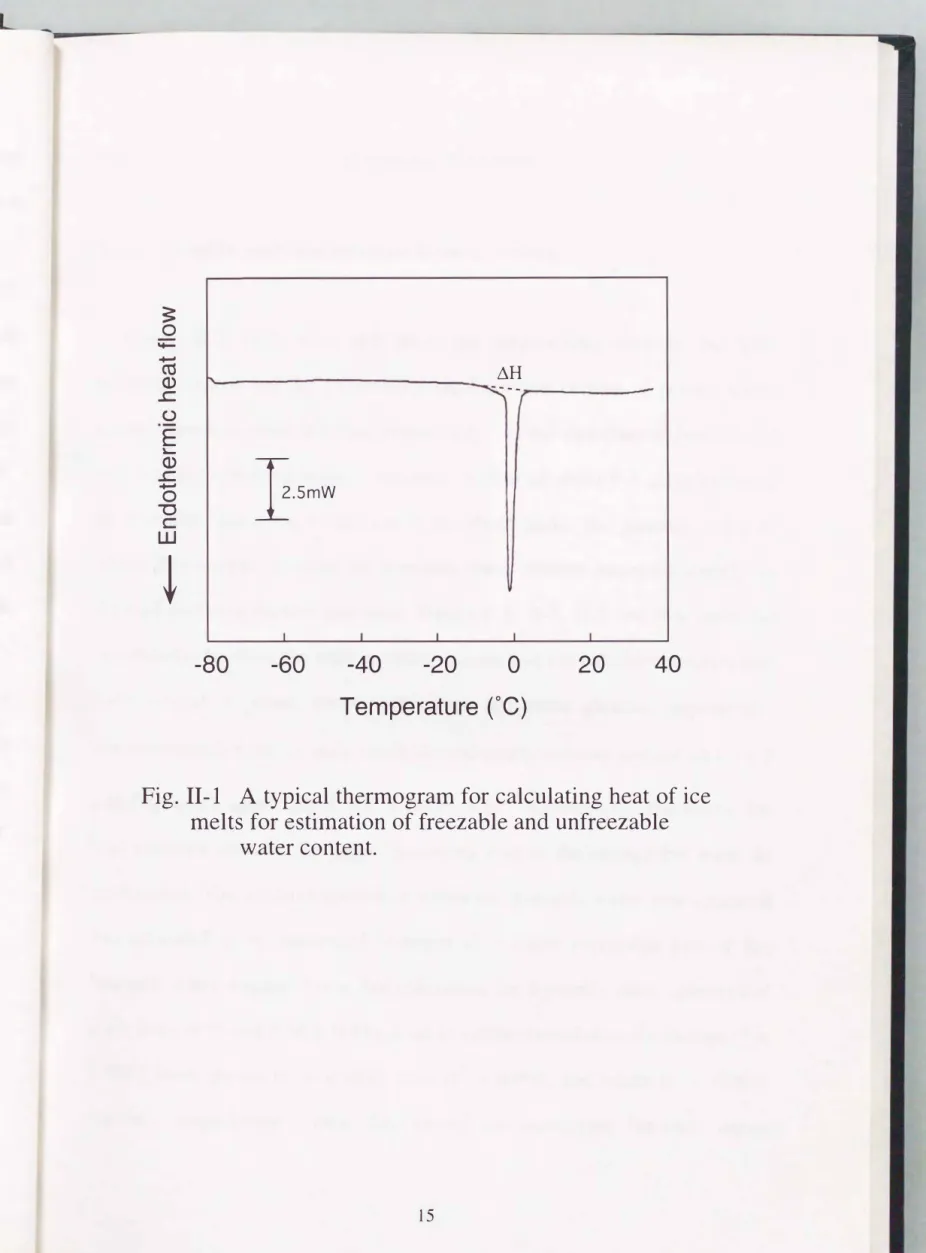
Before the measurement of freezable water was taken, the sealed pans were cooled below -80 OC with liquid nitrogen in the DSC heat sink. The sealed empty pan was used as a reference. Then the pans were heated to 20 OC at 1.5 OC/min. From the DSC curves, the area of the endothermic peak corresponding to the enthalpy of ice melts. The quantities of freezable water were calculated by dividing the enthalpy by 333.05 mJ/mg (the enthalpy for ice melts), as shown in Fig. II -1.
For the measurements of gelatinization and melting endotherms, the sealed pans were prepared in the same way for the measurements of freezable water contents. Then the pans were heated at 10 OC/min, which rate was defined as the noise can be neglect in measuring, at a scan range from 20 OC to 200 °C.
The same quantity of water in the sample pan was used as a reference.
3:
0�
� ctS �H
Q) ' ---- -
..c (.)
E
�Q)
r.SmW
..c � 0
"0 c w
�
I I I I I
-80 -60 -40 -20 0 20 40
Temperature (OC)
Fig.
II -1 Atypical thermogram for calculating heat of ice melts for estimation of freezable and unfreezable
water content.
II-3 Results and Discussion
II-3-1 Freezable water and unfreezable water content
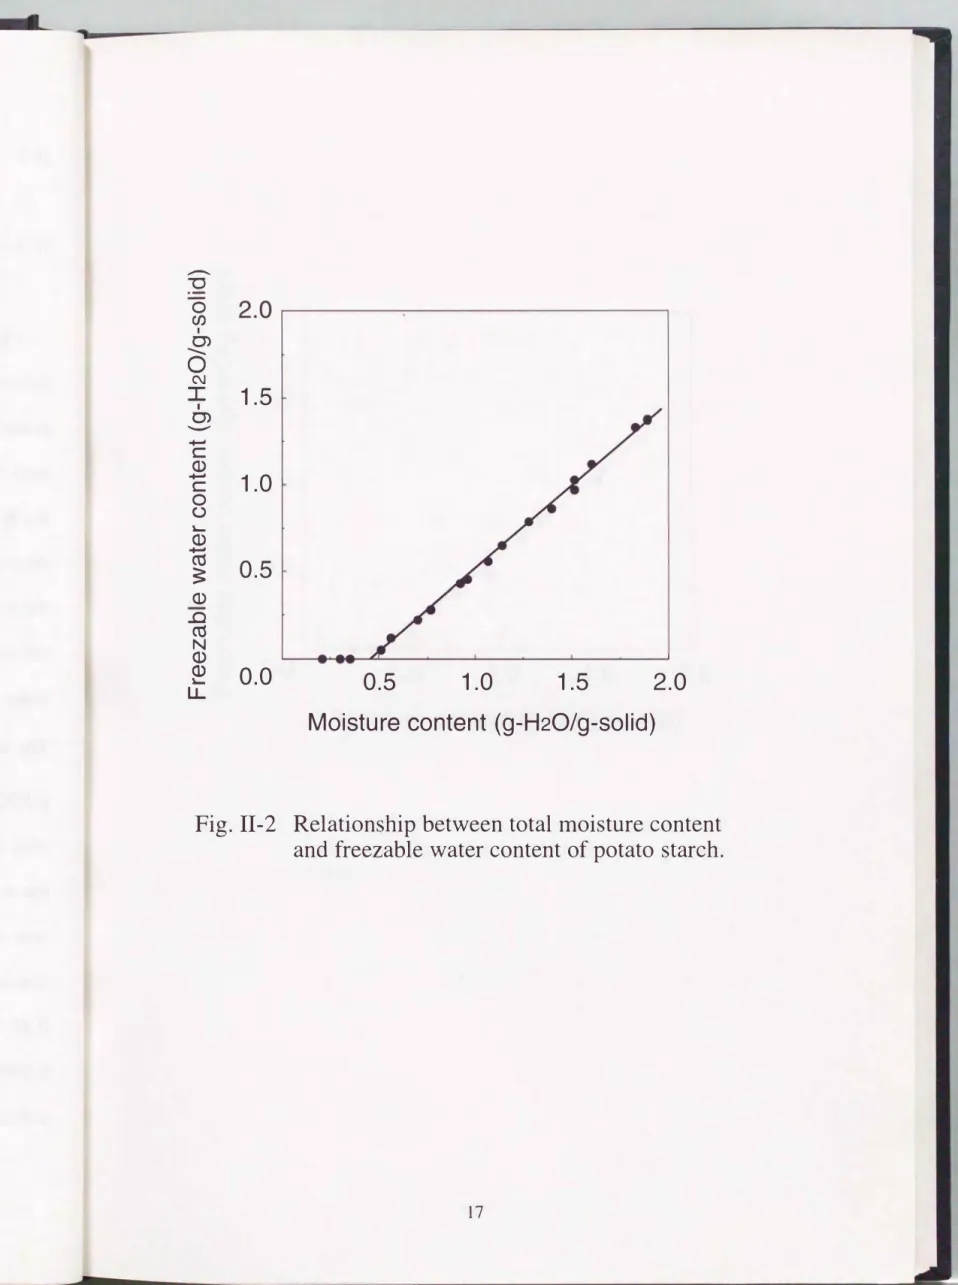
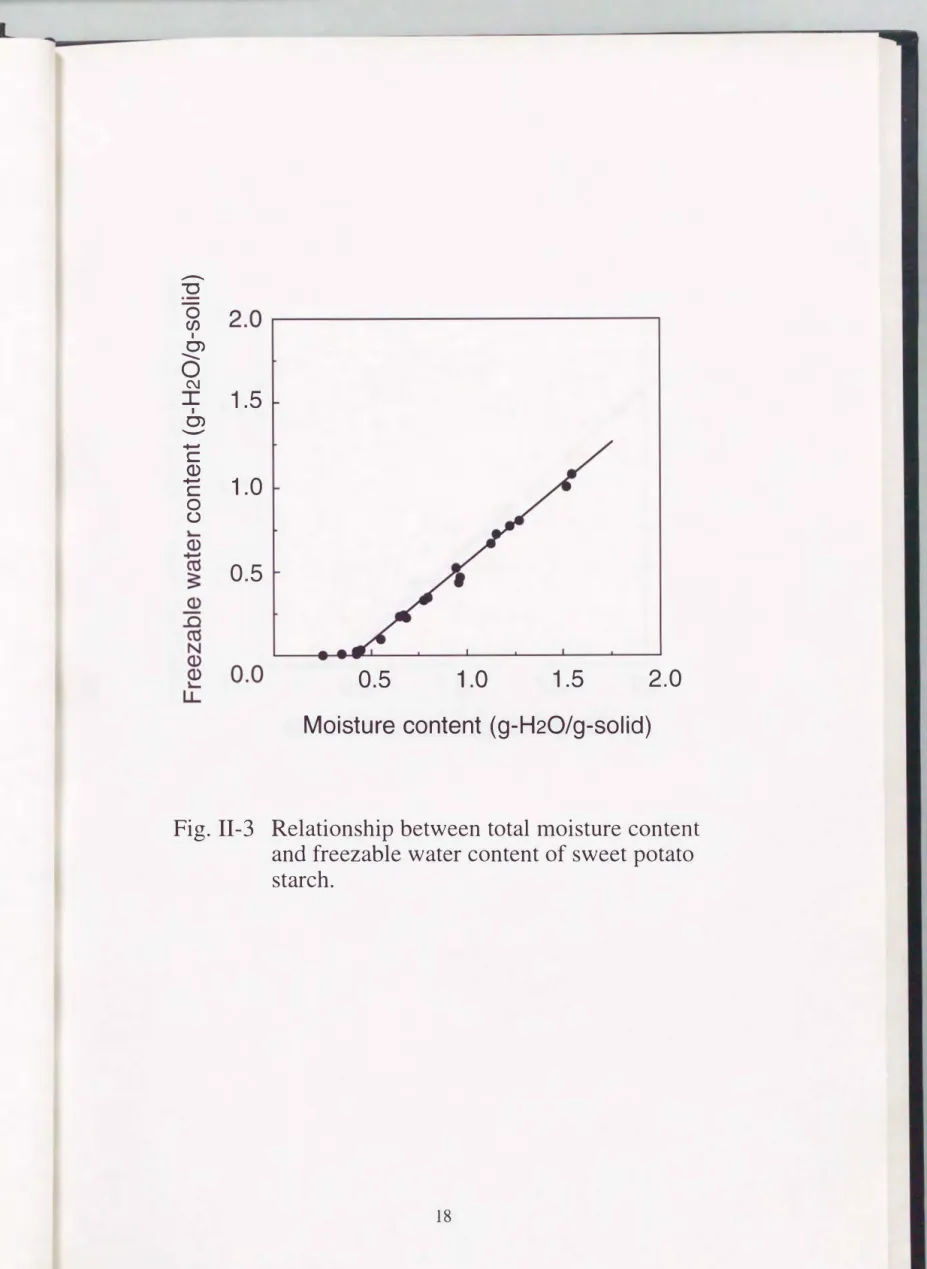
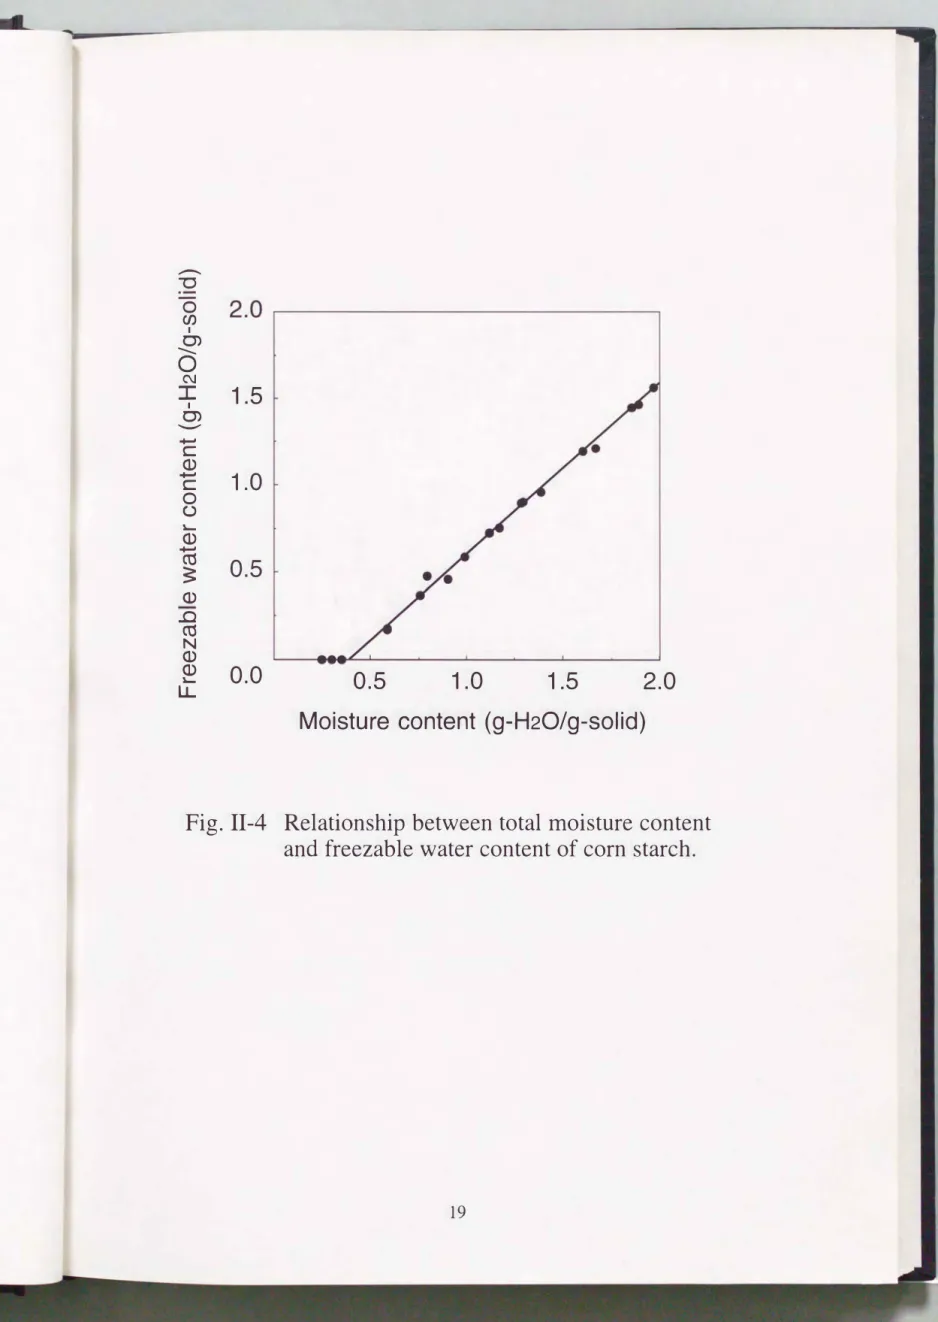
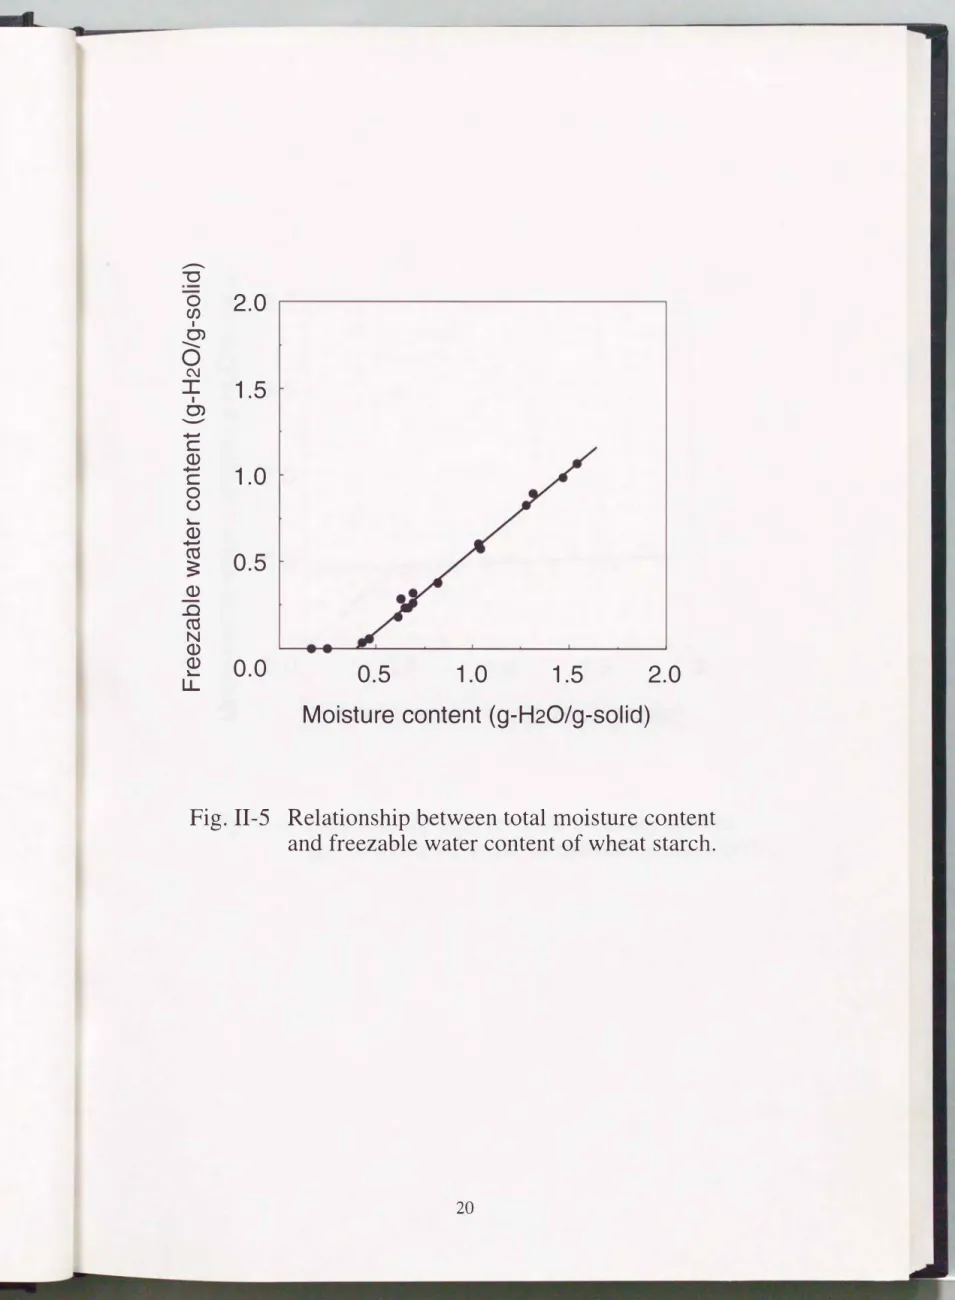
Figure II-2, II-3, II-4, II-5 show the relationships between the total moisture content and the calculated freezable water content of potato, sweet potato, corn and wheat starches, respectively. As the endothermic peak of ice melt was not observed under a moisture content of about 0.4 g-H20/g-solid, the freezable water could not exist in the starch under this moisture content.
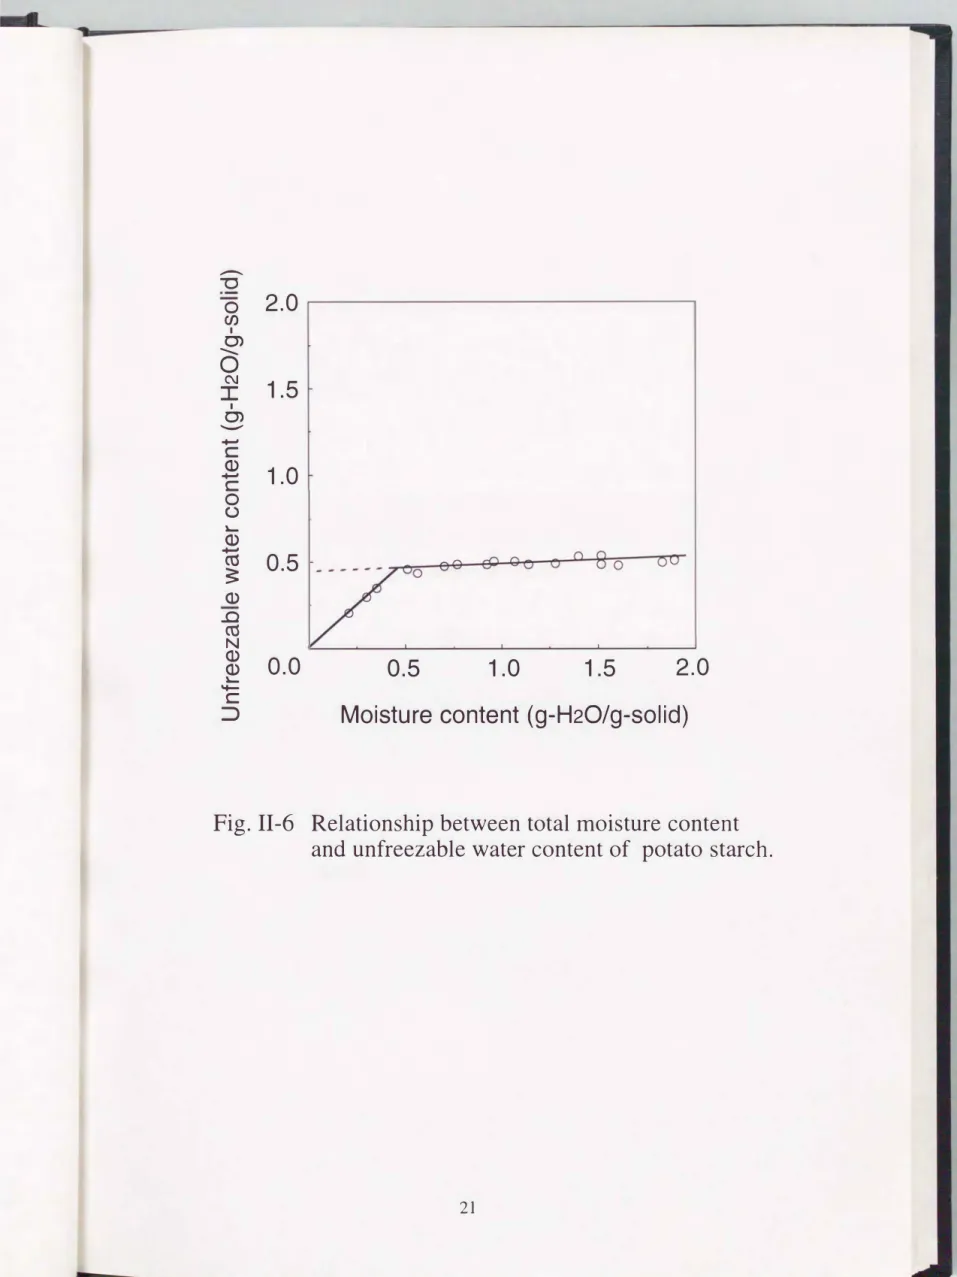
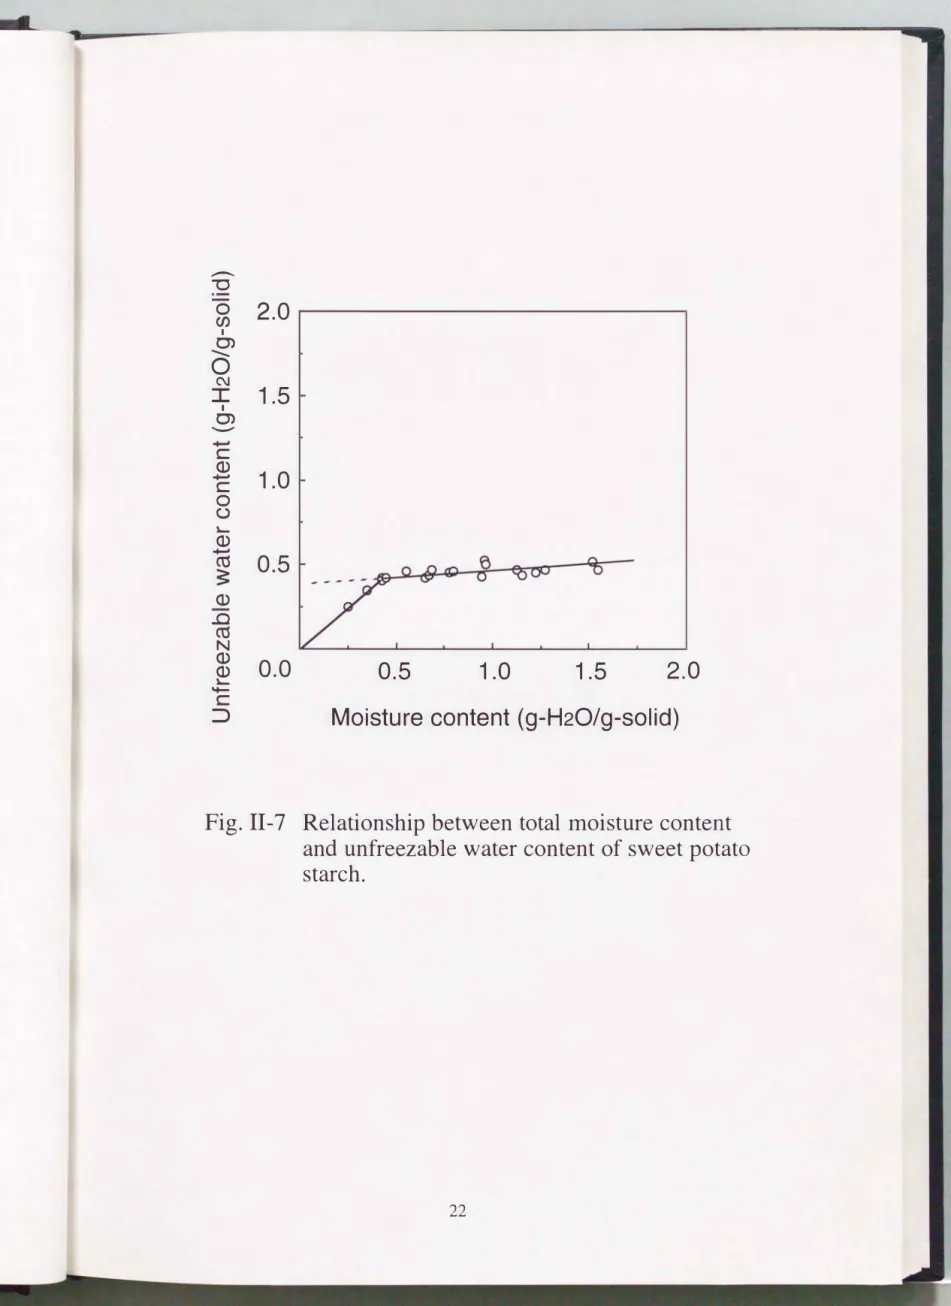
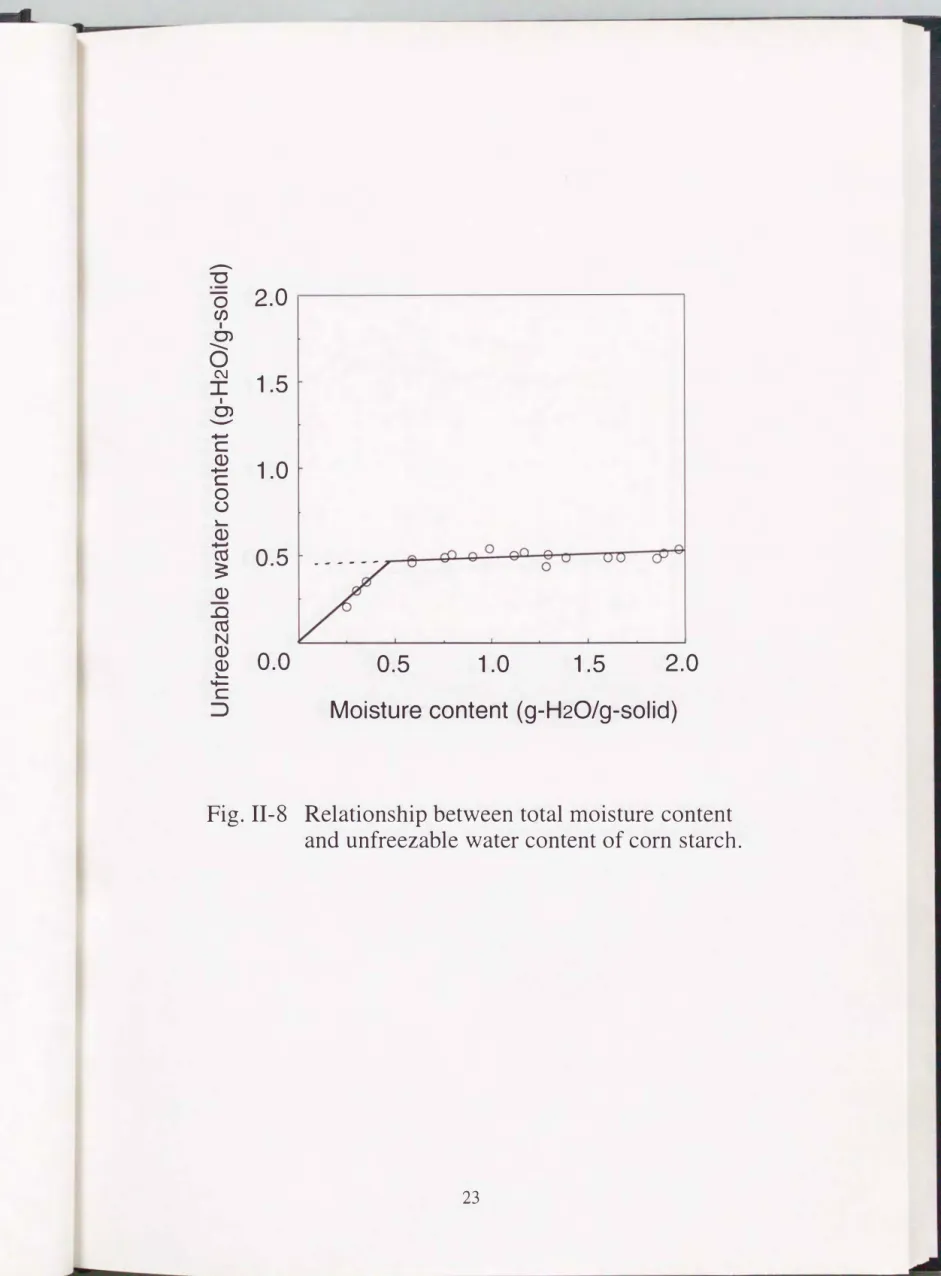
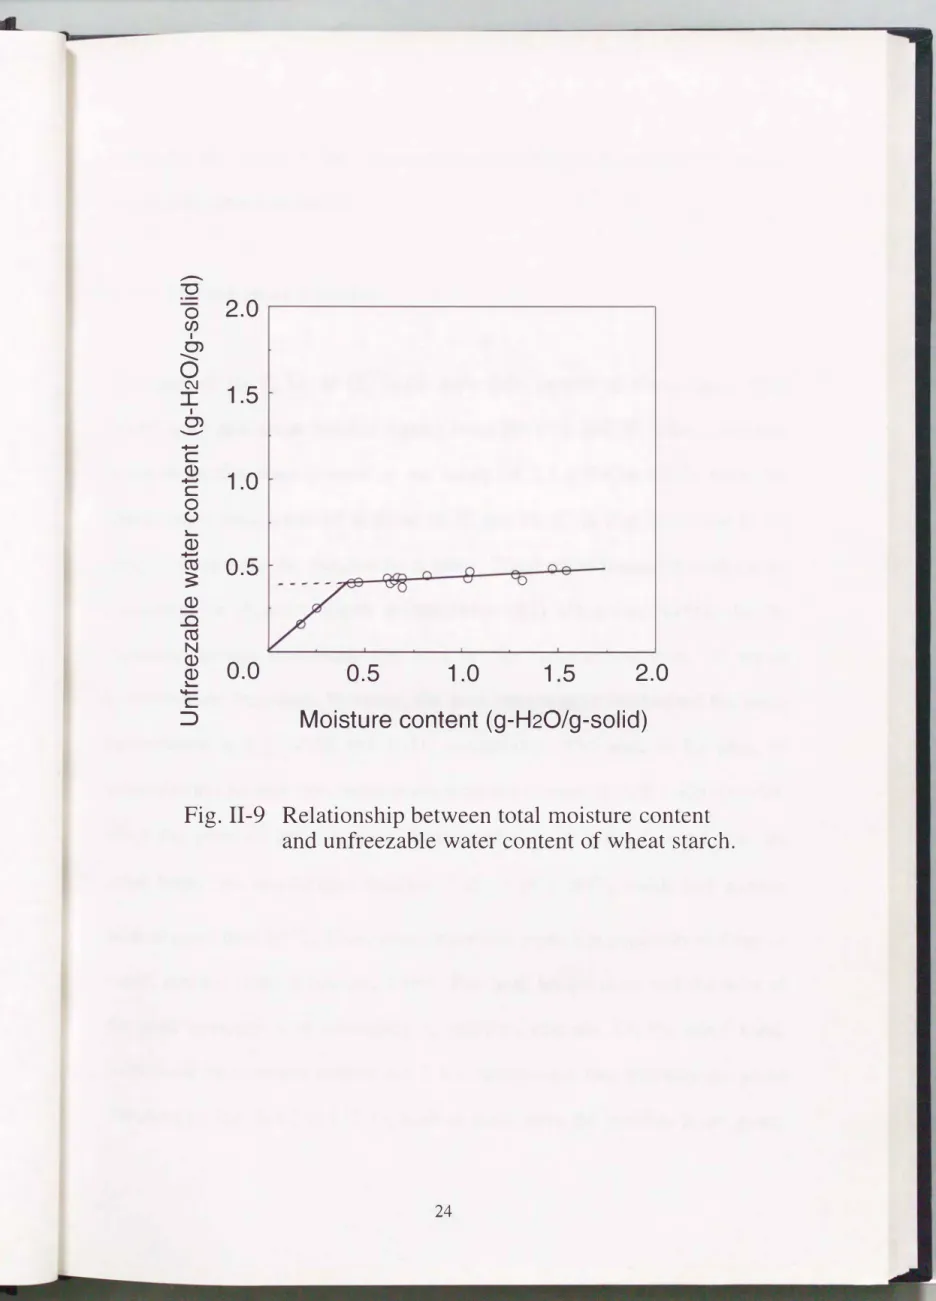
Above this moisture content the freezable water content increased linearly as the total moisture content increased. Figure II-6, II-7, II-8 and II-9 show the relationships between the total moisture content and the calculated unfreezable water content of potato, sweet potato, corn and wheat starches, respectively.
The unfreezable water in each starch showed nearly constant content (0.4"'-'0.5
g-H20/g-solid) above about 0.4 g-H20/g-solid. Accordingly, the lower the total moisture content, the higher possessing rate of the unfreezable water in the starches. The moisture content at which the freezable water first appeared was estimated as an horizontal intercept of a linear regression line of the freezable water content. From this estimation, the freezable water appeared at 0.47, 0.43, 0.39 and 0.39 g-H20/g-solid in potato (correlation coefficient, r2 = 0.998), sweet potato (r2 = 0.993), corn (r2 = 0.996) and wheat (r2 = 0.994) starches, respectively. From this result, an interaction between starch
...-.
"0 0 CJ) C) I ...
0
C\JI I
C)
._..
+'"""
c Q)
+'"""
c 0 (.)
� Q)
+'"""
ctS
�
Q) ..c ctS N Q)
1.5
1.0
0.5
� 0.0
LL
0.5 1.0 1.5 2.0
Moisture content (g-H20/g-solid)
Fig. II-2 Relationship between total moisture content
and freezable water content of potato starch.
..-....
"'0 0 (/) 0> I
--
0
I C\J
0> I
.._..
+""'
c Q)
+""'
c 0 (.)
1.5
1.0
0.5
0.5 1.0 1.5 2.0
Moisture content (g-H20/g-solid)
Fig. 11-3 Relationship between total moisture content
and freezable water content of sweet potato
starch.
--. "'C
0 CJ) 0) I ..._
0
C\.1I I ._. 0)
+-' c
+-' Q) c 0 ()
� +-' Q) Oj
;:
Q) ..c Oj Q) N
1.5
1.0
0.5
� 0.0
LL
0.5 1.0 1.5 2.0
Moisture content (g-H20/g-solid)
Fig. II-4 Relationship between total moisture content
and freezable water content of corn starch.
..-.
"'C
0
2.0
(/) I
..._ C)
0
NI I
1.5
.._.. C) ....-
c Q) ....-
1.0
c 0 (.)
�
....-Q)
ro
0.5
�
Q) ..c ro N Q)
Q)
0.0 0.5 1.0 1.5 2.0
�
LL
Moisture content (g-H20/g-solid)
Fig. 11-5 Relationship between total moisture content
and freezable water content of wheat starch.
...-.
"0
0
2.0
en I
..._ C)
0
C\JI
1.5
C) I ._.
..., c Q)
1.0
..., c 0 (.) "-- ..., Q)
ctS
0.5
�
Q) ..c ctS Q) N
0.0 0.5 1.0 1.5 2.0
Q) "--
� c
::J
Moisture content (g-H20/g-solid)
Fig. II-6 Relationship between total moisture content
and unfreezable water content of potato starch.
.-. -c
0
2.0
(j) I ..._ C)
0
C\JI I
1.5
...._... C)
� c
Q)
1.0
� c 0 (..)
� Q)
� cu
0.5 3:
Q) .c cu Q) N
0.0 0.5 1.0 1.5 2.0
Q) � ...
:::) c
Moisture content (g-H20/g-solid)
Fig.
II-7 Relationship between total moisture content
and unfreezable water content of sweet potato
starch.
...-..
"'C
0
2.0
en C) I
..._
0
C\JI
1.5
C) I ..._,
..-c Q)
c 1.0
0 (.)
� ..-Q)
� 0.5
� - - - - -Q) ..c co N Q)
Q)
0.0
�
'+-c ::::>
0.5 1.0 1.5 2.0
Moisture content (g-H20/g-solid)
Fig. II-8 Relationship between total moisture content
and unfreezable water content of corn starch.
..-.
"'C
0
2.0
en I
..._ C)
0
C\JI
1.5
C) I ._..
...-c Cl.) ...-
1.0
c 0 ()
�
Cl.)
...-ctS
0.5 3:
Cl.) ..c ctS N Cl.)
0.0 0.5 1.0 1.5 2.0
Cl.)
� '+-
c
::::>
Moisture content (g-H20/g-solid)
Fig. II-9 Relationship between total moisture content
and unfreezable water content of wheat starch.
molecules and water at low moisture content could be stronger in the potato starch than other starches.
II-3-2 Thermal phase transition
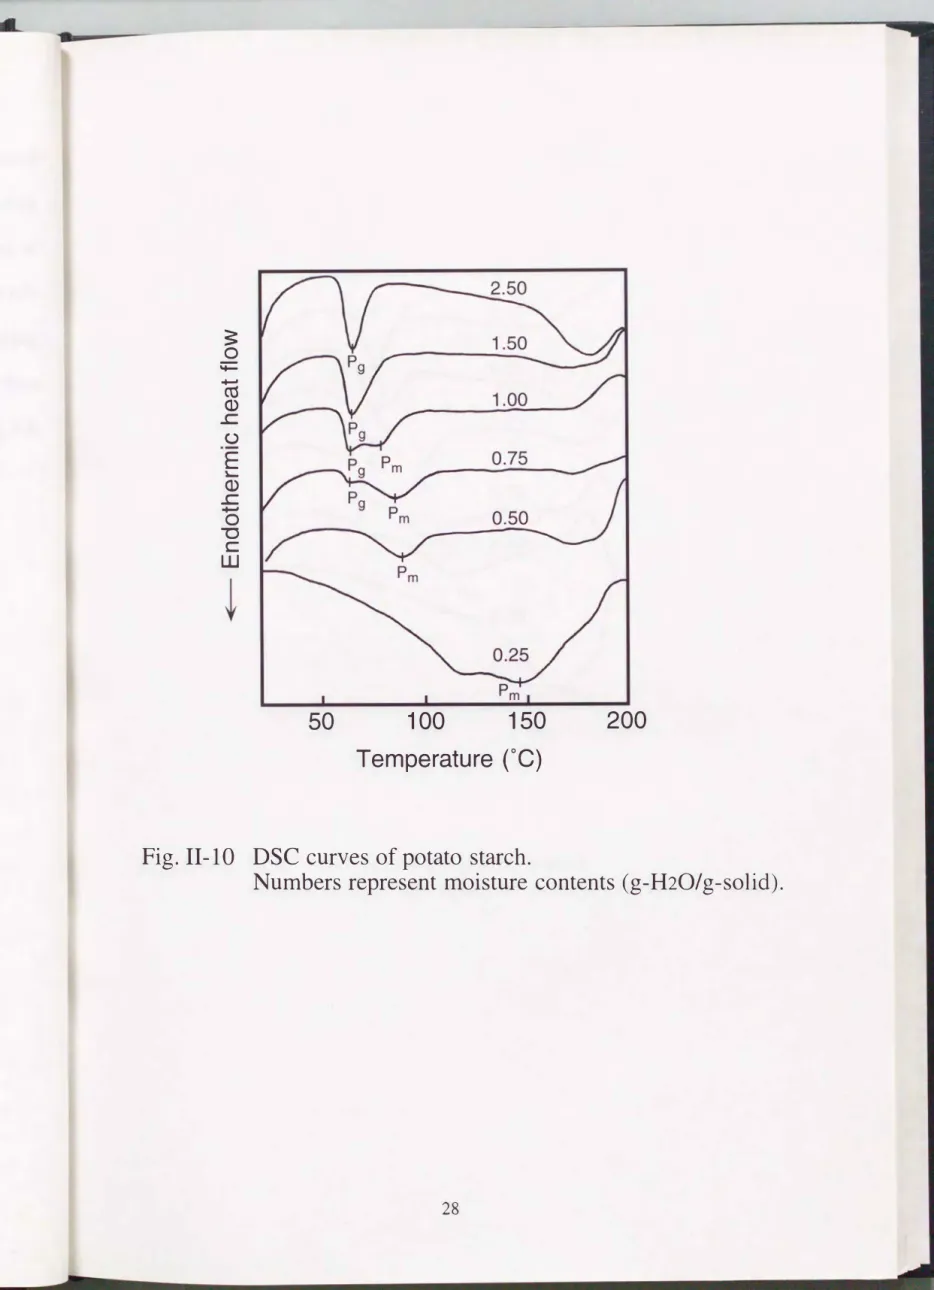
Figure II- 10, II- 1 1, II- 12, II- 13 show DSC curves of the potato, sweet potato, corn and wheat starches heating from 20 OC to 200 °C. When sufficient water molecules were present in the starch (at 2.5 g-I-120/g-solid), only one endothermic peak appeared at about 62 OC and 78 OC in Fig. II- 10 and II-11, both of them were the starches from tuber. These phase transition peaks were considered as those of starch gelatinization (Pg) (Donovan, 1979). As the moisture content decreased, the area of the endothermic peak of starch gelatinization decreased. However, the peak temperature maintained the same temperature in Fig. II- 10 and II- 1 1, respectively. The area of the peak of gelatinization became very small at the moisture content of 0.50 g-I-120/g-solid.
Then the peak of gelatinization disappeared at 0.25 g-I-120/g-solid. On the other hand, low moisturized starches (0.25'"'-' 1.50 g-I-120/g-solid) had another
peak at more than 80 °C. These phase transition peaks were considered those of
starch melting (Pm) (Donovan, 1979). The peak temperature and the area of
the peak increased with decreasing in moisture contents. On the other hand,
when even the moisture content was 2.5 g-I-120/g-solid, two endothermic peaks
appeared in Fig. II- 12 and II- 13, both of them were the starches from grain.
On the peaks at lower temperature, the peak temperature maintained same temperature in Fig. 11-12 and
11
-13, 72 OC and 62 OC, respectively, and the area of the peak was decreased and disappeared as the moisture content decreased. So the phase transition peaks at lower temperature were considered as those of starch gelatinization (Pg). These phase transition peaks at higher temperature were considered those of starch melting (Pm). The peak temperature and the area of the peak increased with decreasing in moisture
contents.
Collison and Chilton (1974) reported that potato starch containing up to 30
%water (0.43 g-H20/g-solid) was not gelatinized by heating. Also in this research, as the gelatinization peak disappeared between 0.25 and 0.50 g
H20/g-solid, the gelatinization did not occur in these starches under this low moisture content. This moisture content corresponded to that at which freezable water first appeared in these starches from the results of relationships between total moisture content and freezable water content. These results suggested that the gelatinization of the starches requires freezable water.
The gelatinizing process is generally performed with
:1) disruption of
hydrogen bonds between starch molecules by water molecules increased in free
motion at high temperature, 2) increase in hydration of starch chains, 3)
penetration of more water molecules into the network of starch chains and 4)
swelling of starch granules (Hizukuri, 1977). Thus many water molecules are
necessary in order to gelatinize starches. Unfreezable water can be defined as
bound water which is firmly bound to starch chains by hydrogen bonds or hydrophobic interaction and so on (Noguchi, 1992). If only unfreezable water is present in the starch, hydrogen bonds between starch chains are hardly disrupted, and hydration of starch chains do not increase. Therefore, gelatinization did not occur in the low moisturized starch in which only unfreezable water existed. In other words, the low moisturized starches below 0.4 g-H20/g-solid could melt by heated treatment and could not gelatinize.
3:
;:;:: 0 +-' co ..c Q) (.)
E
,_
..c Q)
+-' 0
-o c w
50 100 150
Temperature (OC)
Fig. II
-10 DSC
curves of potato starch.200
Numbers represent moisture contents (g-H20/g-solid).
0
�
� ..., ro (l) ..c ()
E
�(l) ..c ..., 0
"'0 c w
50 100 150
Temperature (OC)
Fig.
II -11DSC curves of sweet potato starch.
200
Numbers represent moisture contents (g-H20/g-solid).
50 100 150
Temperature (OC)
Fig.
II-12 DSC
curves of corn starch.200
Numbers represent moisture contents (g-H20/g-solid).
�
0 '+=+-' ell Q)
..c
()
E
� Q)
..c +-'
0
"'C c w
100 150
Temperature (OC)
Fig.
II -13 DSC
curves of wheat starch.200
Numbers represent moisture contents (g-H20/g-solid).
II-4 Summary
The moisture content at which the freezable water first appeared was 0.47, 0.43, 0.39 and 0.39 g-H20/g-solid measuring by DSC in potato, sweet potato,
corn and wheat starches, respectively. The freezable water content increased linearly above these moisture content. While the unfreezable water content maintained constant above these moisture content. When sufficient water molecules were present in the starch
(2.5
g-H20/g-solid), only one phase transition peak which can be considered starch gelatinization was observed in each potato and sweet potato starch. Under the moisture content of1.5
gH20/g-solid, another phase transition peak which can be considered melting of starch crystallites appeared in each potato and sweet potato starch. On the other hand, two phase transition peaks were observed in each corn and wheat starch at
2.5
g-H20/g-solid. In this case the peak of lower temperature was considered as that of gelatinization, and that of higher temperature was considered as that of melting starch crystallites. As the moisture content decreased, the area of gelatinization peak decreased, but the peak temperature remained constant. The gelatinization peak disappeared between 0.25 and 0.50 g-H20/g-solid. The peak temperature of melting of starch crystallites increased with the decrease in the moisture content. The range of the moisture content at which the gelatinization peak disappeared corresponded to that at which the freezable water appeared in all starches. It is concluded that the gelatinizationof the starches requires freezable water. Namely the starches with low moisture content, which don't include free water, can not gelatinize but melt.
III-1
CHAPTER III
Effect of moisture content and applied pressure on flow-starting temperature of starch melts
Introduction
Extrusion cooking is widely used to manufacture foods and feeds from cereal, tuber or other protein/carbohydrate/water mixtures, which are known generally as food polymers. Extrusion cooking is usually carried out under the conditions of high temperatures and high pressures. Under these conditions low moisturized food polymers can be fused. Indeed, starch crystallites melted at high temperature under the moisture contents of 0.4 g-H20/g-solid, while gelatinization of starch was not occurred, as described in Chapter II.
Considering that extrusion cooking also uses low moisturized starches at high temperatures, starches in the extruder barrel were not gelatinized, but melted.
In Chapter II the effects of water only for the starch melts were investigated.
However, the starch melts could be also affected by an applied pressure. Some information about the thermo-mechanical properties include flow-starting temperature, which is measured when the specimens start to extrude through a capillary tube by raising temperature at applying some pressure with a flow tester. The flow-starting temperature is useful for not only the understanding
the melting process of food polymers, but also the determination of conditions
to measure the flow properties of food polymer melts.
The objects of this chapter were to clarify the effects of the moisture content of various starches and the applied pressure on the flow-starting temperature using a capillary tube viscometer, and to attempt a modeling of the flow-starting temperature.
III-2 Materials and Methods
III-2-1 Starches
Potato, sweet potato, corn and wheat starches used in this study were the same as described in Chapter II-2-1.
Some methods were supposed for adjusting the starches to desired moisture contents. The first method is mixing the starches with water directly. This method is easy but there is possibility of localization of water so the dried starches have high moisture absorption capacity. The second method is equilibrating the starches with water in a desiccator. A homogeneous moisturized starch is obtained by this method, but it is difficult to obtain desired moisture content. The third method, finally using this method, is blending the starches with fine ice powder in very cold environment. This method prevent the moisturized starches from localization of water and is easy to obtain desired moisture content.
After those starches were dried at 70 OC for 48 hour, the moisture content of the dried starches was adjusted to 0.16, 0.20, 0.25, 0.30 g-H20/g-solid by blending with desired amount of fine ice powder (ca. 20 mesh pass; at -20 OC) in a cold room at -20 °C. After drying at 105 OC for 10 hour, the moisture content was defined as zero. The moisture-adjusted starches were stored in a cold room at 4 ° C until use.
III-2-2 Flow-starting temperature
A cross-sectional v1ew of a capillary tube viscometer developed by my
laboratory (Shinmeiwa Co. Tokyo, Japan) was shown in Fig.
111-1.
Flowstarting temperature was measured using the capillary tube viscometer, which detail has been described in Hayashi et al.
(1990)
and Fujio et al.(1991).
Thecapillary tube used was
0.75
mm in radius and20
mm in length. A2.0
g of the moisturized starch was moulded into a cylindrical shape( 1. 08
em in diameter and about1.5
em in length) using a hand press (SHIMADZU Co., Kyoto, Japan) and placed in the sample reservoir. Under the condition of vertical load(10, 30, 50, 70
and90
MPa), the starches were heated at 2 OC/min from20
OCto
200
°C. The flow-starting temperature was defined as the temperature at when the starches melted and started to be extruded through the capillary tube.The flow-starting temperature, Ts CC) was defined as the temperature at an inter section of a base line of transducer and a tangent line of constant rate flow, as shown in Fig. 111-2.
Capillary tube die
+--- Plunger
Heater
Fig. III -1 Cross-sectional view of a capillary tube viscometer.
200
..-....-..
/
#/
Ts / 0.5
150 /
--- ----
/I �
��
E
()
/ l__
0.0
(.)0 ._..
._.. \
/
...Q) c
,_
100 /
Q)::::J
/
...
/ -0.5 E
co ,_
/
Q)Q)
/
(.)c..
/
coE 50 / / -1.0
c.. CJ)Q)
/
r-
/
0/
-1.5
or 20 40 60 80
Time (min)
Fig.
III-2 Atypical chart for evaluation of flow-starting
temperature (Ts)
III-3
Results and DiscussionIII-3-1
Effect of pressure on flow-starting temperatureFigure
III-3 (A,
B,C
and D) shows the relationship between flow-starting temperature and applied pressure at various moisture contents(0.16, 0.20,
0.25 and
0.30
g-H20/g-solid, respectively). The flow-starting temperatureincreased in inverse proportion to the applied pressure, although there was no significant difference between the starch varieties. By extrapolating the flow
starting temperature toward low pressure, the flow-starting temperatures of various moisture content of starches converged into a point. Polymers are generally easy to flow when a plasticizer is present. It is known that water plays a role of a plasticizer in low moisturized starches. However the role of water as a plasticizer became negligible at very high temperature because fast Brownian movement of starches was occurred. Then it can be considered that the flow-starting temperature was converged into a point irrespective of moisture contents. The flow-starting temperature decreased linearly from the converged point corresponding to logarithmic increase of the vertical pressure.
Thus the flow-starting temperature, Ts
CC)
was proposed that,Ts = T
c
- k log(PI Pc) (1)
where Pc and Tc are the pressure (MPa) and the temperature CC) where the Ts are converged into, k is coefficient (dimensionless) which is a function of moisture content and Pis the applied pressure (MPa).
III-3-2 Effect of moisture content on flow-starting temperature
Figure III-4 (A, B, C, D and E) shows the relationship between flow
starting temperature and moisture content at various applied pressures (10, 30, 50, 70 and 90 MPa, respectively). There was no significant difference between the origins of the starches. The starches started to flow at low temperature (55- 75 OC) by applying higher pressure (70 and 90 MPa) at higher moisture content (0.25 and 0.30 g-H20/g-solid). Collison and Chilton (1974) concluded that potato starch containing up to 30% water suffered no measurable damage (gelatinization) by microwave heating. On the basis of this research gelatinization could not occur at the range of the moisture contents in the present study. Some reasons why the starches had fluidity without gelatinization were considered as; shifting to fluid phase via a region of rubbery state after the glass transition temperature which can be decreased by
applying stress and increased moisture content (Lim, 1989); gelatinization occurring with localized water, then performing as a plasticizer; flowing like concentrated slurry. However it is impossible to clarify the mechanism of flow under such conditions from these results alone.
Ts decreased linearly with an increase in the moisture contents within the moisture range studied. Therefore, the coefficient k in Eq. (1) can be expressed as follows,
k =a+bW (2)
where a and b are coefficients (dimensionless) and W is moisture content (g
H20/g-solid).
Thus the experimental equation of Ts was obtained by substituting Eq. (2) into Eq. (1):
Ts = Tc- (a+ b W) log (PI Pc) (3)
The coefficients a and b were 36.8 and 1.68xl02, and the converged pressure (Pc) and temperature (Tc) were 0.32 (MPa) and 2
70
.9CC), respectively, as calculated from experimental data.
Figure
III-5shows all data of the flow-starting temperature and the lines of
Eq. (3) calculated by substituting above coefficients.
Agood agreement
between experimental data and calculated lines was obtained.
-+::-.
(j.,)
10 3
...-.
CL Qj
�
102..._..
Q) '-
::J CJ) CJ)
�
101 CLA 8
f-
�
lJII
�
f- to
'
c D
� ,. t,
'#IS> 'i �
., � Wlft
1.1 %
�
If>I I I I I I I I I I I I
10 0
0 50 100 150 200 50 100 150 200 50 100 150 200 50 100 150 200
Temperature (OC)
Fig. III-3 Relationships between flow-starting temperature and applied pressure at various moisture contents (A, 0.16; B, 0.20; C, 0.25; D, 0.30 g-H20/g-solid).
0,
Potato;•,
sweet potato;6.,
com; T, wheat.� �
40
A 8 c D E
....-...
� 0
._...
+-' 30
c f- m m m m u
+-' Q)
c SJ S} ., ., K)
0
() 20 r- u 1D 1D 1D 1D
Q) � I[) - - .. ..
::::J +-' en
0 10
�
0 1 1 l__ I I I I I I
50 1 00 150 50 1 00 150 50 1 00 150 50 1 00 150 50 100 150
Temperature (OC)
Fig. 111-4 Relationships between flow-starting temperature and moisture content at various applied pressures (A, 10; B, 30; C, 50; D, 70; E, 90 MPa).
0,
Potato;•,
sweet potato;6.,
corn;T,
wheat.I
103
�---�0.30 0.25 0.20 0.16
10°
��--�--�--��--�--��0 50 1 00 1 50 200
Temperature (OC)
Fig. III
-5
Application of lines calculated from equation(3)
toexperimental data of flow-starting temperature.
Numbers represent moisture contents (g-H20/g-solid).
0,
Potato;•,
sweet potato;6.,
corn;T,
wheat.III-4 Summary
Flow-starting temperature
(Ts)
of low moisturized starches (potato, sweet potato, corn and wheat starch) were measured using a capillary tube viscometer under varying moisture content(W)
and applied pressure(P).
Ts was increased with decreasing moisture content and applied pressure. There was no significant difference onTs
among starch varieties. Ts converged into a temperature (Tc; 270.9OC)
at a pressure (Pc; 0.32 MPa). Because Ts was in inverse proportion to the moisture content and logarithm of the applied pressure,Ts
was expressed as,Ts
=T
c- (a+
bW)
log (PI Pc)where coefficients,
a
and b were 36.8 and 1.68xl02• The lines calculated from the equation were in a good agreement with experimental data.IV-1
CHAPTER IV
Flow properties of low moisturized starch melts at an elevated temperature
Introduction
The low moisturized starches melt and flow at the condition of high temperatures and high pressures, as described in Chapter III. To clarify the flow properties of such food polymer will be available for the establishment of optimal operational condition or the development of a plant. Then many investigations of flow properties of food polymer dispersions, slurries and pastes have been per formed using a rotational viscometer (Ur banski et al., 1983;
Sandhya Rani & Bhattachar ya, 1989; Dolan & Steffe, 1990; Okechukwu et al., 1991) or a capillary tube viscometer (Dail & Steffe, 1990; Sharma et al., 1993a,
b).
However these viscometers can not use at a condition of extr emely high temperature, like in an extr uder barrel, because evaporation of water, which is important factor for the flow properties, can be occurred at such condition. Thus the flow properties of food polymer melts have been studied using an extruder to help for engineering design and scale up (Remsen & Clark, 1978; Cervone &Harper, 1978; Chen et al., 1978; Jao et al., 1978; Morgan et al., 1989; Dolan et
al., 1989; Mackey & Ofoli, 1990a, b). Although these investigations provided
important information about extrusion cooking, further fundamental studies on the properties of food polymer melts were considered necessar y in order to obtain basic information about thermo-mechanical properties. Fujio et al. ( 1991) and Hayashi et al.
( 1991, 1993)
studied the flow properties of soy protein isolate melt at a high temperature(140 OC)
using a capillary tube viscometer, which can use at high temperature by equipping especial seal.In this chapter I try to elucidate the flow properties of low moisturized potato and corn starch melts using the capillary tube viscometer and to fit the flow properties to a power-law model by regression analysis.
IV-2 Materials and Methods
IV -2-1 Starches
Potato and corn starches used in this study were the same as described in Chapter II-2-1. The moisture content of these starches were adjusted to 0.16, 0.20, 0.25, 0.30 and 0.35 g-H20/g-solid by same method as Chapter III-2-1.
IV-2-2 Entrance effect correction
The flow property us1ng a capillary tube viscometer is represented by measured flow rates and measured pressure drops. The measured pressure drops include not only that at the capillary tube wall but also that at the reservoir wall, that at an entrance and an exit of the capillary tube and that of a friction between the reser voir and the plunger. It is necessary for analyzing the further flow properties that the these pressure drops are corrected, except that at capillary tube wall. Bagley's end correction method (Bagley, 1957) is usually used for this correction. In a research of low moisturized soy protein isolate melts using the capillary tube viscometer (Hayashi, 1992), howe ver, they re vealed that Bagley's end correction method could not be used for the entrance effect correction.
Because the correction coefficient had larger value (1.5"'-'5.0 times) than L/R of the capillary tube, with the result that there was much larger correction value
than the pressure drop at the capillary tube wall. In the same way as this result, Bagley's end correction method could not be used for the entrance effect
correction of food polymer melts or the starch melts. Therefore an other correction method using orifice devel oped by Hayashi et al.
(1991, 1993)
waapplied. The availability of this method is confirmed by them.
IV-2-3
Measurement of flow propertiesThe capillary tube viscometer us1ng for the measurement of the f low properties of starch melts is same as in Chapter
III-2-2. A 4.0
g of the moisture-adjusted starch was moulded into a cylindrical shape(1.08
em indiameter and about
3.0
em in length) using a hand press(SHIMADZU
Co. Ltd.,Kyoto, Japan) and placed into the sample reservoir. The reservoir was heated to
150
OC in advance and the measurements of flow properties were performed at150
°C, at which the starches melt sufficiently from results of ChapterIII.
Underthe condition of vertical l oad at
15
�a, the starch was kept for15
min in the reservoir for melt them. Tw o types of the die were used for the measurements of flow properties in the capillary tube. The one was a capillary tube which has0.75
nun in radius
(R)
and20
mm in length(L),
and the other was an orifice whichhas same radius as the capillary tube (Fig.
IV-1).
The resultant pressure dr ops were measured for a capillary tube(t1Pc,
�a) or an orifice(t1Po,
�a) atvarious plunger speeds, i.e. various volumetric flow rate, Q (m3 s-'). Entrance
1.5¢mm
I
1.5¢mm
I
8¢mm
I I
8 8
0 N
Fig.
IV -1Designs of capillary tube (left) and orifice (right).
effect correction was done by subtracting
L1Po
fromL1Pc
at the same value ofQ.
This gives
L1Pd (=L1Pc-L1Po)
which indicates the pressure drop in the capillarytube. The volumetric flow rate,
Q,
was converted into apparent shear rate(ira,
s-') by using the equation:%
=4QinR3•
The pressure drop in the capillary tube,L1Pd,
was converted into shear stress by using the equation: rw =
L1PdxR/2L.
IV-
2-4
Regression analysisThe Herschel-Bulkley power-law model (Skelland, 1967) was applied to measured data in order to characterize the flow properties of starch melts:
rw = ro +
( ry'x}'t
where 'r0 (MPa) is the yield stress, i.e. the minimum shear stress required for flow; n (dimensionless) is the flow behaviour index; 77' (MPa1111 s) is the consistency index.
Since the model equation is intrinsically non-linear, the ordinary regression method for linear equations is not applicable. Therefore, the successive approximative calculation was performed iteratively at each moisture content using a computer (PC-9801DS, Nippon Electric Co. Ltd., Tokyo, Japan) to find the regression coefficients that minimize the residual sum of squares (Snedecor
& Cochran, 1972).
IV-3 Results and Discussion
IV-3-1 Flow curves of starch melts
Figure IV-2 and IV-3 show the observed volumetric flow rates,
Q
(m3 s-1), and resultant i1Pc or i1Po (MPa) on logarithmic scales of potato and corn starch melts, respectively. The pressure drop of the starch melts increased linearly as increasing the flow rate. These relationships between flow rates and pressure drops changed as the moisture content was changed. To further analyze the flow properties of these starches, the pressure drops in the capillary tube, i1Pd=i1Pc!JPo, were calculated at same flow rates applying the correction method using
orifice (Hayashi et al.
1991).
The relationships between volumetric flow rate,Q,
and obtained i1Pd of potato and corn starch melts were shown in Fig. IV-4 and IV-5, respectively. These curves had good linearly on logarithmic scales.
Apparent shear rate,
%,
and shear stress, rw, were calculated fromQ
and i1Pd.The relationships between
%
and rw of potato and corn starch melts were shown in Fig. IV-6 and IV-7, respectively. Figure IV-6(A)
and IV-7(A)
show the relationships on logarithmic scales. So the flow curves of starch melts with each moisture content had good linearly that the starch melts could be belong to power-law fluids. On the other hand, Figure IV-6(B)
and IV-7(B)
show the relationships on ordinary scales. These starch melts assumed to have some yield stress, especially at lower moisture content. From these results, the starch meltsVl �
10
3capillary tube
10
2,-...._
� ro
� 101
'-"
()
� 100
1 0 -1
L---'----'---'--'-�-_.______.___.___.__.__.__._.__.____.____.___.___.___.__L.LLJ
10-8 10-7 10-6 10-5
Q
(m3 /sec),-._
� ro
10
3- ont1ce
10
26 101
%
010
°1 0
-] L.__.____._____,___,_� _ _.______.___.___.___.--'--'-'--'-____.___.__..__._._�10 -8 10-7 10-6 10-5
Q
(m3 /sec)Fig.
IV-2
Relationships between flow rate and pressure drop for potato starch melts with various moisture content at150
°C.Moisture content (g-H20/g-solid):