Topics: Recent topics in public health in Japan 2020
National Health Promotion Measures in Japan:
Health Japan 21(the second term)
YOKOYAMA Tetsuji
Department of Health Promotion, National Institute of Public Health Abstract
Japan has experienced a dramatic decrease in the age-adjusted mortality rate from cerebrovascular dis-ease, which previously was exceptionally high in the world. Such a dramatic change is thought to be due to changes in Japanese lifestyles, controlling of risk factors especially hypertension, and improvements in the medical care quality. These favorable changes have been further promoted since a series of National Health Promotion Measures began in 1978. Since then, the plan has been revised approximately every 10 years according to PDCA cycles. The first National Health Promotion Measures focused on implementation of health checkups, the establishment of municipal health centers, and the securing of manpower. The second National Health Promotion Measures called “Active 80 Health Plan” aimed to ensure that the people at the age of 80 could take care of themselves and participate in social activities, and was focused on physical ex-ercise. The third National Health Promotion Measures, called “Health Japan 21” and started in fiscal year 2000, set numerical targets for 70 items in 9 fields (later increased to 80 items, including duplicated items) concerning lifestyle-related diseases and the improvement of lifestyles.
Based on the issues revealed in the evaluation of Health Japan 21 and subsequent discussion, the fourth National Health Promotion Measures called “Health Japan 21 (the second term)” covered new areas including the reduction of health disparities and improvement of the social environment. The midterm evaluation in 2018 showed that the extension of healthy life expectancy and reduction of health disparities that were the overall goals had improved significantly. However, there were several indicators that were unchanged or be-came worse. Issues to be prioritized in order to achieve the final evaluation target in 2022 were identified. keywords: Health Japan 21, National Health Promotion Measures, health policy, policy evaluation, NCDs
(accepted for publication, January 14, 2020)
< Review >
Corresponding author: YOKOYAMA Tetsuji 2-3-6 Minami, Wako, Saitama 351-0197, Japan. E-mail: [email protected]
I. Introduction
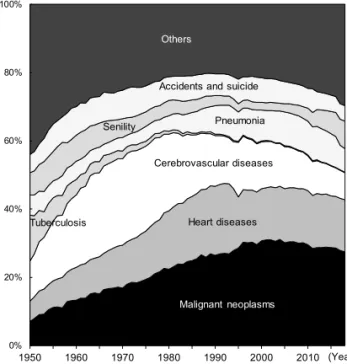
After the end of World War II, the leading causes of death in Japan shifted from tuberculosis and other infections to non-communicable diseases (NCDs) including stroke, heart diseases and malignant neoplasms (Figure 1)[1]. Particular-ly, stroke was the leading cause of death in Japan from the 1960s to the 1970s, and its age-adjusted mortality rate was exceptionally high as compared with other developed coun-tries (Figure 2)[2]. Although the age-adjusted mortality rate from stroke in Japan decreased rapidly thereafter, the rate
for men in recent years still ranked high among developed countries. In contrast, the age-adjusted mortality rate from ischemic heart disease in Japan has been much lower than that in Scandinavian and North American countries, and is also considerably lower even in comparison with France and other Mediterranean countries (Figure 2). However, as the pace of decrease has been low in recent years, the rate is approaching that in France both for males and females.
Such dramatic changes in cause-specific mortality rate are thought to be due to changes in Japanese lifestyles, the controlling of risk factors, especially hypertension, and
0% 20% 40% 60% 80% 100% 1950 1960 1970 1980 1990 2000 2010 Malignant neoplasms Heart diseases Cerebrovascular diseases Tuberculosis Pneumonia Accidents and suicide
Others Senility (Year) 0 50 100 150 200 250 300 1950 1955 1960 1965 1970 1975 1980 1985 1990 1995 2000 2005 2010 2015 Finland UK USA Sweden Canada Australia Italy Spain Portugal France Japan 0 50 100 150 200 250 300 1950 1955 1960 1965 1970 1975 1980 1985 1990 1995 2000 2005 2010 2015
Male
Female
ag e-adj us te d m or ta lit y ra te (pe r 100, 000)Ischemic heart diseases
Cerebrovascular diseases
0 50 100 150 200 250 300 350 400 450 1950 1955 1960 1965 1970 1975 1980 1985 1990 1995 2000 2005 2010 2015 Finland UK USA Sweden Canada Australia Italy Spain Portugal France Japan 0 50 100 150 200 250 300 350 400 450 1950 1955 1960 1965 1970 1975 1980 1985 1990 1995 2000 2005 2010 2015 ag e-adj us te d m or ta lit y ra te (pe r 100, 000)Male
Female
↓ Japan ↓ Japan ↑ Japan ↑ JapanFigure 1 Secular trends in the proportion of deaths from selected causes in Japan
Figure 2 International comparison of secular trends in age-adjusted mortali-ty rates from cerebrovascular diseases and ischemic heart diseases Source: Calculated using WHO Mortality Database (raw data files), updated as of May 2019, and the
population data from World Standard Population. Values are 3-year moving averages. Source: Vital Statistics, Ministry of Health, Labour and Welfare.
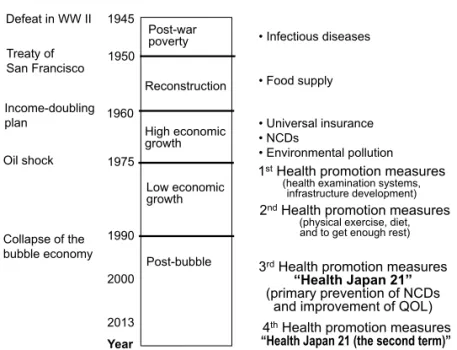
improvements in medical care quality. To better understand these changes, it will be helpful to divide the postwar histo-ry of Japan into five eras (Figure 3).
During the so-called age of postwar poverty, the priority issues in public health were food measures and controlling infections such as tuberculosis. In this period, the dietary pattern of Japanese people was characterized by high salt, high carbohydrate, low fat, and low animal protein. Much salt and extremely low meat consumption caused hyperten-sion and extremely low levels of serum total cholesterol. This presumably contributed to the large increase in the risks of developing cerebral hemorrhage and perforator
in-farction[3].
As the economy grew dramatically during the age of high economic growth from around 1960 to 1975, the lifestyles of Japanese people were gradually modernized. The consump-tion of fat and animal protein increased year by year, and the total energy intake peaked in 1971[4]. The age-adjusted mortality rate from stroke started to decline. In this era, new priority issues in public health arose such as so-called adult diseases (NCDs that frequently occur in middle-aged to elderly people), mental health, and air pollution. Several epidemiological studies to identify major risk factors of NCDs, especially stroke, started in Japan. The adult
diseas-Figure 3 Changes in public health issues in post-war Japan, from the lecture material by Heizo Tanaka (partially altered)
Figure 4 Overview of Health Promotion Measures following the PDCA cycle in Japan Post-war poverty Reconstruction High economic growth Low economic growth Post-bubble 1945 1960 1975 1990 1950 2000
Public Health Issues
• Infectious diseases • Food supply Oil shock Income-doubling plan Collapse of the bubble economy Socio-economic status • Universal insurance • NCDs • Environmental pollution
1stHealth promotion measures
2013
(health examination systems, infrastructure development)
2nd Health promotion measures
(physical exercise, diet, and to get enough rest)
3rd Health promotion measures “Health Japan 21” (primary prevention of NCDs
and improvement of QOL) 4th Health promotion measures “Health Japan 21 (the second term)” Year
Treaty of San Francisco Defeat in WW II
2013 - 4th Plan for Health promotion:
“Health Japan 21 (2ndterm)”
1988 - 2nd National Health promotion measures
(health promotion, in particular promotion of exercise)
1978 - 1st National Health promotion measures (introduction of screening, infrastructure development)
2000 - 3rd National Health promotion
measures: “Health Japan 21”
(primary prevention of NCDs, improvement of QOL, extension of healthy life expectancy)
P D C A P D C A 2008 - Specific Health Examination and Guidance (focused on metabolic syndrome)
Midterm evaluation (2005) P D C A Final evaluation (2012) Midterm Evaluation (2012)
Traditional Health Examination (for the prevention of stroke and IHD
through hypertension management)
Midterm evaluation (2018) Final evaluation (2017)
Increasing Diabetes and Obesity
2013 - Data-Health Plan (by health insurers)
P D C A Evaluation (2017)
the third term
the second term
Latter period P D C A P D C A
es or NCDs would later be called lifestyle-related diseases because the epidemiological evidence revealed that the onset and progression of these diseases could be prevented through lifestyle modification[5].
When the age of low economic growth started after the oil shock in the 1970s, the crude mortality rates from heart diseases and malignant neoplasms were increasing due to the aging population and further rapid aging was projected for Japan. Furthermore, a mass health screening for the prevention of NCDs has not yet been introduced. Thus, the preventive measures of NCDs by a population approach and high-risk approach became increasingly important.
In 1978, the Japanese government introduced the first comprehensive national health promotion measures to pre-vent NCDs. Since then, the plan has been revised approxi-mately every 10 years according to PDCA (plan, do, check, and act) cycles (Figure 4). The current 4th revision so-called
Health Japan 21 (the second term) has been implemented since 2013.
This article provides an overview of the history of na-tional health promotion measures in Japan and the recent midterm evaluation of Health Japan 21 (the second term).
II. History of First to Third Health
Promo-tion Measures in Japan
1. First National Health Promotion Measures
In fiscal year 1978, Japan’s Ministry of Health and Wel-fare started to implement the First National Health Promo-tion Measures aiming to spread the concept that each of the Japanese people should protect their own health.
These measures were planned to spread a national cam-paign focusing on three pillars: 1) the implementation of health checkups, 2) the establishment of municipal health centers, etc., and 3) the securing of manpower, including public health nurses, dietitians, etc[5,6]. Because creation of an enabling environment was a primary prerequisite for the long-term advancement of national health promotion for the future, efforts were made for infrastructure devel-opment including municipal health centers and the securing of manpower including public health nurses and dietitians. In particular, a high priority was given to establish health checkup and health guidance systems emphasizing the prevention of stroke and other cardiovascular diseases. As mentioned above, the age-adjusted mortality rate from cerebrovascular disease in Japan started to decrease rapidly at about this time, and this may be attributed to the intro-duction of health checkups, widespread of blood pressure management, lifestyle improvements, etc.
2. Second National Health Promotion Measures (Ac-tive 80 Health Plan)
The life expectancy of Japanese people continued to extend steadily, exceeding 80 years for women in 1984 (80.18 years for women and 74.54 years for men)[7]. The Second National Health Promotion Measures called “Active 80 Health Plan” was started in fiscal year 1988, aiming to ensure that the people at the age of 80 could take care of themselves and participate in social activities. In addition to the traditional measures for disease prevention, a new goal was set. It was to drive health promotion projects with an emphasis on physical exercise, which had been making relatively little progress. Facility development and human resource development for health promotion were strength-ened with the active use of private-sector resources, as well as promotion of the training of health exercise instructors, health exercise practice leaders, and exercise promotion volunteers. In addition, exercise guidelines and other mate-rials were formulated and revised.
3. Third National Health Promotion Measures (Health Japan 21)
While the First and Second National Health Promotion Measures achieved a certain degree of effectiveness, the rapid aging of society and the diversification of lifestyles contributed to a continued increase in the proportion of lifestyle-related diseases among all diseases and also to an increase in the social burden. Accordingly, the Third Nation-al HeNation-alth Promotion Measures (HeNation-alth Japan 21) starting in fiscal year 2000 set concrete numerical targets for 70 items in 9 fields (later increased to 80 items, including du-plicated items) concerning lifestyle-related diseases and the improvements of lifestyles causing them. A new health pro-motion campaign was driven not only by the efforts of the national and local governments but also the active partici-pation and cooperation of various relevant organizations[8]. In addition, as a legal basis for further active advancement of national health promotion and disease prevention pivoted on Health Japan 21, the Health Promotion Act was enacted. Prefectures also formulated prefectural health promotion plans as local plans under Health Japan 21, based on the provisions of the Health Promotion Act and taking into con-sideration the basic policy of the national plan.
The important feature of Health Japan 21 was the defi-nition of numerical targets. In the field of cardiovascular diseases, a quantitative evaluation was performed regard-ing how much the improvement of lifestyle and risk fac-tors could contribute to an improvement of morbidity and mortality from cardiovascular diseases, a decline in ADL (activities of daily living), and other health indicators based on scientific evidence mainly derived from epidemiological
studies in Japan. According to the epidemiological evidence, the risk factors for the development of stroke in Japan were 1) hypertension, 2) smoking, 3) impaired glucose tolerance, and 4) heavy drinking. Those for ischemic heart disease were 1) hypertension, 2) smoking, and 3) hyperlipidemia. Therefore, cardiovascular disease prevention measures were developed principally targeting at 1) hypertension, 2) smoking, 3) impaired glucose tolerance, 4) heavy drinking, and 5) hyperlipemia. Since the prevention of obesity, salt reduction, intake of potassium, exercise, and other factors are important for the prevention of hypertension, the ef-fectiveness of the improvement of these lifestyle factors in reducing blood pressure of Japanese population as a whole was also evaluated based on clinical epidemiological studies and other evidence[8].
Health measures such as Health Japan 21 have been evaluated and revised according to the concept of PDCA cy-cles (Figure 4), including an interim evaluation in 2005 and a final evaluation and revision in 2012[9,10]. The final eval-uation identified the following issues in the field of cardio-vascular disease, and these were considered in the review for the development of the next (fourth) National Health Promotion Measures. 1) Although improvements were seen in the mean levels of blood pressure and the prevalence of hypertension, the prevalences were still high mainly among elderly people. Nationwide strengthening of prevention measures of hypertension was needed. Measures against obesity were considered to be important, since there was concern about the future increase in blood pressure due to the increase in obesity. 2) To reduce the prevalence of
hy-perlipidemia, there was a need for population strategy, such as education and dissemination activities concerning the re-duction of the intake of saturated fatty acid and the nutrient labeling.
3) Potassium intake was showing a decreasing trend. Because of the concern that this might contribute to the increase in blood pressure, measures were needed such as increases in the intake of vegetables and fruits. 4) Efforts to improve health checkups rate should be made, mainly fo-cusing on women and young adults. Although the cardiovas-cular mortality rate was showing a decreasing trend, there was a need for incidence rate monitoring by construction of a disease registration system, etc.
III. Health Japan 21 (the second term) (Fourth
National Health Promotion Measures)
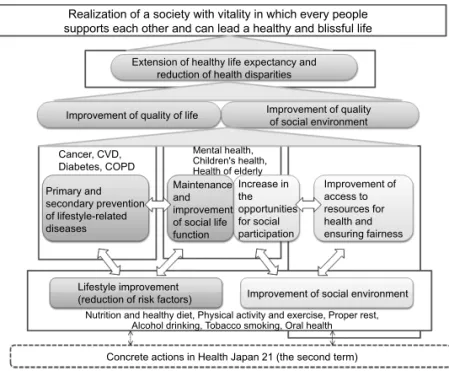
1. Basic directionBased on the issues revealed in the evaluation of Health Japan 21 and subsequent discussion, Health Japan 21 (the second term) defined the desirable state of affairs 10 years into the future as “Realization of a society with vitality in which every people supports each other and can lead a healthy and blissful life.” As for the basic directions, these measures addressed the five areas: 1) extension of healthy life expectancy and reduction of health disparities, 2) prima-ry and secondaprima-ry prevention of lifestyle-related diseases, 3) maintenance and improvement of functions needed for liv-ing in society, 4) improvement of social environment to sup-port and protect health, and 5) improvement of lifestyle and
Realization of a society with vitality in which every people supports each other and can lead a healthy and blissful life
Extension of healthy life expectancy and reduction of health disparities
Improvement of quality of life Improvement of qualityof social environment
Primary and secondary prevention of lifestyle-related diseases Maintenance and improvement of social life function Lifestyle improvement
(reduction of risk factors) Improvement of social environment Increase in the opportunities for social participation Improvement of access to resources for health and ensuring fairness Mental health, Children's health, Health of elderly
Nutrition and healthy diet, Physical activity and exercise, Proper rest, Alcohol drinking, Tobacco smoking, Oral health
Concrete actions in Health Japan 21 (the second term) Cancer, CVD,
Diabetes, COPD
Figure 5 The whole picture of Health Japan 21 (the second term) Source: Reference material of Health Japan 21 (the second term) (partially altered).
social environment in terms of nutrition and healthy diet, physical activity and exercise, proper rest, alcohol drinking, smoking, and dental and oral health[11].
The relationship among these desirable state of soci-ety and basic directions can be summarized as in Figure 5. Efforts are made to prevent the onset and progression of lifestyle-related diseases through improvements of the lifestyles of individuals and improvements of social envi-ronment surrounding individuals, to improve the quality of life through the reduction of a loss of social life functions, to improve the access to the resources for health and ensure fairness, and to improve the quality of the social environ-ment through the increase in the opportunities for social participation, ultimately realizing an extension of healthy life expectancy and reducing health disparities.
Because Health Japan 21 was developed by mainly fo-cusing on the lifestyles of individuals, it generally lacked a perspective of social environment. However, the health of individuals and the development of a social environment are both indispensable like a pair of wheels. Health Japan 21 (2nd edition), therefore, considers it necessary to clarify the issues related to social environment, and placed much emphasis on the development of social environment, where the society as a whole protects health through mutual sup-port, aiming at a reduction of health disparity (differences in health status among groups arising from differences in location or socioeconomic conditions).
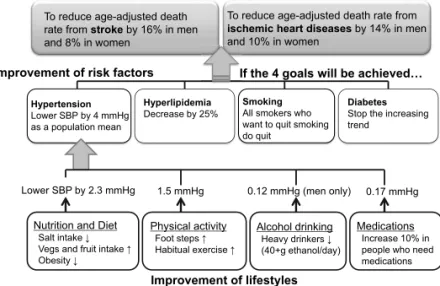
With respect to the prevention of cardiovascular diseases, the main focus is on the management of risk factors, as was the case with Health Japan 21. Four established risk factors were identified: hypertension, dyslipidemia, smoking, and diabetes. Smoking, which was not included in Health Japan 21, was added as an indicator. Of these factors, hypertension shows a very high population attributable risk percentage
for the onset of cardiovascular diseases, and it is the most important risk factor in Japan. When the targets were set, the causal relationships among these indicators were orga-nized into the three stages of “prevention of cardiovascular diseases,” “improvement of risk factors,” and “improvement of lifestyles” (Figure 6), and the relationships among the indicators were quantified mainly based on epidemiological evidence.
2. Midterm-evaluation
The midterm-evaluation was performed in fiscal year 2018 for the purpose of confirming whether the current status of indicators and related efforts were progressing smoothly toward the final targets that should be achieved in 2022. According to the midterm-evaluation, the issues that should be prioritized to achieve the targets were clarified. The indicators have been monitored by available statistical data including lifetables, vital statistics, the Comprehensive Survey of Living Conditions, the National Health and Nu-trition Survey, etc. The annual change in the indicator was visualized using a chart.
By comparing the baseline and latest values, the indi-cators were evaluated in the following four categories: a) improved, b) unchanged, c) became worse, and d) cannot evaluate (lack of data, etc.). The improved indicators in category a) were also assessed to establish whether or not they were likely to achieve the final goals.
Table 1 summarizes the results of the evaluation of the basic directions in five areas. Of these, the overall goals were the extension of healthy life expectancy and reduction of health disparities. The healthy life expectancy (average period of time spent without limitation in daily activities), calculated based on lifetables and the Comprehensive Survey of Living Conditions, was 70.42 years in males and
To reduce age-adjusted death rate from stroke by 16% in men and 8% in women
To reduce age-adjusted death rate from ischemic heart diseases by 14% in men and 10% in women
Prevention of cardiovascular diseases
Improvement of risk factors
Improvement of lifestyles Hypertension
Lower SBP by 4 mmHg as a population mean
Hyperlipidemia
Decrease by 25% SmokingAll smokers who want to quit smoking do quit
Diabetes
Stop the increasing trend
Lower SBP by 2.3 mmHg 1.5 mmHg 0.12 mmHg (men only) 0.17 mmHg Nutrition and Diet
Salt intake ↓ Vegs and fruit intake ↑ Obesity ↓ Physical activity Foot steps ↑ Habitual exercise ↑ Alcohol drinking Heavy drinkers ↓ (40+g ethanol/day) Medications Increase 10% in people who need medications If the 4 goals will be achieved…
Table 1 Results of the midterm-evaluation of Health Japan 21 (the second term) 1. Extension of healthy life expectancy and reduction of health
dis-parities (overall goals) a) Improved
• Extension of healthy life expectancy (average period of time spent without limitation in daily activities)
• Reduction of health disparities (gap among prefectures in average period of time spent without limitation in daily ac-tivities)
2. Prevention of onset and progression of life-style related diseas-es (prevention of NCDs)
a) Improved
• Reduction in age-adjusted mortality rate of cancer under age 75
• Increase in participation rate of cancer screenings • Reduction in age-adjusted mortality rate of cerebrovascular
disease (CVD) and ischemic heart disease (IHD)
• Improvement of hypertension (reduction in average systol-ic blood pressure)
• Increase in participation rates of specified health checkups and specified health guidance (focused on metabolic syn-drome)
• Decrease in percentage of individuals with elevated blood glucose levels
b) Unchanged
• Reduction in percentage of adults with dyslipidemia • Reduction in number of definite and at-risk people with
metabolic syndrome
• Reduction in diabetic complications (number of patients newly introduced to dialysis due to diabetic nephropathy) • Increase in percentage of patients who continue treatment • Prevention of increase in number of diabetic persons • Increase in recognition of COPD
3. Maintenance and improvement of functions necessary for en-gaging in social life
a) Improved
• Reduction in suicide rate
• Increase in percentage of occupational settings where in-terventions for mental health are available
• Increase in number of pediatricians and child psychiatrists per 100,000 children
• Increase in percentage of children who maintain healthy lifestyle (nutrition, dietary habits, physical activity) • Increase in percentage of individuals who know about
loco-motive syndrome
• Restraint of the increase in undernourished elderly (BMI under 20)
• Decrease in the number of elderly with back or foot pain (per 1,000)
b) Unchanged
• Decrease in percentage of individuals who suffer from mood disorders or anxiety disorders
• Increase in percentage of children with ideal body weight • Restraint of the increase in Long-Term Care Insurance
service users
• Promotion of social participation (employed or engaged in community activities)
d) Cannot evaluate
• Increase in identification rate of high-risk elderly with low cognitive function
4. Establishment of a social environment where the health of indi-viduals is protected and supported
a) Improved
• Strengthening of community ties
• Increase in number of corporations that deal with health promotion and educational activities
• Increase in number of civilian organizations that offer accessible opportunities for health promotion support or counseling
• Increase in number of local governments that make efforts to solve health disparity issues
b) Unchanged
• Increase in percentage of individuals who are involved in health promotion activities
5. Improvement of social environment and lifestyle, such as nu-trition and dietary habits, physical activity and exercise, rest, alcohol drinking, tobacco smoking, and oral health
(1) Nutrition and dietary habits a) Improved
• Increase in number of corporations in food industry that supply food product low in salt and fat
• Increase in percentage of specific food service facilities that plan, cook, and evaluate and improve nutritional content of menu based on the needs of clients
b) Unchanged
• Increase in percentage of individuals maintaining ideal body weight
• Increase in percentage of individuals who consume ap-propriate quality and quantity of food
• Increase in dining with family regularly (2) Physical activity and exercise
a) Improved
• Increase in number of local governments that offer com-munity development and environment to promote physi-cal activity
b) Unchanged
• Increase in daily number of steps
• Increase in percentage of individuals who regularly exer-cise
(3) Rest a) Improved
• Reduction in percentage of employees who work 60 hours or more per week
b) Unchanged
• Reduction in percentage of individuals who do not take rest through sufficient sleep
(4) Alcohol drinking a) Improved
• Eradication of underage drinking
• Eradication of alcohol consumption among pregnant women
b) Unchanged
• Reduction in percentage of individuals who consume alcohol over recommended limits (males>40 g, fe-males>20 g per day)
(5) Tobacco smoking a) Improved
• Reduction in percentage of adult smoking rate (quiting smoking among smokers who want to quit)
• Eradication of underage smoking • Eradication of smoking during pregnancy
• Reduction in percentage of individuals who are exposed to passive smoking
(6) Dental and Oral health a) Improved
• Prevention of tooth loss
• Increase in number of children without dental caries • Increase in percentage of individuals who participated in
dental check-up during the past year b) Unchanged
• Maintenance and improvement of oral function c) Became worse
• Decrease in percentage of individuals with periodontal disease
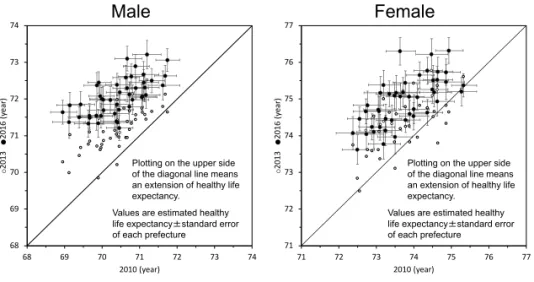
73.62 years in females at the baseline in 2010 and extended to 72.14 years in males and 74.79 years in females in 2016.
The extension of healthy life expectancy was longer than that of average life expectancies during the same period. Thus, the unhealthy period has shortened in both males and females (Table 2). The reduction of health disparities was evaluated by comparing the longest and shortest healthy life expectancies among the 46 prefectures in Japan (one prefecture was not evaluated because the data was not available due to a big earthquake in 2016) (Figure 7). The difference in the range of healthy life expectancy shortened from 2.79 to 2.00 years in males and from 2.95 to 2.70 years in females. Not only the range but also the variance of healthy life expectancies among the 46 prefectures became significantly smaller as graphically illustrated in Figure 8. Table 2 The extension of healthy life expectancy from 2010
to 2016
Year
Extension
2010 2016
Male
Healthy life expectancy 70.42 72.14 1.72
Life expectancy 79.55 80.98 1.43
Unhealthy period 9.13 8.84 -0.29
Female
Healthy life expectancy 73.62 74.79 1.17
Life expectancy 86.30 87.14 0.84
Unhealthy period 12.68 12.35 -0.33
Values are in years.
Figure 7 Comparison of healthy life expectancy (average period of time spent without limitation in daily activities) among 46 prefectures in Japan between 2010, 2013, and 2016
Figure 8 Comparison of healthy life expectancy (average period of time spent with-out limitation in daily activities) corrected for error variance among 46 prefectures in Japan between 2010, 2013, and 2016
68 69 70 71 72 73 74 68 69 70 71 72 73 74 ○ 2013 ● 2016 ( ye ar ) 2010 (year) 71 72 73 74 75 76 77 71 72 73 74 75 76 77 ○ 2013 ● 2016 ( ye ar ) 2010 (year)
Male
Female
Plotting on the upper side of the diagonal line means an extension of healthy life expectancy.
Values are estimated healthy life expectancy±standard error of each prefecture
One prefecture was not shown because the data was not available due to a big earthquake in 2016.
Plotting on the upper side of the diagonal line means an extension of healthy life expectancy.
Values are estimated healthy life expectancy±standard error of each prefecture 68 69 70 71 72 73 74 -3 -2 -1 0 1 2 3 H ea lth y lif e ex pec ta nc y ( yea rs ) Z-score 2016 (SD=0.37) 2013 (SD=0.47) 2010 (SD=0.58)
SD: standard deviation of healthy life expectancies among the prefectures. A larger SD means a larger disparities.
Upper Lower 70 71 72 73 74 75 76 -3 -2 -1 0 1 2 3 H ea lth y lif e ex pec ta nc y ( yea rs ) Z-score 2016 (SD=0.53) 2013 (SD=0.61) 2010 (SD=0.65)
SD: standard deviation of healthy life expectancies among the prefectures. A larger SD means a larger disparities.
Upper Lower
2
The values were corrected for the error variance.
One prefecture was not shown because the data was not available due to a big earthquake in 2016. P = 0.001 for reduction of health disparities among prefectures P = 0.041 for reduction of health disparities among prefectures
IV. Conclusion
During the period of post-war economic growth, Japan experienced a dramatic decrease in the age-adjusted mor-tality rate from cerebrovascular disease, which previously was exceptionally high in the world. Such a dramatic change is thought to be due to changes in Japanese lifestyles, the controlling of risk factors especially hypertension, and im-provements in medical care quality.
These favorable changes have been further promoted since a series of National Health Promotion Measures be-gan in 1978. However, new health issues have appeared such as the increasing trend of obesity and diabetes. Ac-cordingly, a new health examination system called Spe-cific Health Examination and Health Guidance have been introduced since 2008 focusing on metabolic syndrome. The Health Promotion Measures have been evaluated and revised approximately every 10 years according to the PDCA cycle, and are expected to continuously contribute to improving the health of the Japanese population and the extending of healthy life expectancy.
This article is an overview of the National Health Promo-tion Measures and its history. For more informaPromo-tion about features, basic ideas, outline of measures, and related guide-lines concerning the National Health Promotion Measures, readers are advised to see other English literatures[12-14].
References
[1] Ministry of Health, Labour and Welfare. [2018 Vital statistics (Volume 1, Death, Table 5.12).] (in Japanese) 厚生労働省.平成28年度人口動態統計( 1 巻,死亡, 表5,12).
[2] World Health Organization. WHO Mortality Database (raw data files), Updated as of May 2019. https://www. who.int/healthinfo/mortality_data/en/ (accessed 2020-01-11)
[3] Japan Epidemiological Association, edited. [Epidemiol-ogy handbook: Epidemiol[Epidemiol-ogy and prevention of import-ant diseases.] Tokyo: Nankodo; 1998. p.82-83, 183-202. (in Japanese)
日本疫学会,編.疫学ハンドブック・重要疾患の疫 学と予防.東京:南江堂;1998.p.82-83, 183-202. [4] Ministry of Health, Labour and Welfare. [National
nu-trition survey / National health and nunu-trition survey. 1945-2010.] https://www.mhlw.go.jp/bunya/kenkou/ kenkou_eiyou_chousa.html (accessed 2020-01-11) (in Japanese)
厚生労働省.国民栄養調査/国民健康・栄養調査. 1945-2010. (in Japanese) https://www.mhlw.go.jp/bunya/ kenkou/kenkou_eiyou_chousa.html (accessed
2020-01-11)
[5] Ministry of Health, Labour and Welfare. [2014 Annual report on health, labour and welfare.] Tokyo: Nikkei Printing; 2014. p.13-42. (in Japanese)
厚生労働省.平成26年版厚生労働白書.東京:日経 印刷;2014. p.13-42.
[6] Ministry of Health, Labour and Welfare. [2010 Annual report on health, labour and welfare.] Tokyo: Nikkei Printing; 2010. p.63. (in Japanese)
厚生労働省.平成22年版厚生労働白書(資料編). 東京:日経印刷;2010. p.63.
[7] Ministry of Health, Labour and Welfare. [2016 Abridged life table.] https://www.mhlw.go.jp/toukei/saikin/hw/life/ life16/ (accessed 2020-01-11) (in Japanese)
厚生労働省.平成28年簡易生命表の概況.https:// www.mhlw.go.jp/toukei/saikin/hw/life/life16/ (accessed 2020-01-11)
[8] Health Japan 21 Planning Group / Health Japan 21 Proj-ect Development Group. [Report on National Health Promotion Campaign for the 21st Century (Health Japan 21) (February 2000).] http://www1.mhlw.go.jp/topics/ kenko21_11/pdff.html (accessed 2020-01-11) (in Japa-nese) 健康日本21企画検討会/健康日本21計画策定検討会. 21世紀における国民健康づくり運動(健康日本21) について報告書(平成12年 2 月).http://www1.mhlw. go.jp/topics/kenko21_11/pdff.html (accessed 2020-01-11)
[9] Health Promotion and Nutrition Section, Health Sci-ences Council. [Report of interim evaluation of “Health Japan 21.” (April 10, 2007).] http://www.kenkounip- pon21.gr.jp/kenkounippon21/ugoki/kaigi/pdf/0704hyou-ka_tyukan.pdf (accessed 2020-01-11) (in Japanese) 厚生科学審議会地域保健健康増進栄養部会.「健康 日本21」中間評価報告書.平成19年 4 月10日.http:// www.kenkounippon21.gr.jp/kenkounippon21/ugoki/kaigi/ pdf/0704hyouka_tyukan.pdf (accessed 2020-01-11) [10] Health Japan 21 Evaluation Work Team. [“Health Japan
21” Final evaluation. (October 2011).] https://www. mhlw.go.jp/stf/houdou/2r9852000001r5gc.html (ac-cessed 2020-01-11) (in Japanese)
健康日本21評価作業チーム.「健康日本21」最終評価. 平成23年10月.https://www.mhlw.go.jp/stf/houdou/2r-9852000001r5gc.html (accessed 2020-01-11)
[11] Community Health, Health Promotion and Nutrition Section / Special Committee on Planning of Next National Health Promotion Campaign, Health Sciences Council. [Information material on the promotion of Health Japan 21 (Second edition) (July 2012).] https://www.mhlw.go.jp/ bunya/kenkou/dl/kenkounippon21_02.pdf (accessed 2020-01-11) (in Japanese)
厚生科学審議会地域保健健康増進栄養部会/次期 国民健康づくり運動プラン策定専門委員会.健康 日本21(第 2 次)の推進に関する参考資料.平成24 年 7 月.https://www.mhlw.go.jp/bunya/kenkou/dl/kenk-ounippon21_02.pdf (accessed 2020-01-11)
[12] Ministry of Health, Labour and Welfare. Ministerial notification No. 430 of the Ministry of Health, Labour and Welfare. https://www.mhlw.go.jp/file/06-Seisakujo-uhou-10900000-Kenkoukyoku/0000047330.pdf (accessed
2020-01-11)
[13] Ministry of Health, Labour and Welfare. Health and medical services. In: Annual Health, Labour and Welfare Report 2017. p.63-64. https://www.mhlw.go.jp/english/ wp/wp-hw11/ (accessed 2020-01-11)
[14] Ezoe S, Noda H, Akahane N, Sato O, Hama T, Miyata T, et al. Trends in policy on the prevention and control of non-communicable diseases in Japan. Health Systems & Reform. 2017;3(4):268–277.