Southeast Asz"an Studz"es, Vol. 12, No.3, December 1974
A COD1parative Study on Physical Fitness or Children
or Three Nations; Japanese, Thai and Indonesian
by
Yoshiyuki MATSUURA*, Yoshinori OHYAMA** and Atsushi MURAI***
Introduction
As the one of projects of Center for Southeast Asian Studies, Kyoto University, a survey of physical fitness of elementary school children was carried out in Thailand and Indonesia in the summer 1973 July 16th through September 3rd. This survey was done with the sincere cooperation of the Department of Physical Education Promotion in Thailand and of the Research Institute of Physical Fitness in Indonesia.l) In Japan, the Growth and Develop-ment Research Group, whose members are Kyoto University, Kyoto Women's College, Koka Women's College and Kyoto Prefectural University, have carried out physical fitness tests and surveys on the elementary school children in rural and urban schools in Kyoto prefecture. Thus, the data analyzed in this paper are those which were obtained from the above mentioned field works.2)
In addition, to make a survey of nutritional status, medical examinations were carried out. Our sincere appreciation is given to all the members of the Department of Physical Education Promotion in Thailand, of the Research Institute of Physical Fitness in Indonesia and also of the Growth and Development Research Group in Japan.
I
Samples and Test Items
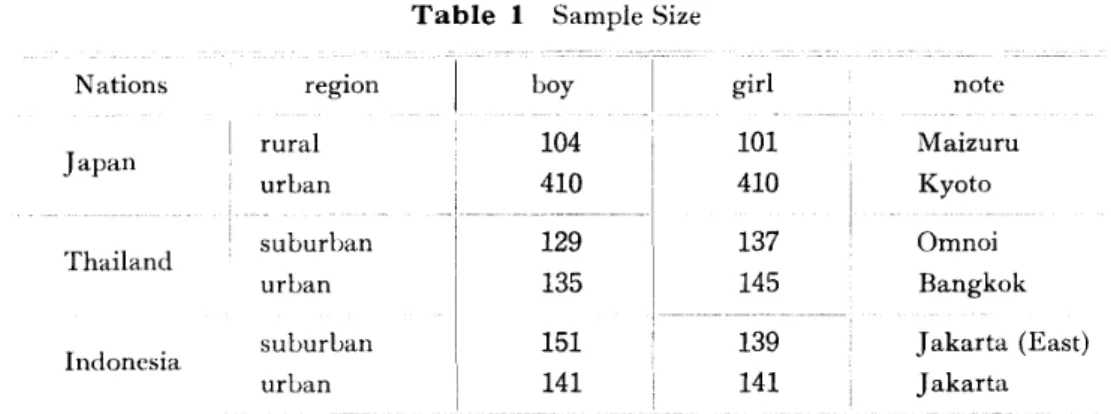
The samples used were as follows;
Table 1 Sample Size
Nations region boy girl note
rural 104 101 Maizuru
Japan
urban 410 410 Kyoto
Thailand suburban 129 137 Omnoi
urban 135 145 Bangkok
Indonesia suburban 151 139 Jakarta (East)
urban 141 141 Jakarta
*
1YliiflNIT, School of Liberal Arts, Kyoto University, Kyoto, Japan** *W~1!&~, The Center for Physical Activity Instruction, Kyoto University, Kyoto, Japan
The samples in Thailand and Indonesia were selected by Thai and Indonesian cooperative agencies, taking account of our proposals.
The items administered were as follows;
Physique: stature, body weight, chest girth, upper arm girth, skinfold fat, leg length. Motor ability: grip strength (muscular strength), flexed arm chinning (muscular endurance), standing broad jump (explosive strength), side step (agility), 50m dash. Nutritional status; seven clinical signs, that is, anemia, edema, diminished turgor, angulitis, enlargement of the liver, accentuation of second pulmonic sound, and diminished knee jerk.
For comparative study, the administration of the test under equal conditions was attempted in each country. However, because of lack of facilities and of familiarization of children with test performances, all the tests were not always administeredinthe equal situation in the three countries.
The test items that were thought to be administered under equal conditions and situations were stature, body weight, upper arm girth, leg length, skinfold fat and grip strength. Other items such as chest girth, flexed arm chinning, standing broad jump, side step and 50 m dash
% THAILAhlD 60 50 40 30 20 10 GRADE ONE
BOY INDONESIA INDONESIA
&
• L. . . . : L_ : ...707.5 80 8,5909500.0.51'1.011.5J2.012513.0AGE ~
SUWAN.- MEXICO SUWAN.- MEXICO
SRISUM.-··· RAWAKEMERI··· SRISUM.-···· RAWAKEMERI .. ···
%
r"'~~~;"~
5.5~~580AGE 556~~,;L,_
808.590 AGEr)1iJ~"~l':J..
657~59095AGE 65"77580~59095IQQ"5I1Q AGE~-.
BOY
GRADE THREE INDONESIA INDONESIA
BOY GRADE FOUR
%1
THAILAND6~gt
40(1"'
3 0 : •. , 20 ... : : : 10_..c:t=::L.u
~~
..
;:':'L_~l3fL...
"859~5110115120125130135140 AGE ~IIOI1512012513,OI~I4OI4.5 AC:£. THAILAND
% 60
50 : :
t~inuu_r&~_
7.58~510010_5AGE 8~510910.5110115120 AGESUWAN.-SRISUM.-.... % THAILAND 60 50 GIRL 40 30 20 10 MEXICO RAWAKEMERI .. ·.. INDONESIA % THAILAND 60 50 40 30 20 10 SUWAN. - MEXICO SRISUM... ·.. RAWAKEMERI ... INDONESIA GIRL
&;.'....,
. J , .-i . C'1 ,...., •Y. MATSUURA, et al: A Comparative Study on Physical Fitness of Children SUWAN-- SRISUM.---GRADE SEVEN BOY ~-r-l_~
.
rl--:~
_.,
.~~_L
__ : __ . _ IIOII~)12~'2.513011.514014515.o AGE%l'
THAILAND 60 MEXICO RAWAKEMERI---INDONESiA INDONESIA .Jl ..~ I '··\.--;".:..:L' . , cL::-~_LH ~L~__L.c_-:._ 10~.I!~512012513013514D145150155160165AGE. AGf '''III IK)~' SUWAN SRISUM---III/\IL./\Nll IHAIL.AND GIRL r'--, , , , , , , , ..../ -,---~ ~-~-_._-110 115 12i 125 130 I:p 14014.5 15.0 AGE fHAILAND IO~ (~- 20r-INDONESIA MEXICO RAWAKE:MERI---IM)O~JESIA GRAD[~)IX SUWAN---- SRISUM---lHAIU\NIlFig. I-b Age Distribution in Each Grade
were thought to be administered under different situations from those done in Japan. And also the test situations in Thailand were different from the ones in Indonesia. Thus, the data obtained from the different ways of test administrations may not be significant for com-parative use.
As mentioned III the preceding, the samples were selected by Thai and Indonesian agencies. These samples were not random but the schools were extracted as the sampling unit, so all the children of the extracted elementary schools were tested. For comparison with Japanese data, it was intended that both urban and rural samples were extracted in Thailand and Indonesia, but not all the schools intended were sampled. The medical ex-aminations were performed by inspection of conjunctiva, lip and tongue, the palpation of liver and four extremities, the auscultation of heart sound and the examination of knee jerk without any particular instruments.
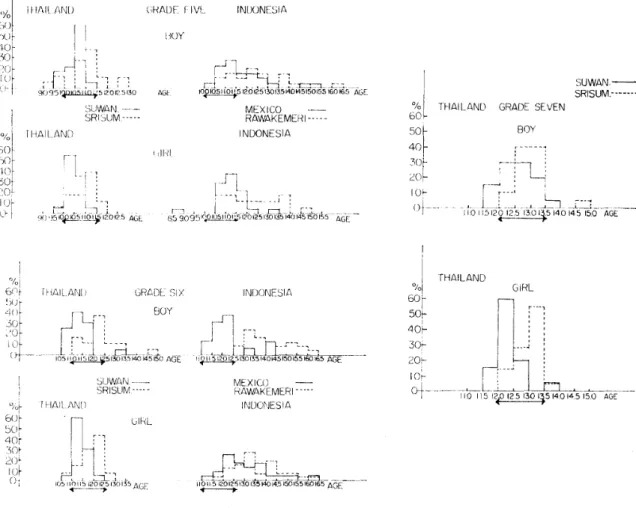
As the data were being processed, it was found that the age dispersion in a given grade was larger in Indonesia and Thailand than in Japan; here the data of a grade could not represent the children of the same age because their ages were dispersed over more than one grade. For comparative purpose, it was found that the means of the same age group
had to be compared. Then, the age dispersions in a given grade arc shown in Fig. 1a,b. From these figures, in Thailand there is a certain degree of difference in age distribution between Suwan-su-N anta (SUWAN) elementary school, urban sample, and Srisum-Ranra-Jbumrung (SRISUM), suburban sample. In other words the Srisum sample had a higher age average for the same grade than the Suwan. The same tendency was noted in Indonesian samples, the Rawakemeri, suburban sample, older than the Mexico elementary school, urban sample. Furthermore, the Indonesian samples were larger in the age dispersion of the same grade than the Thai. The age ranges were reconstituted in process of this study, corresponding to each grade in Japanese elementary school. Therefore, the means of the same age groups must be used for comparison instead of the grade means.
The proper ages corresponding to each grade in Japanese school system are as follows: grade proper age (years)
1 6.0- 7.0 2 7.0- 8.0 3 8.0- 9.0 4 9.010.0 5 10.011.0 6 11.0-12.0
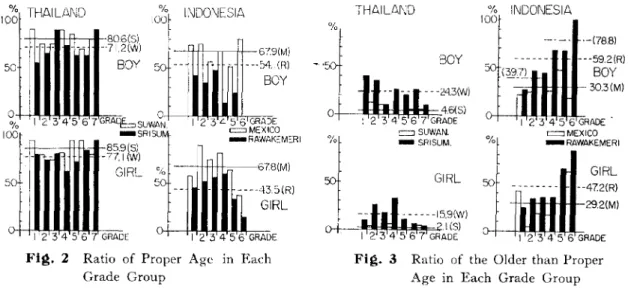
Fig. 2 shows what percent of a certain grade are of the proper age. For the Thai, 80.6% of Suwan boys and 71.2% of Srisum boys were of proper age and 85.9% of Suwan girls and 77.1 % of Srisum girls were of proper age. Thus, in Thailand, the percentages of proper age were a little larger in girls than in boys. For Indonesia, 67.9% of Mexico boys and 54.1% of Rawakemeri boys were of proper age and 67.9% of Mexico girls and 43.5% of Rawakemeri girls were of proper age. Thus, inter-sex difference was not found in the Mexico sample (urban), but in the Rawakemeri sample the percentage of proper age was larger in boys than in girls. And, in both nations, the urban were generally larger in the
0;' %
INDONESIA THAILAND % INDONESIA
100 THAILAND 100
'1:
OOY 100 806(5) '-(788) -'71.2(W)I'"'
50 BOY 5 -- - --.S~~~) ---592(R) (~}l BOY~24.3(w)
3O.3(M) 0 = . 0 o 4.6(5)% I 2 3 4 5 6 7 GRAb SUWAN I 2 3 4 5 6 GRADE I 2 3 4 5 6 7 GRADE I 23456GRADE
100 _SRISU =_ RAWAKEMERIMEXICO =SUWAN. = MEXICO
%
°1
85.9(S) - SRISUM. - RAWAKEMERI -77.1 (W) GIRL --67.8(M) GIRL 5 5 ----435(R) GIRL 50 ---~- --472(R) GIRL 292(M) I 2 3 4 5 6 7 GRADE I 2 3 4 5 6 GRADEFig. 2 Ratio of Proper Age in Each
Grade Group
Fig. 3 Ratio of the Older than Proper Age in Each Grade Group
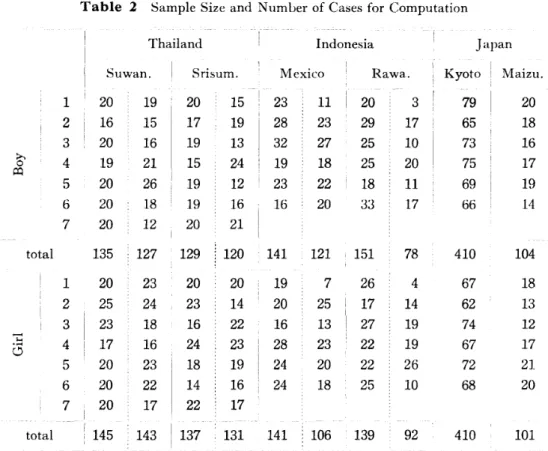
Y. MATSUURA, ct al: A Comparative Study on Physical Fitness of Children Table 2 Sample Size and NumLer of Cases for Computation
Thailand Indonesia Japan
Suwan. Srisum. Mexico Rawa. Kyoto Maizu.
1 20 19 20 15 23 11 20 3 79 20 2 16 15 17 19 28 23 29 17 65 18 3 20 16 19 13 32 27 25 10 73 16 >, 4 19 21 15 24 19 18 25 20 75 17 0 i=Q 5 20 26 19 12 23 22 18 11 69 19 6 20 18 19 16 16 20 33 17 66 14 7 20 12 20 21 total 135 127 129 : 120 141 121 151 78 410 104 1 20 23 20 20 19 7 26 4 67 18 2 25 24 23 14 20 25 17 14 62 13 3 23 18 16 22 16 13 27 19 74 12 ... 4 17 16 24 23 28 23 22 19 67 17
C3
5 20 23 18 19 24 20 22 26 72 21 6 20 22 14 16 24 18 25 10 68 20 7 20 17 22 17 total 145 143 137 131 141 106 139 92 410 101Note; The number on the left of dotted lines indicates the total numLer of children tested. The number on the right of dotted lines indicates the number of children used for the statistic analysis in this study.
percentage of proper age than the rural. This IS one of the characteristics quite different from the Japanese elementary school samples. Fig. 3 shows the percentage of children older than proper in a given grade. This was found very small in the urban sample but 24.3% for boys and 15.9~1o for girls in the suburban sample in Thailand. This percentage was found to be much larger in both samples in Indonesia, particularly in the suburban (Rawakemeri). Here Suwan and Mexico elementary schools are thought the exceptional ones to which the boys and girls of families in high socio-economic status go. Therefore, both urban samples can not be good representatives of general urban elementary school children in both countries. The same thing might be said for the suburban samples.
The sample sizes of each age group are shown in Table 2. It can be recognized that little decreases of sample size were found in Thailand and considerable decreases m Indonesia. The samples thus obtained were used for comparative analysis of data.
II Delimitation of This Study
As mentioned in the preceding section, the bias of extracted samples will restrict the generalizability of this study. Even if comparison in physical fitness among the children
of three nations were to be made in this paper, such comparative behaviors can not be ex-panded over all the children in three nations. This paper will be described with this restric-tion. The test items are not so enough to explain physical fitness as a whole. Furthermore, the items which could be used for comparison were only five physique items and grip strength, and, for comparison between the Thai and the Indonesian, standing broad jump might be added. However, these comparable items are too few to explain physical fitness as a whole. This is one of the delimitations of this paper. Another delimitation is the sample size and also the sampling technique. The sample sizes, as shown in Table 2, are very small, so the sample statistics as estimates of parameters cannot carry high precision; and the sampling technique produces statistics with a certain degree of bias. Under these restrictions, this paper will produce inferences on the comparison of children's physical fitness among three nations.
III Results (1) Stature
Fig. 4 shows the growth of boys' stature estimated from six samples. These growth processes were estimated with cross-sectional data. In the Japanese, no statistical difference between the urban and the rural was found. In the Thai some regional differences between the urban and suburban were found, that is, the urban were statistically taller than the suburban in 3rd and 6th age groups. But, in the Indonesian, the regional difference seemed to be increasing as the age grew and actually, statistical significance was found only at 6th age group. For comparison among three nations, it could be inferred that Japanese urban and rural children were taller in stature thoughout all age groups than the children of the other two nations. Then, for comparison between the Thai and the Indonesian, the Indonesian urban were taller than the Thai urban in lower age groups, but this difference disappeared as the age grew. The Indonesian urban were statistically taller than the Thai suburban in all age groups. On the other hand the Indonesian suburban did not show any statisfically significant difference from the Thai urban and suburban.
Fig. 4 also shows the growth of girls' stature. In the Japanese, regional difference was not found throughout all ages and in the Thai, such regional difference was found in lower age groups; that is, the urban were taller than the suburban. In the Indonesian, the regional difference was larger throughout all age groups than in other nations, but statistical significan-ce was found only at 6th age group. Ifcomparison is made among the three nations, the difference between the Japanese urban and the Thai urban was significant in the early 4 age groups but after the 5th age group, such difference disappeared, and the Japanese urban seemed to be not different from the Indonesion urban. The differences of Japanese rural from the Thai suburban and the Indonesian suburban were likely to be of the same tendency as the differences of Japanese urban from the Thai and the Indonesian urban. As for the comparison between the Thai and the Indonesian, all the differences between the Thai urban
Y. MATSUURA, et al: A Comparative Study on Physical Fitness of Children em 150 140 130 120 110 (BOY) - - - - RURALLJAPAN ---.. URBAN! ~SUBURBAN(SRISUM)) THAILAND A---l1URBAN(SUWANJ f 0-. _. - -0SUBURBAN(RAWA.ll1NDCX\IESIA .1--_. -..6URBAN (MEXICO)
J
AGE GROUP 1. 60- 7.5 2. 7.0-· 8.5 3. 8.0- 9.5 4. 9.0-105 5.100-11.5 6.11.0':"12.5 7.120-13.5 em 150 140 130 120 110 (GIRL) .----.RURALLJAPAN 4o---,6URBANj 0----0SUBURBAN(SRISUMJl THAILAND A---ilURBAN(SUWANJ J 0- - - . - -0SUBURBAN(RAWAJLINDONESIA £'t---ziURBAN(MEXICO)J
AGE GROUP I. 6.0- 7.5 2. 7.0- 8.5 3. 80- 95 4. 90-105 5.100-11.5 6.11.0-12.5 7. 12.0-13.5 100OT
2 t ( , 3 4 5 AGE GROUP 6 7 Fig. 4 Stature 100o
f+---l._-..L
2--3 !-'- - - - J
4L.---=5----;!:-Ei
--:7:;-' AGE GROUPand the Indonesian urban seemed to be significant, but they were not statistically significant, because of small sample size. There was no difference between the Thai suburban and the Indonesian. In the end, most differences of the Japanese from the Thai and the Indonesian were statistically significant in all age groups, except for the differences from the Indonesian urban in girls, but significant differences between the Thai and the Indonesian were not found in all age groups. In other words, it may be inferred that the Thai were not so different in stature at the elementary school level from the Indonesian.
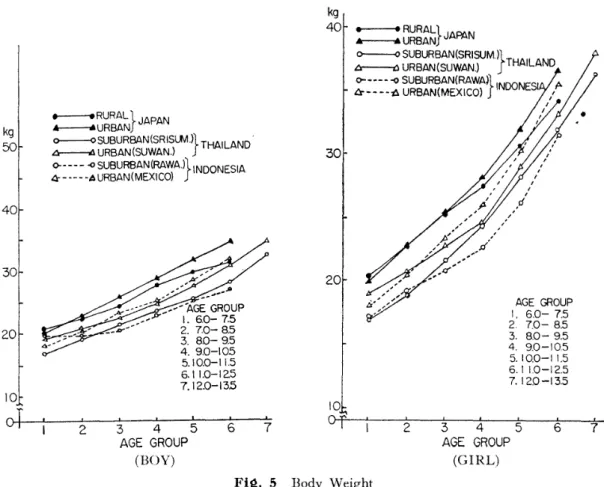
(2) Body Weight
Fig. 5 shows the growth of boys' body weight with the cross sectional data. Seemingly, throughout all age groups, Japanese children are heavier in body weight than those of the other two nations. In the Japanese, the differences between the urban and the rural were not significant in lower age groups but this difference increased as the age grew. In Thai, the differences between the urban and suburban were greater throughout all age groups than the differences observed in the Japanese, but statistically significant difference was found only at the 1st and 6th age groups. In the Indonesian, the tendency of differences between the urban and the suburban seemed to be very like the Japanese case. As for comparison among the three nations, the differences between the Japanese urban and the Thai urban were greater from the 3rd age group through 6th, and the differences between the Japanese urban and the Thai suburban were significant throughout all age groups. Then, the differences between the Japanese urban and the Indonesian urban were statistically significant
AGE GROUP I, 6.0- 7.5 2, 7,0-8,5 3. 8.0- 9.5 4. 9.0-105 5.10.0-11.5 6.11.0-12.5 7.120-13.5 :p , , , , I I
r/
/ J:f " , i f " " " kg 40 ..----. RURAL} JAPAN .ar---.lURBAN 0 - - - < )SUBURBAN(SRISUMlla----tJURBAN(SUWAN.) JTHAILAND
0--_.--0SUBURBAN(RAWMLINDONESI A t:r----i!J.URBAN(MEXICO)f " I I , , 20 30 .,,' //AGEGROUP ,.P' I. 6.0-7.5 2. 7.0- 8.5 3. 80- 9.5 4. 9.0-105 5.10.0-11.5 6, 11.0-12.5 7.12.0-135 .----.RURAL} JAPAN A---o\URBAN c::>---<>SUBURBAN(SRISUvUl THAILAND' ~URBAN (SUWAN.) J
0-- -- -~SUBURBAN (RAWA,ll INDONESIA 4---·AURBAN(MEXICO)
J
kg 50 30 40 20 10o+---JL----::-
2--:
3= - ·--74----;5~-;::6-~7
AGE GROUP (BOY) 23
.4
5
AGE GROUP (GIRL)Fi~. 5 Body Weight
at the 1st, 3rd and 5th age groups. The differences between the Japanese urban and the Indonesian suburban were significant throughout all age groups. The differences of the Japanese rural from the thai and the Indonesian tended to be just identical to the differences of Japanese urban from the Thai and the Indonesian. Then, most of the differences between the Thai and the Indonesian were statistically not significant. Therefore, it may be concluded that the Japanese boys' body weight was significantly heavier throughout all age groups than the Thai and the Indonesian, and the amounts of difference tended to increase as the age grew.
Fig. 5 shows the growth of girls' body weight. In the Japanese, the differences between the urban and rural were not significant at the lower age groups and they were increased as age grew. In the Thai, they did not always seem to be significant throughout all age groups, but they were statistically significant at the 1st and 6th age groups. In the Indonesian, the differences seemed to be greater than in the Japanese and the Thai cases, but statistical significance of difference was found only at 2nd and 6th. This may be because the variances of data were so great. The differences of the Japanese urban from the Thai urban were significant from the 3rd through 5th age groups, and the differences of Japanese urban from the Thai suburban were significant throughout all age groups.
Y. MATSUURA, et al: A Comparative Study on Physical Fitness of Children
the Thai suburban but did not seem to be significantly heavier throughout all age groups than the Thai urban. Then, the differences of the Japanese urban from the Indonesian urban were not so large except for the 2nd and 5th age groups, and those from the Indonesian suburban were significant throughout all age groups. As for the difference between the Thai and the Indonesian, most differences were not significant. Therefore, it may be inferred that the Japanese girls were likely to be heavier throughout all age groups than the Thai and the Indonesian.
(3) Chest Girth
In the Japanese, the chest girth is measured naked. In Thai and Indonesia, it is not measured naked but with a thin gym suit on. Therefore, the data obtained from the Thai and Indonesian samples were likely to overestimate their chest girth.
Fig. 6 shows the growth of boys' and girls' chest girth. Seemingly, the Japanese boys seemed to be greater in chest girth than the other nations. Incidentally, the statistical test showed that all the differences were large. But, the differences of the Thai urban from the Indonesian urban were not significant at all and those of the Thai suburban from the Indonesian suburban were significant at the lower age groups; that is, the Indonesian suburban were broader than the Thai at the lower age groups, and such difference decreased as the age grew. The differences of the Thai urban from the Indonesian suburban were not statistically large at all. T'hen, the differences of the Thai suburban from the Indonesian
____ RURAL: . - - - - . URBANrJAPAN
0 - - - - 0 SUBURBAN(SRISUM.)} THAll AND
~ URBAN (SUWAN,).
--0---0 SUBURBAN (RAWA.)~INDONESIA
t:r---f, URBAN (MEXICO) } 60 AGE GROUP 1.6.0- 7.5 2.7.0- 8.5 3. 8.0- 9.5 4.9.0-10.5 5.10.0-11.5 50 6.11.0-12.5 7.12.0-13:5 0+--+----+-1- - + 1 - - 1 - 1---+1--1-1---+-1 2 3 4 5 6 7 AGE GROUP (GIRL) - - RURAll .6----.6 URBAN! ,JAPAN
0---0 SUBURBUN (SRISUM,)lTHAILAND
tr---{:; URBAN (SUWAN,) .J
7cOm A---il0---0 SUBURBAN(RAWA.)lINDONESIAURBAN(MEXICO) ;
7 6 AGE GROUP I. 6.0- 7.5 2.7.0- 8.5 3.8.0- 9.5 4. 9.0-10.5 5.10.0-11.5 6.11.0-12.5 7.12.0-13.5 I I I 3 4 5 AGE GROUP (BOY) 2 55 50
oT
65 cm 70 60 Fi11. 6 Chest Girthurban were significant throughout all age groups; that is, the Indonesian urban were broader than the Thai suburban. In general, the Thai urban seemed to be superior to the Thai suburban but the statistical significance was found at 1st, 3rd and 5th age groups.
The Indonesian urban seemed to be superior to the Indonesian suburban at the upper age groups, that is, statistical significance was found at upper age groups. These interpreta-tions seemed to be nearly identical for the girls' case, too. However, the differences of Japanese from the Thai and the Indonesian were not so great as in the boys' case.
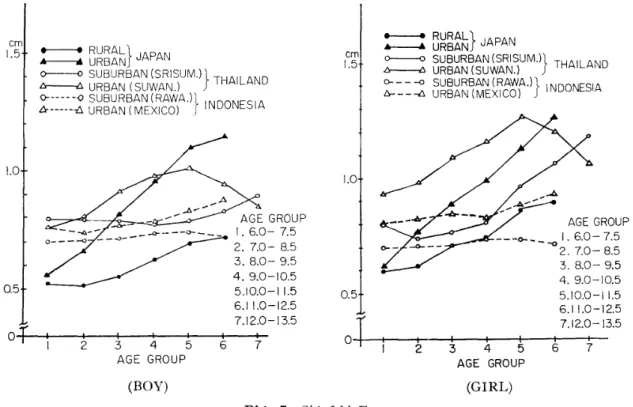
(4) Skinfold Fat
Fig. 7 shows the growth of boys' and girls' skinfold fat, respectively. In the Japanese, the differences between the urban and the rural were very significant throughout all age groups except for the 1st age group, for both sexes; that is, the urban were much fatter than the rural. In the Thai and the Indonesian boys, such large differences could not be found throughout all age groups between the urban and the suburban. In the Thai boys, the differences were significant only at 4th and 5th age groups. In the Thai girls, the significant differences were found from 3rd through 5th age groups, but, in the Indonesian girls, the differences were not significant at all. The regional differences seemed to be greater in the Japanese than in the Thai and the Indonesian.
As for comparison among the boys of the three nations, the Japanese urban had significantly less skinfold fat than the Thai urban at the 1st and 2nd age groups, but were significantly fatter than the Thai suburban from 4th through 6th age groups, and fatter than
.----. RURAL} JAPAN .tr----"i UR BA N
~ SUBURBAN (SRISUM.)} THAILAND
t:r---l:>.URBAN (SUWAN,)
0---0SUBURBAN (RAWA.l1 INDONESIA
D---~URBAN (MEXICO) J
- - RURAL} JAPAN
~ URBAN
0----<> SUBURBAN (SRI SUM.)} THAILAND
~ URBAN (SUWAN.)
0- - - --<:J SUBURBAN (RAWA.)} INDONESIA
6---<::. URBAN (MEXICO) AGE GROUP ---o-~--o 1.6.0-7.5 2. 7.0- 8.5 3.8.0- 9.5 4.9.0-10.5 5.10.0-11.5 6.11.0-12.5
r
7.12.0-13.5 O+-t--t-I--+-1- - + 1--+1 + 1 + 1 -2 3 4 5 6 7 AGE GROUP em 1.5 1.0 0.5 lI. AGE GROUP 1.6.0- 7.5 2.7.0- 8.5 3.8.0- 9.5 4.9.0-10.5 5.10.0-11.5 6.11.0-12.5 7.12.0-13.5 I I 6 7 I I 1 3 4 5 AGE GROUP 2oT
em 1.5 1.0 0.5 (BOY) (GIRL)Y. MATSUURA, et at: A Comparative Study on Physical Fitness of Children
the Indonesian urban from 5th and 6th age groups, and also fatter than the Indonesian suburban from 2nd through 6th age groups. The Thai urban were fatter than the Indonesian urban only at 5th age group, but fatter than the Indonesian suburban from the 2nd through 6th age groups. Also, the Thai suburban were fatter than the Indonesian suburban at the 2nd through 6th age groups. Therefore, the Thai urban boys seemed to be fatter than the boys of other nations and the Japanese rural seemed to be less fat than others.
As for comparison among the girls of three nations, the Thai urban seemed to be fattest and the difference between the Japanese urban and the Thai urban became less as age grew; that is, the differences were significant at 1st through 4th age groups and thereafter it became insignificant. The Indonesian urban were fatter than the Japanese urban at 1st and 2nd age groups but at 5th and 6th, they were inverted; that is, the Japanese urban were fatter than the Indonesian urban at the upper age groups. Then, the Thai urban were fatter than the Indonesian urban and suburban at 2nd through 6th age groups. Therefore, the Thai urban girls seemed to be fattest and Japanese rural and the Indonesian suburban were least fat.
In the Japanese boys and girls, a constant growth was found with increasing age but it was not found in the Thai and the Indonesian; there were a variant tendency in the Indonesian and a plateau pattern in the Thai urban. In general, the Japanese boys and girls were taller in stature, heavier in body weight and broader in chest girth but less fat. It
may be inferred from these comparative estimations that the Japanese children seemed to have more active tissue in their bodies than the others and the Thai urban seemed to have more inactive tissue in their bodies.
(5) Upper Arm Girth
Fig. 8 shows the growth of upper arm girth in boys and girls, respectively. In the Japanese boys and girls, no significant difference between the urban and the rural was found in any age group but the 6th. In the Thai boys and girls, no significant difference was found at all between the urban and rural. In the Indonesian boys, a certain degree of difference was found at 1st, 4th and 6th age groups; the urban were larger than the suburban but in the Indonesian girls, no significant difference was found at all. As for comparison among the three nations, all the differences of the Japanese urban from the Thai urban and suburban were statistically significant; the Japanese urban were larger in upper arm girth than the Thai urban and suburban, and the differences of Japanese urban from the Indonesian urban were significant at 1st through 3rd and 5th age groups but not significant at 4th and 6th age groups. However, the Japanese urban seemed to be larger than the Indonesian urban throughout all age groups. The differences of Japanese urban from the Indonesian suburban were significant at 2nd through 6th age groups; the Japanese were larger than the Indonesian suburban at 2nd through 6th age groups. The differences of Japanese rural from the other nations' urban and suburban appeared nearly identical with those of Japanese urban from the others.
em
25
- - RURAL} JAPAN
.A---oA URBAN
0---0 SUBURBAN (SRISUM.ll THAll AND
f":r---b. URBAN (SUWAN.) J -0 - - - -0 SUBURBAN (RAWA.)} £'r--....6 URBA~j(MEXICO) INDONESIA em 25 - - RURALI A----.&URBAN
J
JAPAN0 - - - 0 SUBURBAN (SRISUM.l.} THAILAND
ts----t::. URBAN (SUWAN.l
0 - - - 0 SUBURBAN(RAWA.)~ INDONESIA
1'r----t>URBAN(MEX:CO) I 7 AGE GROUP 1.6.0- 7.5 2.7.0- 8.5 3.8.0- 9.5 4.9.0-10.5 5.10.0-11.5 6.11.0-12.5 7.12.0-13.5 (CIRL) I I I I 3 4 5 6 AGE GROUP 2 I.
oT
15 20 ....~///~~//~O
. .-N ~,IX'./ o .... / ' AGE GROUP
... // ../ I. 6.0- 7.5 0 ..._ - 2. 7.0- 8.5 3. 8.0- 9.5 4.9.0-10.5 5.10.0-11.5 6.11.0-12.5
+
7.12.0-13.5o
-+---"'I---l-I-~':---!I~--:t-I- - t -I 2 3 4 5 6 7 AGE GROUP (HOY) 15 20Fi~. 8 Upper Arm Girth
Therefore, it may be inferred that the Japanese boys were larger in upper arm girth than the boys of the other nations. The differences of the Thai urban from the Indonesian urban were not significant in all age groups except 5th age group, and those of the Thai suburban from the Indonesian suburban were significant at 1st and 6th age group; the Indonesian urban were significantly larger than the Thai at 1st and 6th. Therefore, the Thai were not so different statistically from the Indonesian, but it may be estimated that the Indonesian might be larger than the Thai, because some differences were statistically significant. As for girls, the tendencies seemed to be mostly the same as in the boys' case. The differences of the Japanese from the Thai were statistically significant throughout all age groups and those from the Indonesian suburban were the same but those from the Indonesian urban were statistically significant at 2nd through 4th age groups. Thus, the Japanese girls were larger in upper arm girth than the other nations' girls. The differences of the Thai urban from the Indonesian were not statistically significant throughout all age groups but those of the Thai suburban from the Indonesian urban were statistically significant at 2nd, 4th and 6th age groups and those from the Indonesian suburban were not statistically significant at all. In the end, it can be inferred that the Japanese children were larger in upper arm girth than the other nations' children and the Indonesian urban were likely to be larger than the Thai, though significant differences were not always found.
Y. MATSUURA, et at: A Comparative Study on Physical Fitness of Children
cm 90
- - - RURALl
~ URBANI JAPAN
0 - - - - 0 SUBURBAN (SRISUM.)} THAI LAND
Lr~URBAN (SUWAN.l
0---0 SUBURBAN (RAWA.J} INDONESIA
lr----c. URBAN(MEXICO)
em 90
- - - - . RURAL}
Ir----.l URBAN JAPAN
<>---0 SUBURBAN (SRISUM.J} THAILAND
~ URBAN (SUWAN.l
O---Q SUBURBAN (RAWA.l}
tr----tl URBAN (MEXICO) INDONESIA
70 80 AGE GROUP I. 6.0- 7.5 2.7.0- 8.5 3. 8.0- 9.5 4.9.0-10.5 5.10.0-11.5 50 6.11.0- 12.5 7.12.0-13.5 O+-l---+-I- ..., - ...I-~I--!-I--±I~ 2 3 4 5 6 7 AGE GROUP (GIRL) 60 AGE GROUP 1.6.0- 7.5 2,7.0- 8.5 3.8.0'- 9.5 4.9.0-10.5 5.10.0-11.5 6.11.0-12.5 7.12.0-13.5 1 I I I 3 4 5 6 AGE GROUP (BOY) 2 50
oT
70 60 80Fig. 9 Leg Length
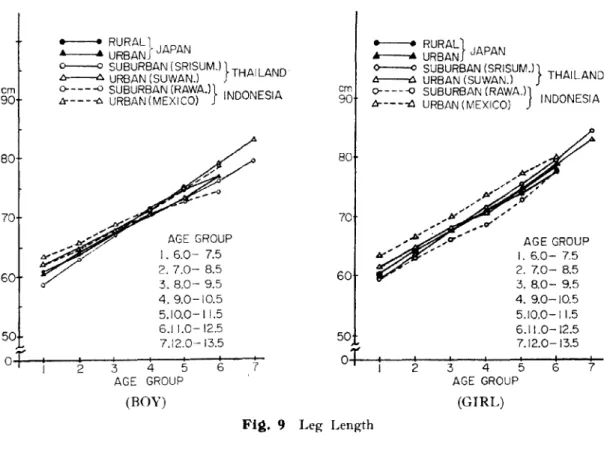
(6) Leg Length
Fig. 9 shows the growth of leg length. In the Japanese boys, the differences between the urban and the rural were not large throughout all age groups and nearly the same trend of regional difference seemed to be found in the Thai and Indonesian boys. As for comparison among three nations, no differences were statistically significant between the Japanese and the Thai; the Japanese appeared nearly equal in leg length to the Thai. But the difference of Japanese boys from the Indonesian urban were statistically large at 1'3t, 2nd, 4th and 6th; here the Indonesian urban were longer in leg length than the Japanese boys. As mentioned in (1) stature, the Japanese boys were taller in general than the others, but they were equal to or shorter in leg length than the others, so it may be estimated that the proportion of leg length to stature is less in the Japanese boys than in the Thai and Indonesian boys.
The differences between the Thai boys and the Indonesian were not statistically large except at 6th (between the Thai urban and the Indonesian suburban) and at 1st, 2nd and 6th (between the Thai suburban and the Indonesian urban). The Thai urban seemed to be nearly equal in leg length to the Indonesian but the Indonesian urban seemed to be longer than the Thai suburban. As for the girls' case, seemingly, the Indonesian urban were longest in leg length. But the differences of the Indonesian were statistically significant at 4th and 5th from the Japanese urban, at 2nd, 4th and 5th from the Japanese rural, at 5th from the Thai urban and at 2nd from the Thai suburban; so it may be inferred that the Indonesian urban were longer in leg length than the Japanese but not always longer than the Thai. The
o ~0:: 0.60 RURAL}JAPAN URBAN SUBURBAN (SRISUM')}THAILAND URBAN (SUWAN.) SUBURBAN(RAWAJ} INDONESIA URBAN (MEXICO) o ~ <r 0:: 0.60 ....---. RURAL} JAPAN ..----... URBAN 0----0SUBURBAN(SRISLJM')}THAILAND ~ URBAN (SUWAN.)
o---{) SUBURBAN (R.AWA.)} INDONESIA
t:r----t:., URBAN(MEXICO) 7 6 I I I 3 4 5 AGE GROUP ...,,~.... AGE GROUP ~~- I. 6.0- 7.5 2. 7.0~8.5 3.8.0~ 9.5 4.9.0-10.5 5.10.0-11.5 6.11.0-12.5 1.12.0-13.5 2 0.50
oT
0.55 7 AGE GROUP I. 6.0- 7.5 2.7.0-8.5 3.8.0- 9.5 4. 9.0-10.5 5.10.0-11.5 6.11.0-12.5 7.12.0-13.5 I I 1 I 3 4 5 6 AGE GROUP 2 0.55 0.50oT
(BOY) (GIRL)Fig. 10 Leg Length Ratio (leg length/stature)
differences of the Japanese from the Thai were not statistically large throughout all ages, and the difference of the Thai from the Indonesian suburban were not statistically large for age groups outside the Thai suburban at 4th and 5th (the Thai suburban were longer at 4th and 5th age groups than the Indonesian suburban). Therefore, although not speaking generally, the proportion of leg length to stature seemed to be largest in the Indonesian urban. In-cidentally, this may be seen in Fig. 10.
(7) Muscular Strength
Fig. 11 shows the development of grip strength as one of the indices indicating muscular strength. Muscular strength measured by grip strength is a so-called static dynamometric strength, so grip strength does not mean muscular strength as a whole. In the Japanese boys, the differences between the urban and rural were not statistically significant except at 6th age group where the rural were superior to the urban. In the Thai boys, such regional differences were statistically significant at 1st and 4th through 6th age groups where the
urban were significantly superior to the suburban. In the Indonesian boys, the urban were superior to the suburban only at 6th age group. Therefore, the regional differences were not so significant in the Japanese and the Indonesian, but were significant in the Thai. As for comparison among the three nations, except for the 6th age group, Japanese boys in general appear stronger than Thai urban boys; the difference was statistically significant at 2nd and 3rd. The Japanese boys were statistically superior to the Indonesian at the 1st through 3rd and 5th age groups. In the comparison of Japanese urban to the Thai suburban, the differences
Y. MATSUURA, et at; A Comparative Study on Physical Fitness of Children
kg 20
...--.. RURAL}
4----.4 URBAN JAPAN
0 - - - 0SUBURBAN (SRISUM.)} THAILAND
t:r----A URBAN (SUWAN.l
0- -;.--0 SU.BURBAN. (RAWA.)} INDONESIA
4--- --t::J. URBAN (MEXICO) kg
20
. - RURAL} ..----.. URBAN JAPAN
0----<> SUBURBAN (SRISUM.l} THAILAND
tr--.::\ URBAN (SUWANJ
0---0 SUBURBAN (RAWAJ}
4---liClURBAN(MEXICO) INDONESIA
O+---I----+--+---I~-I__-t__--l-- 7 5 AGE GROUP 1.6.0- 7.5 2. 7.0- 8.5 3.8.0- 9.5 4.9.0-10.5 5.10.0-11.5 6.11.0-12.5 7.12.0-13.0 O+-~--:----+:-_--+---t---o_ 2 3 4 5 6 AGE GROUP 10 15 7 AGE GROUP 1.6.0- 7.5 2.7.0- 8.5 3.8.0- 9.5 4.9.0-10.5 5.10.0-11.5 6.11.0-12.5 7.12.0-13.5 3 4 5 6 AGE GROUP 2 5 10 15 (BOY) (GIRL)
Fig. 11 Grip Strength (average of both hands)
were statistically significant at all age groups and those from the Indonesian suburban were statistically significant at 2nd, 4th and 6th age groups.
Thus, in general, the Japanese urban boys were superior to the Thai suburban and the Indonesian at most age groups. The differences of Japanese rural boys from the Thai and the Indonesian boys were nearly identical to those of Japanese urban boys from the latter two as described in the preceding. As for comparison between the Thai boys and the Indonesian, the differences were large at 1st and 5th between the Thai urban and the Indonesian urban, and not statistically significant at all between the Thai suburban and the Indonesian. As for the girls the regional differences were not statistically significant at all in the Japanese. However, in the Thai, they were statistically significant at 3rd, 5th and 6th; the urban were superior to the suburban at these age groups. In the Indonesian, they were statistically significant at 3rd through 6th age groups; the urban were superior to the suburban. There-fore, the regional differences were more significant in the Thai and the Indonesian than in the Japanese. The differences of the Japanese from the Thai were statistically significant at 1st through 5th between each urban sample and also significant throughout all age groups between each suburban sample as well as between the Japanese urban and the Thai suburban; the Japanese urban girls were superior to the Thai girls. The differences of Japanese rural girls from the Thai tended to be nearly identical with those of the Japanese urban from the Thai. Therefore, the Japanese girls were superior in grip strength to the Thai girls. Then, the differences of Japanese girls from the Indonesian urban and
suburban were statistically significant throughout all age groups except 6th age group. It may be inferred that the Japanese girls were superior to the Indonesian girls.
No difference of the Thai urban girls from the Indonesian urban was found but the differences from the Indonesian suburban were statistically significant at 3rd, 5th and 6th age groups; the Thai were significantly superior to the Indonesian suburban. No difference between the Thai suburban and the Indonesian suburban was statistically significant at all. Thus, it may be concluded that the Japanese boys and girls were generally superior in muscular strength to the Thai and the Indonesian, as far as strength is measured by grip strength.
(8) Motor Fitness
50 m dash and/or 40 m dash as the test for body movement speed and power, and standing broad jump as the test for leg power were performed in Thailand and Indonesia. However, the test situation used for each sample was quite different from those used in Japan, so the statistical test on the differences between calculated averages in the three nations did not give any meaningful interpretations on comparisons of such abilities. Side step as a test for agility was administered unsuccessfully. The testers tried to get the children to understand how to perform the test activity but most of children could not follow the testers' directions. The children just tried side step correctly without any intention to make behavior as rapidly as possible. Sometimes they performed side step rhythmically to make it correctly, so their scores were quite fewer than the scores of the Japanese. In any case, their average scores are as follows (Table 3). As seen from Table 3, the Thai and the Indonesian performances were not comparable with the Japanese ones.
Table 3 Scores of Side Step
Boy Sample Japanese urban rural Thai urban suburban Indonesia urban suburban 1 11.63 11. 20 12.64 15.33 2 3 4 5 6 34. 7 42.3 41. 7 36.9 38.9 33.1 41.1 43.0 33. 7 38.2 11.47 16.19 18.29 21. 35 18.89 10.05 16.92 20.46 19.67 22.81 15.30 16. 70 17.06 20.55 24.50 15.47 19.00 21. 45 22.09 22.00 7 17.00 21. 29
Chinning (flexed arm hang) as an test measuring muscular endurance was carried out III the Thai in a questionable way because we could not obtain any regular horizontal bar. Therefore, it would make no sense to make statistical tests on differences of their means and to interpret them.
Then, the investigations on their nutritional status are summarized as follows;
V. MATSUURA, l't al: A Comparative Study on Physical Fitness of Children
Table 4 Percent Incidence of Seven Clinical Signs
THAILAND INDONESIA
urban suburban male female urban suburban male female
number of pupils examined 200 298 244 254 272 288 279 281
anemIa 7.5 5.4 9.0 3.5* 5.9 10.0 9.7 6.4
edema 0.5 0.4 ! 0.4 0.4
diminished turgor 3.5 4.0 4.9 2.8 0.3 0.4
angulitis 1.0 1.0 1.6 0.4 0.4 1.4 1.1 0.7
enlargement of the liver 5.5 2.3 4.5 2.8
accentuation of second 15.5 18.4 12.7 21. 6 10.6 17.3 12.9 15.3 pulmonic sound k . k augmented 9.5 5.0 6.6 7. 1 18.3 13.9 20.4 11. 7 nee Jer 7.0 26.7 14. 7 18.8 diminished 10.5 7.7 5.3 12.2 accentuation of second
pulmonic sound with 2.0 1.7 1.2 2.4 1.1 4.5* 2.9 2.8
diminished knee jerk
*statistically significant
incidence was statistically higher in boys than in girls in Thailand. However, no definitely anemic case was found.
(2) There were a small number of slightly edematous children but no moderately nor severely edematous were found. In respect to diminished turgor, angulitis or enlargement of the liver almost the same results were obtained.
(3) Although the accentuation of second pulmonic sound and diminished knee jerk could be rather frequently detected, it is usually difficult to differentiate the slightly accentuated second pulmonic sound from the physiologic one as well as to correctly elicit knee jerk. Nevertheless, if both signs are positive in a given case, a diagnosis of thiamine deficiency becomes much more probable. According to this criterion there were a few cases with both signs in all samples. Particularly, the incidence of such cases was statistically higher in suburban samples than in urban samples in Indonesia. It may be inferred that there were a small number of thiamine deficient children in these two countries.
IV
Conclusions and Discussions
Although some selected items of physical fitness tests were intended to be administered to six samples of elementary school children in Japan, Thailand and Indonesia in order to compare the physical fitness among the three nations, five physique items (stature, body weight, leg length, upper arm girth and skinfold fat) and muscular strength (grip strength) . were successfully administered but the others were not. From comparison of physique, the Japanese boys and girls were taller, heavier in general than the Thai and the Indonesian, but considerable difference was not found in skinfold fat and leg length among the three
nations. In general, the Thai urban girls seemed to be fatter at lower age groups than the others and the Japanese rural and the Indonesian suburban seemed to be less fat than the other. Among boys, the Japanese rural seemed to be least fat.
Comparing leg length with stature, the Japanese boy and girl seemed to be smallest in ratio of leg length to stature. As for upper arm girth, the Japanese seemed to be largest, so the Japanese were likely to be better in nutritional status than the others, although the upper arm girth is a weak index concerning the nutritional status. In grip strength as the only comparable physical function test, the Japanese seemed to be superior to the others. Other performance test items, such as 50 or 40 m dash, standing broad jump, side step and chinnings were not administered so objectively because of lack of facilities and of childrens' familiarities. Thus, it was thought no sense to compare their scores.
During this study expedition, it seemed to be very hard to estimate motor ability or physical fitness with performance tests particularly for children of elementary school, even if very popular performance tests in Japan were used to test them. In order to obtain some comparable data for physical fitness as a whole, some time for children to learn how to perform the test activities is needed. This was the first attempt to administer such performance tests to the Thai and the Indonesian children, so this study should be recognized as a pilot survey for comparative study of physical fitness.
As for their nutritional status, no definite case of undernutrition could be found in any sample, judged from the limited items of physical examinations. In order to induce the conclusions more exactly, biochemical examination should have been carried out in combina-tion with the physical ones to elucidate the nutricombina-tional status in detail. In addicombina-tion, it would be fruitful to make a survey of weanling infants who are most susceptible to nutritional deficiency.
Finally, this study could not have been carried out without the cooperative work of all staffs of the Department of Physical Education Promotion headed by Dr. Booncher Suvarna-briksha in Thailand, and all staffs of the Research Institute of Physical Fitness headed by Dr. Basnan Said in Indonesia. Now, we sincerely show our heartful acknowledgement for their kind cooperation.
References
1) Y. Ohyama, 1973. "Report on the physique of youth in Thailand and Indonesia," Southeast Asian'
Studies, Vol. XI, No.1, pp. 148-163.
2) Y. Tamura, Y. Matsuura, Y. Ohyama, T. Vagi, E. Nakamura, et aI, 1973. "A study of growth and development of physical fitness in factor space: On the growth and development of physical fitness of elementary children in urban and rural areas," Research Journal of Physical Education, Vol. 17, No.5, pp. 287-296.