Constitution:Democratization and Its Impact on
Political Institutions in Indonesia
著者
川村 晃一
権利
Copyrights 日本貿易振興機構(ジェトロ)アジア
経済研究所 / Institute of Developing
Economies, Japan External Trade Organization
(IDE-JETRO) http://www.ide.go.jp
journal or
publication title
IDE Research Paper
volume
3
year
2003-09
Transformation of the Financial Sector in Indonesia
Miki HAMADA
Institute of Developing Economies (IDE-JETRO)
Transformation of the Financial Sector in Indonesia
1Miki Hamada
Introduction
The source and deployment of finance are central issues in economic development. Since 1966, when the Soeharto Administration was inaugurated, Indonesian economic development has relied on funds in the form of aid from international organizations and foreign countries. After the 1990s, a further abundant inflow of capital sustained a rapid economic development. Foreign funding was the basis of Indonesian economic growth. This paper will describe the mechanism for allocating funds in the Indonesian economy. It will identify the problems this mechanism generated in the Indonesian experience, and it will attempt to explain why there was a collapse of the financial system in the wake of the Asian Currency Crisis of 1997.
History of the Indonesian Financial system
The year 1966 saw the emergence of commercial banks in Indonesia. It can be said that before 1966 a financial system hardly existed, a fact commonly attributed to economic disruptions like the consecutive runs of fiscal deficit and hyperinflation under the Soekarno Administration. After 1996, with the inauguration of Soeharto, a regulatory system of financial legislation, e.g. central banking law and banking regulation, was introduced and implemented, and the banking sector that is the basis of the current financial system in Indonesia was built up.
The Indonesian financial structure was significantly altered at the first financial reform of 1983. Between 1966 and 1982, the banking sector consisted of Bank Indonesia (the Central Bank) and the state-owned banks. There was also a system for distributing the abundant public revenue derived from the soaring oil price of the 1970s. The public-finance distribution function, incorporated in Indonesian financial system, changed after the successive financial reforms of 1983 and 1988, when there was a move away from the
1
monopoly-market style dominated by state-owned banks (which was a system of public-finance distribution that operated at the discretion of the government) towards a modern market mechanism.
The five phases of development
The Indonesian financial system developed in five phases between 1966 and the present time. The first period (1966-72) was its formative period, the second (1973-82) its policy-based finance period under soaring oil prices, the third (1983-91) its financial-reform period, the fourth (1992-97) its period of expansion, and the fifth (1998-) its period of financial restructuring.
The first section of this paper summarizes the financial policies operative during each of the periods identified above. In the second section changes to the financial sector in response to policies are examined, and an analysis of these changes shows that an important development of the financial sector occurred during the financial reform period. In the third section the focus of analysis shifts from the general financial sector to particular commercial banks’ performances. In the third section changes in commercial banks’ lending and fund-raising behaviour after the 1990s are analysed by comparing several banking groups in terms of their ownership and foundation time. The last section summarizes the foregoing analyses and examines the problems that remain in the Indonesian financial sector, which is still undergoing restructuring.
1. Transition of Policies in the Indonesian Financial Sector
Characteristics of the Indonesian Financial Sector
Before examining its specific policies, it is appropriate to outline the characteristics of the Indonesian financial sector: The Indonesian financial sector had been a financial system dominated by banking intermediation, or indirect finance. The volume of the Indonesian capital market continues to be very small, carrying around 200 listed companies. And these companies are not necessarily parallel with Indonesian representative companies.
Until the 1980s state-owned banks dominated the banking sector. The financial system was able to utilize the abundant funds provided by foreign aid and derived from the soaring oil prices of the 1970s. In contrast, the fall in oil prices after the 1980s reduced government revenue and caused the economy to become stagnant. In an effort to correct this, the Indonesian government cut expenditure, borrowed from private banks, floated bonds on the Euro market and took loans from the World Bank and the International Monetary Fund (IMF), and implemented two sets of comprehensive and radical financial reforms as part of its structural adjustment policy.
The liberalization of the capital account in 1970, preceding the financial reforms of the 1980s, is a fact worthy of mention. Generally, liberalization of the capital account comes last in a sequence of liberalizing moves. However, Indonesia opened its capital account very early in that sequence. The Indonesian financial sector is experiencing much more serious and acute financial problems in the wake of the Asian currency crisis of 1997 than are other countries, such as Thailand and Korea that suffered from the crisis. Those problems are most evident in the deep depreciation of the home currency (the rupiah), in the huge external debts, in the huge amount of non-performing loans, and in the enormous net capital deficiency of almost all banks.
1-1. Formative period of Financial Structure, 1966-72
The Indonesian economic system was largely transformed by the administrational change from Soekarno to Soeharto. After Soeharto, the administration put an end to hyperinflation and economic disorder, and it achieved the restoration of Indonesia to the international community. This period, 1966 to 1972, during which the process of the development of the economic system and the financial framework of Indonesia became subject to systematic scrutiny, is considered to mark the emergence of a financial structure. During that time, the Indonesian government tried to slough off the directed economic system of the Soekarno era. The government reinstated itself as a member of IMF and World Bank took measures to achieve economic stabilization by resolving the balance-of-payment crisis in accordance with the IMF’s and the World Bank’s guidance. The specific measures were: introduction of the discipline ‘balanced budget’, export promotion, utilization of foreign aid for development expenditure, open-door policy to
foreign capital, adjustment of foreign exchange rate to proper rate, removal of foreign exchange controls.
The most significant policy was the introduction of the discipline of balanced budget. At the end of the Soekarno era, inflation was terribly high: 95% in 1961, 129% in 1963, and 594% in 1965. Low economic growth and continuous fiscal-deficit expansion put the government on an inflation-finance footing. This resulted in hyperinflation (Mihira, 1995:195). The Balanced Budget Policy was introduced in order to reduce the high inflation rate to normal rate and to reduce the huge fiscal deficit.
`Balanced budget’, however, means only that total revenue and expenditure are balanced. Foreign aid was treated as a part of revenue, (‘development revenue’). That is, all foreign aid or development revenue was allotted to government investment or development expenditure. In short, the differences between `current revenue’ and `total amount expenditure’ were compensated for by foreign aid. This ‘balanced budget’ scheme became available after Indonesia’s return to IMF membership. Thanks to that return, Indonesia could use the stand-by credit of the IMF. At the same time, the government was guided to undertake to keep fiscal deficit under 10 % of revenue. Thus the government was able to achieve a balanced budget without central-bank finance and to revive its economy with foreign aid.
Structure of the financial sector
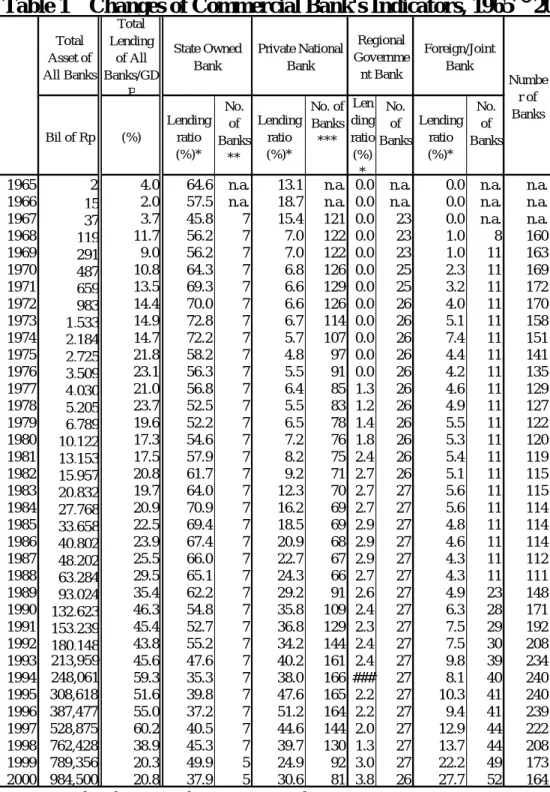
The Indonesian financial sector was composed of the commercial-bank sector, the non commercial-bank sector and the non bank sector. The commercial bank sector included the commercial banks, the development banks, and the savings banks. The non-commercial bank sector consisted of Bank Perkreditan Rakyat [BPR]. BPR included the rural bank (the `rice and paddy bank’), the rural credit bank [LDKP], the non-rural bank (market bank, employee bank, the rural production bank [BKPD]), and the new BPR. The non-bank sector consisted of pawnshops and the insurance company, Arisan (rural informal saving scheme). As of 1968, there were 160 banks in the commercial-bank sector: five state-owned banks, one state-owned development bank, one state-owned saving bank, 23 regional government-development banks, 122 private commercial banks and 8 foreign banks (Table-1).
Loans and financial scale
Bank Indonesia’s credits accounted for 30% of the commercial banks’ total loans, and the state-owned banks’ for 60%. Private commercial banks, which number was over 120, accounted for less than 10%. While rural banks and state-owned pawnshops also supplied credit as non-commercial and non-bank institutions, the total amount of their credit was less that 2.5% of total lending. In that period state-owned banks dominated the Indonesian financial sector. However, 40% of state owned banks’ lending was financed by the Central Bank. Consequently, Indonesian commercial bank lending relied heavily on Central Bank funds.
Money supply (M2) accounted for 7.1% of GDP in 1966 and increased to 12.5% in 1971. The total amount of commercial bank loans, including the Central Bank’s loans to commercial banks, was 6.3 billion rupiah in 1966, which was just 2% of GDP. In 1971 it increased to 495.3 billion rupiah and 13.5% of GDP. This development was caused by government efforts to collect savings money by curbing the high inflation rate. When the government introduced saving deposit and time deposit schemes in October 1968, banks were able to utilize the funds of the new deposits as additional funds.
Savings schemes
In 1969 the government introduced new savings schemes continuously. That was a pilot project of savings certificates similar to lottery2. Only some limited banks were allowed to introduce this scheme, in which the depositor bought certificates for their value or paid for them in installments. The government guaranteed both. Every month there was a draw, and holders of certificates received winning ticket for the amount of their face value, while banks had to pay an amount equivalent to one percent of their turnover to the government.
2
As of 1 March 1971, the monthly interest rate on certificates of deposit was 1.25% for 3 months, 1.75% for 6 months and 2.25% for 12 months.
Table 1 Changes of Commercial Bank's Indicators, 1965∼20
Total Asset of All Banks Total Lending of All Banks/GD P Bil of Rp (%) Lending ratio (%)* No. of Banks ** Lending ratio (%)* No. of Banks *** Len ding ratio (%) * No. of Banks Lending ratio (%)* No. of Banks 1965 2 4.0 64.6 n.a. 13.1 n.a. 0.0 n.a. 0.0 n.a. n.a. 1966 15 2.0 57.5 n.a. 18.7 n.a. 0.0 n.a. 0.0 n.a. n.a. 1967 37 3.7 45.8 7 15.4 121 0.0 23 0.0 n.a. n.a. 1968 119 11.7 56.2 7 7.0 122 0.0 23 1.0 8 160 1969 291 9.0 56.2 7 7.0 122 0.0 23 1.0 11 163 1970 487 10.8 64.3 7 6.8 126 0.0 25 2.3 11 169 1971 659 13.5 69.3 7 6.6 129 0.0 25 3.2 11 172 1972 983 14.4 70.0 7 6.6 126 0.0 26 4.0 11 170 1973 1,533 14.9 72.8 7 6.7 114 0.0 26 5.1 11 158 1974 2,184 14.7 72.2 7 5.7 107 0.0 26 7.4 11 151 1975 2,725 21.8 58.2 7 4.8 97 0.0 26 4.4 11 141 1976 3,509 23.1 56.3 7 5.5 91 0.0 26 4.2 11 135 1977 4,030 21.0 56.8 7 6.4 85 1.3 26 4.6 11 129 1978 5,205 23.7 52.5 7 5.5 83 1.2 26 4.9 11 127 1979 6,789 19.6 52.2 7 6.5 78 1.4 26 5.5 11 122 1980 10,122 17.3 54.6 7 7.2 76 1.8 26 5.3 11 120 1981 13,153 17.5 57.9 7 8.2 75 2.4 26 5.4 11 119 1982 15,957 20.8 61.7 7 9.2 71 2.7 26 5.1 11 115 1983 20,832 19.7 64.0 7 12.3 70 2.7 27 5.6 11 115 1984 27,768 20.9 70.9 7 16.2 69 2.7 27 5.6 11 114 1985 33,658 22.5 69.4 7 18.5 69 2.9 27 4.8 11 114 1986 40,802 23.9 67.4 7 20.9 68 2.9 27 4.6 11 114 1987 48,202 25.5 66.0 7 22.7 67 2.9 27 4.3 11 112 1988 63,284 29.5 65.1 7 24.3 66 2.7 27 4.3 11 111 1989 93,024 35.4 62.2 7 29.2 91 2.6 27 4.9 23 148 1990 132,623 46.3 54.8 7 35.8 109 2.4 27 6.3 28 171 1991 153,239 45.4 52.7 7 36.8 129 2.3 27 7.5 29 192 1992 180,148 43.8 55.2 7 34.2 144 2.4 27 7.5 30 208 1993 213,959 45.6 47.6 7 40.2 161 2.4 27 9.8 39 234 1994 248,061 59.3 35.3 7 38.0 166 ### 27 8.1 40 240 1995 308,618 51.6 39.8 7 47.6 165 2.2 27 10.3 41 240 1996 387,477 55.0 37.2 7 51.2 164 2.2 27 9.4 41 239 1997 528,875 60.2 40.5 7 44.6 144 2.0 27 12.9 44 222 1998 762,428 38.9 45.3 7 39.7 130 1.3 27 13.7 44 208 1999 789,356 20.3 49.9 5 24.9 92 3.0 27 22.2 49 173 2000 984,500 20.8 37.9 5 30.6 81 3.8 26 27.7 52 164Source : Bank Indonesia, Indonesian Financial Statistics , various issues.
Note**: Including one private development bank and two private saving banks. Note***: Including one state development bank and one state saving bank.
Numbe r of Banks
Note*: Ratio of each banks' lending amount to all commercial banks' total lending. Difference between sum of percentage in the above table and 100% is equivalent to the central bank lending.
State Owned Bank Private National Bank Regional Governme nt Bank Foreign/Joint Bank
In August 1971 the saving scheme was taken over by National Development Saving, Tabungan Pembangnan Nasional [Tabanas] and Time Insurance Saving, Tabungan Asuransi Berjangka [Tsaka]. Tabanas offered an 18%3 annual interest rate. Depositors were in line for winning the `lottery’, of which the first prize was 10,000 rupiah per bank-balanced of 1,000 rupiah. The draw happened once every half-year.
Taska was an insurance deposit sponsored by banks and insurance companies. Members put a certain amount of money in the bank – a minimum of 100 rupiah. In case of fatal accident their beneficiaries could immediately collect on the insurance equivalent of 13 months. Or, having deposited twelve times, members could collect an equivalent in money of 13 months of insurance at 15% annual interest rate.
These, like other newly-introduced saving schemes that offered high interest rates in order to mobilize domestic funds, generated a negative spread among banks. However, the government reimbursed the negative spread with subsidies. For example, it subsidized the interest-rate costs of commercial banks until May 1969 for these saving schemes. From October 1968 the Central Bank subsidized one-third of the interest-rate costs of state owned banks for six-month and twelve-month time-deposits. In March 1969, this subsidy was changed to 1% for twelve-month time-deposits only, and it was abolished altogether in May 1969.
Analysis
It can be concluded that the financial sector during this period was not independent. Indeed, it could be called a government subsidiary, because banking capital was financed by the Central Bank and the government. But it is undeniable that in this period the Indonesian financial system was transformed, given its ability, as a result of the termination of high inflation, to implement balanced budget and savings schemes.
This period was also a time of reform in the exchange-rate system. In 1967 the government consolidated and centralized a foreign exchange market, then a
3
In May 1972, in accordance with the decrease in time-deposit interest rates of state banks, the following annual interest rates were adopted: 18% for less than 100 thousands rupiah outstanding, 12% for more than 100 thousands rupiah outstanding. In 1973 these interest rates decreased to 15% and 9% respectively, and interest-rate tax was abolished.
exchange market, these having previously been several separate markets. In this period, there were four kinds of foreign exchange:
(i) Export Compensation Foreign Exchange (Devisa Bonus Ekspor);
(ii) Aid Foreign Exchange (Devisa Bantuan: mainly used for commodity aid); (iii) Compensation Foreign Exchange (Devisa Pelengkap: compensated for the
difference between government standard price and exporter price);
(iv) Automatic Allocation Foreign Exchange (Alokasi Devisa Otomatis, which is foreign exchange, of which a certain proportion of export amount is allocated to regional government.).
In the beginning of 1970, Automatic Allocation Foreign Exchange was abolished, then in April 1970 Export Compensation Foreign Exchange and Compensation Foreign Exchange integrated as General Foreign Exchange. Thus foreign exchange was of two kinds: General Foreign Exchange and Aid Foreign Exchange. In this instance the government set a limit on foreign exchange transaction concerning export and import, and it abolished other restrictions concerning any other foreign exchange transaction (Government regulation No 6, 1970). The effect of this was that Indonesia abolished foreign-exchange control at a very early stage of the formation of its financial system.
1-2. Period of Policy-based Finance under Soaring Oil Prices: 1973-82
The structure of the banking sector, with the Central Bank and the state-owned banks at its core, was established during the previous period. During the period 1973-1982, policies introduced in the previous period found structural expression in the financial system: Interest rates in some priority sectors (like rice or other grain in the agricultural sector) were set at very low levels, which caused real interest rates to register in the negative. It can be said that this period typified a regime of financial repression. The government attempted to increase financial deepening. To this end, it set deposit rates at relatively high levels. The gap between the high deposit rates and the lending rate was compensated by subsidies. Abundant oil revenue made this mechanism possible. As Binhadi explained during the period 1973 to 1982, the combination of a
non-self-sustaining financial structure and abundant oil money led the financial sector into a condition of dependence on the government:
Monetary policy before 1983 was characterized by the provision of Bank Indonesia liquidity credit which was mainly supported by the oil boom (Binhadi [1995:13]).
In April 1974 the government announced a monetary tightening, the `Package in April 1974’, to cope with the rising inflation rate. In line with it, the government capped the credit available to banks and offered them all a `liquidity fund’ from which they could lend at low rates of interest. In addition to and in accordance with its development policy, the Central Bank extended direct credit to important industries. That direct credit, however, was financed also by oil revenue.
Since September 1957 banks had been obliged to maintain a reserve ratio of 30% in rupiah liquidity liability. The ratio was reduced to 15% in December 1977. From April 1974 up to 10% of banks’ current liability which was deposited with the Central Bank was eligible for an annual interest-rate payment of 10%. After December 1977 this `reserve ratio’ eligibility for payment was increased to 15% for current liability, but the interest rate was decreased to 6% per annum.
Although variation of the reserve ratio is an important instrument of monetary policy, definitions of `reserve’ and `current liability’ were often changed, depending on each monetary policy and type of commercial bank (state owned, private, foreign). Therefore, even though the formal reserve ratio remained constant, effective reserve ratio departed from it. Thus `reserve ratio’ in this context is not a suitable gauge of the effectiveness of monetary policy.
In 1976 there was a presidential decree to the effect that the capital market had to be upgraded. The design in this was to bring foreign capital into the domestic capital market. In response to the decree, the stock exchange, which had been closed since 1968, reopened in 1977. In anticipation of this, in 1976 the government had set up three institutions charged with developing the capital market: the Committee of Capital Market Policy, the Capital Market Supervision Agency [BAPEPAM], and the state-owned underwriting company, Danareksa.
1-3. Period of Financial Reform: 1983-91
A sharp decline in oil prices in 1982 affected government revenue and its balance of payments, which had relied heavily on revenue from oil export. To meet this exigency, the government tried to work out a structural adjustment policy. In order to turn the economy away from heavy reliance on oil revenue, it devalued the rupiah and implemented deregulation and liberalization policies. Financial liberalization, taken as a series of liberalization policies, aimed to move toward a predominantly market based financial system (Wardhana, 1995: 80).
The comprehensive financial reforms of 1983 radically altered the previous financial infrastructure that had been managed by the government through the Central Bank and the state owned banks. The financial reform and the second reform of 1988 transferred Indonesia’s fund allocation principle, with deregulation and liberalization at the core, from the government to the market. In 1991 the government turned its attention to prudential regulation and it started to pay close attention to soundness in banking practice. A regulatory system was designed and implemented during this period.
Details of specific policies
In June 1983 a financial reform package that proposed the complete liberalization of interest rates on deposits and credit of state-owned banks (except those of Bimas4and small-investment finance) was endorsed by the Cabinet. The interest rates of Tabanas (savings deposit) were increased, and bank-loan ceiling was abolished. The 20% of taxation on interest earned on foreign-currency deposits on domestic market was also abolished.
In next February 1984, the Central Bank Certification [Sertifikat Bank Indonesia: SBI] and the Discount Facility [Fasilitas Diskonto] were introduced. SBI aimed to liquidate current short-term funds among commercial banks, while Fsasilitas Dikonto aimed to supply credit to private commercial banks facing tight liquidities.
4 BIMAS had a policy to self-sufficiency in rice and a commitment to using high-yields seeds, chemical fertilizer, agrochemical, and to arranging finance for agriculture. It was called BIMAS/INMAS: Bimbingan Massal/ Intensifikasi Massal).
In April 1984, monetary policy was eased: The Central Bank decreased discount rates from 17.5% to 16.5%. Interest rates at SBI were also decreased from 15% to 14%. Furthermore, the payment period of preferential loans from the Central Bank to state-owned banks and regional development banks was extended and the interest rates were decreased by 1%. The settlement period of inter-bank interest rates was extended from seven to ninety days.
In September 1984, the Central Bank set a ceiling on inter-bank borrowing of 7.5% of total amount of rupiah deposit in order to stabilize and improve inter-bank transactions. Alternately, the Central Bank offered to advance special liquidities to banks faced with shortage of funds. The interest on that was set at 26% per annum. The discount rate was increased from 16.5% per annum to 26%. The government also changed the frequency of Central Bank Certificate issues from once-a-week to three-times-a-week, with the view of adjusting increases in money supply in a context of expanding credit.
In October 1988, the government announced a banking-sector reform policy-package, Paket 27 Oktober 1988 [Pakto], as the second financial reform. Comprehensive reforms in the financial system were decided in accordance with it. One of its important provisions was the abolishing of restriction on the establishment of new private banks. The establishing of new private banks had been prohibited in 1968, but thanks to deregulation, that was liberalized to the extent that the only precondition that newly admitted bank’s paid-up capital was 10 billion rupiah. In addition to that the nationwide opening of new branches of existing banks was also liberalized. The precondition for such openings was that the previous 24 months’ business performance was good, or the previous 20 months’ performance was good and the remainder months’ at least sound.
The terms of dealing for foreign-exchange banks was eased too, requiring only that the previous 24 months’ financial condition was good and that total asset exceeded 100 billion rupiah. At the same time, foreign banks were admitted into the Indonesian banking business5. (That had been prohibited since 1968.) However, their admission was conditional: newly-admitted banks had to form a partnership with a domestic private
5 Previously
, only ten foreign bank branches and Bank Perdania (joint bank with Daiwa bank) were admitted.
bank, and they had to extend their credit to the export-credit equivalent of 50% of the total outstanding credit.
Private banks became available for establishing development banks, and cooperatives for establishing ordinary commercial banks and development banks. The preconditions were that private development banks’ paid up capital be more than 10 billion rupiah, and in case of cooperatives, that the sum of their basic investment funds and obligate investment funds be more than 10 billion rupiah. Existing savings banks and people-credit banks also were admitted to change their status as ordinary commercial or development banks if they were able to fulfill the foregoing conditions. New-branch opening by non-bank financial institution was deregulated too. In the second financial reform, in addition to the removal of the barriers against entering the banking business, the terms for the issue of certificates of deposit were eased. Thus savings deposits, including national development savings, started to be handled by all banks.
In the wake of the second financial reform, the number of domestic private banks rose from 66 in 1988 to 166 in 1994. New joint banks with foreign banks also increased steadily after1989. Their number reached 40, which was 3.6 times the number of those in existence in 1989.
In keeping with the increase in the number of banks, the total-loan amount also increased. Table-1 shows the ratio of total-loan amount to GDP. It shows also the ratio of state owned banks’ and private banks’ loan-amount to the total of all banks’ loan amount. The table notes that banks’ loan amounts, especially private banks, had increased rapidly after 1989.
Underpinning deregulation was guidance from the World Bank and IMF, which aimed to introduce competitive principles into the financial sector and to improve management effectiveness in the banking and non-banking sectors. Due to Pakto, state-owned enterprises and regional government enterprises were allowed to deposit to private banks and to non-financial institutions. However, deposit to private or non-financial institutions was limited to 50% of total deposit, and deposit per bank to 20% of total deposit.
Alongside deregulation, the second financial reform provided for the prudential regulation for sound banking management. That limited the extending of credit. After the currency crisis, group lending became a serious problem and the existence of group
lending limitation was highlighted. Pakto in1988 had already stipulated that the Legal Lending Limit [LLL] to a debtor is 20% of the capital of the lending bank or financial institution, and to a debtors’ group 50% of capital. Furthermore, there was a lending limit of 10% of capital to the stakeholders of a bank or non-bank institution, 25% to and stakeholder’s corporate group, 5% to auditors-not-stake-holders and to corporation owned by auditors. In addition, there were limitations on lending to board members, auditors and families of stakeholders (Central Bank directors determination, No21/51, 1988).
Analysis
After the second financial reform the financial sector gained momentum for expansion. As result, money supply (M2) increased rapidly, as did the total amount of banks’ lending and size of deposit. As the domestic economy also became active, domestic and foreign investment increased in line with the increase in domestic and foreign investment and investment in the real-estate sector. The expansion of investment in real estate might have been the result of abundant liquidity from the expansion of the banking sector and from the general prosperity of the domestic economy.
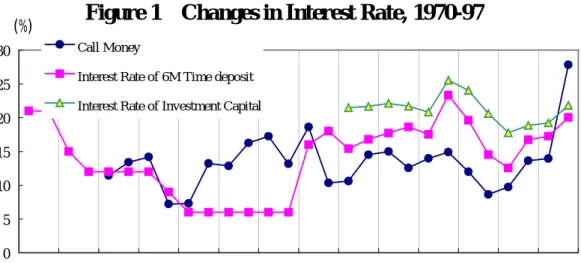
Figure 1 Changes in Interest Rate, 1970-97
0 5 10 15 20 25 30 70 71 72 73 74 75 76 77 78 79 80 81 82 83 84 85 86 87 88 89 90 91 92 93 94 95 96 97 (%) Call Money
Interest Rate of 6M Time deposit Interest Rate of Investment Capital
Increase in real-estate investment is prone to increase in bank’s non-performing loans. Therefore the government organized a policy package for sound banking in February 1991. After 1983 the center of policies for the financial sector was ‘deregulation’, but in 1988 the Bank for International Settlements [BIS] set up the international standard of capital adequacy ratio [CAR] for banking soundness. This international movement encouraged Indonesian financial policy to embrace measures for the maintenance of banking soundness, like the strengthening of capital-adequacy ratio. So 1991 saw the tightening of monitory policy. As a result, deposit interest-rates for 6 months increased to 23.3% form 17.5% in previous year, and working capital interest-rates also increased 25.5% from 20.8% (Figure1).
1-4. Period of financial expansion: 1992-97
In response to the changes of circumstance in the banking sector, the governments passed Government Regulation No. 7, which required that banking management, like owners and managers, follow government guidelines. Furthermore, the government raised banks’ minimum capital from 10 billions rupiah to 50 billions rupiah for commercial banks, and from 50 billion rupiah to 100 billion rupiah for foreign joint banks. Thus in contrast with the previous period, there was considerable emphasis on the supervisory function of the government and of the Central Bank with regard to commercial banks.
However, the government eventually eased some prudential regulations, like those concerning rating and the capital-adequacy ratio, because they were widely condemned as excessively burdensome for banks. On the other hand, in order to strengthen sound banking management, the government enforced observation of the Legal Lending Limit and the provision concerning non-performing loans. The banking sector saw several shifts of the policy axis during this period.
Due to tightening monetary policy in 1991, increase in non-performing loans became a problem mainly for state-owned banks, and some concrete measures for the disposal of non-performing loan were considered. The Central Bank started to emphasize the necessity of strengthening the accounting system and the legal system for achieving the settlement of non-performing loan. At the same time, the Central Bank recognized an obligation to direct 20% of the total lending fund to small and medium-size industries in
order to support the funding side of the government’s development policy and poverty-reduction policy.6
After 1992, the effects of the second financial reform continued. The number of banks and the amount of total loans continued to increase and it was concerned that increase in these areas tended to foment speculative investment. In November 1992, Bank Summa’s7 operation was suspended because increase in non-performing loans led it into financial trouble. This context manifests the paradigm case of banking sector run into the ground by non-performing loans.
In the light of the prudential regulation included in Pakto, the government attended carefully to the capital-adequacy ratio, to group lending and to the loan-deposit ratio. Nevertheless, because of the deregulation of foreign investment in 1994, expansion of the financial sector gained momentum. The vast deregulations concerning foreign investment were the following:
(i) 100% foreign capital participation was allowed without conditions; (ii) minimum investment limitations were abolished;
(iii) the admission-to-extension business period was set at more than thirty years;
(iv) the localization regulation, which had been required for the purpose of increasing Indonesian local capital by more than half after a certain period, was suspended.
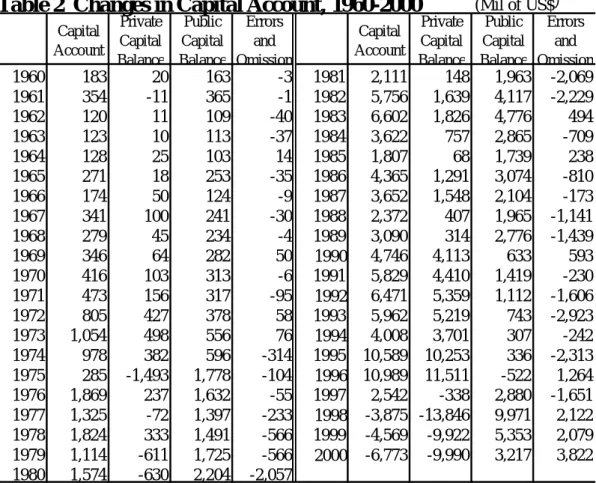
In step with deregulation, private capital inflow increased by 2.7 times from 3.7 billion US dollar in 1994 to 10.3 billon in 1995 (Table-2). These capital inflows were mainly foreign direct investment and portfolio investment.
Total amount of loan and the ratio of total loan to GDP also had increased rapidly after 1994. The expansion was mainly absorbed by private national banks. As a
6 For evaluating a bank’s soundness, a score system of financial indicators was adopted. Since lending to small and medium enterprises (SMEs) was a bonus point, there is a possibility that banks, in quest of a high score, became prone to easy lending to SMEs. (Takeda, 1999: 196).
7 Edward Seky Soeryadjaya, eldest son of Willian Soeryadjaya, owner of Astra Group, owned Bank Summa. His bankruptcy was brought about by a rapid increase in non-performing loans accumulated by massive group lending (IDE, eds,1992).
result, private national banks surpassed state-owned banks in total assets and total loan amounts. On the other hand, excess capital inflow shifted the primary industry for bank lending from the manufacturing sector to the service sector, which was construction and real estate. Then over-lending to specific sectors became a concern.
Table 2 Changes in Capital Account, 1960-2000
(Mil of US$)Capital Account Private Capital Balance Public Capital Balance Errors and Omission Capital Account Private Capital Balance Public Capital Balance Errors and Omission 1960 183 20 163 -3 1981 2,111 148 1,963 -2,069 1961 354 -11 365 -1 1982 5,756 1,639 4,117 -2,229 1962 120 11 109 -40 1983 6,602 1,826 4,776 494 1963 123 10 113 -37 1984 3,622 757 2,865 -709 1964 128 25 103 14 1985 1,807 68 1,739 238 1965 271 18 253 -35 1986 4,365 1,291 3,074 -810 1966 174 50 124 -9 1987 3,652 1,548 2,104 -173 1967 341 100 241 -30 1988 2,372 407 1,965 -1,141 1968 279 45 234 -4 1989 3,090 314 2,776 -1,439 1969 346 64 282 50 1990 4,746 4,113 633 593 1970 416 103 313 -6 1991 5,829 4,410 1,419 -230 1971 473 156 317 -95 1992 6,471 5,359 1,112 -1,606 1972 805 427 378 58 1993 5,962 5,219 743 -2,923 1973 1,054 498 556 76 1994 4,008 3,701 307 -242 1974 978 382 596 -314 1995 10,589 10,253 336 -2,313 1975 285 -1,493 1,778 -104 1996 10,989 11,511 -522 1,264 1976 1,869 237 1,632 -55 1997 2,542 -338 2,880 -1,651 1977 1,325 -72 1,397 -233 1998 -3,875 -13,846 9,971 2,122 1978 1,824 333 1,491 -566 1999 -4,569 -9,922 5,353 2,079 1979 1,114 -611 1,725 -566 2000 -6,773 -9,990 3,217 3,822 1980 1,574 -630 2,204 -2,057
Source : Bank Indonesia, Indonesian Financial Statistics , various issues.
1-5. Period of financial restructuring: 1998 to present time
During the financial expansion period, the government recognized the increase in non-performing loan and the importance of sound banking management. Nevertheless, there was no means of improving the situation because it was happening in a time of rapid financial expansion. Then the Asian currency crisis occurred in July 1997. As a first remedy measure, the government closed sixteen private national banks in November
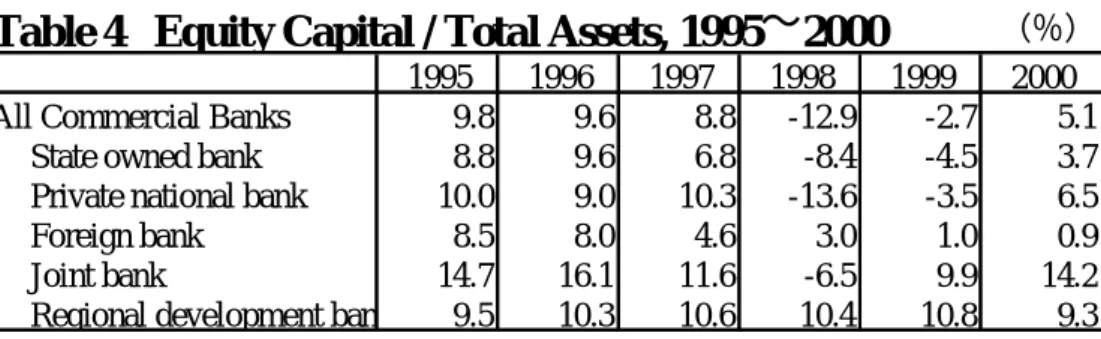
1997. Since those closures were executed without the provision of a safety net (like deposit insurance), the Indonesian banking sector was in complete turmoil. In addition to that, the political turbulence of 1988 led the home currency, rupiah, into deep devaluation. The devaluation hit companies’ performance, many of them holding debts in US dollars, then banks’ performing loan increased at a burst. In March 1999, the average non-performing loan ratio of all commercial banks rose to 58.7% (Table-3). In addition, expansion of liabilities in foreign currency deteriorated banks’ balance sheets, with almost all banks carrying an excess of debt (Table-4).
Table 3 Changes in Non-performing Loan Ratio, 1996∼2000
(%) 1996.3 1997.3 1998.3 1999.3 1999.1 2000.1 All Commercial Banks 10.6 9.3 19.8 58.7 32.8 18.8
State owned bank 16.6 14.2 24.2 47.5 n.a. n.a. Private forex bank 4.0 4.4 12.8 76.9 n.a. n.a. Private non-forex bank 14.7 16.5 19.9 38.9 n.a. n.a. Joint bank 7.4 7.7 25.3 64.6 n.a. n.a. Foreign bank 2.8 2.7 24.4 49.9 n.a. n.a. Regional development bank 18.5 13.9 15.8 17.0 n.a. n.a.
Source : Bank Indonesia, Indonesian Financial Statistics , various issues.
Note: After December 1999, individual banks' figures not available due to change of publication method.
Table 4 Equity Capital / Total Assets, 1995∼2000
(%)1995 1996 1997 1998 1999 2000 All Commercial Banks 9.8 9.6 8.8 -12.9 -2.7 5.1
State owned bank 8.8 9.6 6.8 -8.4 -4.5 3.7 Private national bank 10.0 9.0 10.3 -13.6 -3.5 6.5 Foreign bank 8.5 8.0 4.6 3.0 1.0 0.9 Joint bank 14.7 16.1 11.6 -6.5 9.9 14.2 Regional development ban 9.5 10.3 10.6 10.4 10.8 9.3
Source : Bank Indonesia, Indonesian Financial Statistics , various issues.
As an emergency measure, the Central Bank gave a liquidity support (Bantuan Likuiditas Bank Indonesia [BLBI]) of 164.5 trillion rupiah to fifty-six banks in order to cope with the run on banks after the closure of sixteen banks in November 1997. As a move towards comprehensive bank restructuring, the Central Bank closed several non-performing banks and selected some important banks in order to eventually set them at
the center of the Indonesian banking system. The restructuring of the banking system was implemented with a focus on these selected core banks. The selection was based on the examination by international audit firms of 166 banks in 1998.
In keeping with the result of that examination, the Central Bank divided commercial banks into three categories on the basis of their Capital Adequacy Ratio [CAR]: Category A had a CAR of more than 4%, Category B of -25% to 4%, Category C of under 25% (Takeda, 2000: 205). The government considered Category A banks sound, so they were not subjected to restructuring. Category B banks became the main subjects of restructuring. Category C banks had to increase their capital to –25% during the moratorium period of thirty days in order to become eligible for participating in the government’s restructuring program. Seven state-owned banks were in Category C, but because of their size and importance, all were bailed out.
The banks subjected to restructuring were re-capitalized by government bonds to increase their CAR to 4%, and they shifted their non-collectable credits to the Asset Management Unit of Indonesian Bank Restructuring Agency [IBRA]. In May 1988 the first re-capitalization was implemented in twenty-three banks8. As a condition of re-capitalization, a bank or the bank’s owners had to pay 20% of capital to fulfill the 4% of CAR. Where a bank was unable to fulfill that condition, it was nationalized.
By December 2000, a total of 430.4 trillion rupiah was injected into the banking sector. As a result of restructuring, sixty-eight banks were closed (including one in 2001), thirteen were nationalized, twenty-seven were re-capitalized, four state-owned banks were merged into one new state-owned bank (Bank Mandiri), one nationalized bank was merged with Bank Central Asia [BCA], and eight nationalized banks were merged to become Bank Danamon. Thus Indonesian banks were drastically reshuffled. Furthermore, the IMF imposed the condition that all commercial banks reach 8% of CAR by the end of 2001. Because it was unable to meet this regulation, Uni Bank was closed in November 2001 and a further five banks’ merger was decided upon9.
8 Breakdown: 7 private banks (Bank International Indonesia [BII], Lippo, Universal, Bukopin, Prima Express, Arta Media, Patriot); 4 nationalized banks (Danamon, Tiara Asia, PDFCI, Bank Central Asia) and 12 regional government banks.
9 Merger of Five Banks: Bali, Bank Universal, Bank Prima Express, Bank Arta Media and Bank Patriot, was fixed. Bank Bali is a recapitalized and nationalized bank. The other four banks are recapitalized banks. The CAR of all of them except Bank Bali’s was lower than 8%. Bank Bali was at 11.9% as of June 2001, Bank Universal at 4.1%, Bank Prima Express at 6.5%, Bank Patriot’s and
At the same time bankruptcy law was enacted in order to encourage the disposal of non-performing loan and liquidation10. In May 1999 the central banking law was also amended.11 This secured the independence of the Central Bank. Pursuant of that amendment, the provision of credit to agriculture, housing and small and medium enterprises, which used to be handled by Central Bank, was shifted to other institutions. The Central Bank was no longer required to supply direct credit to these sectors. The banking-supervision function of the Central Bank was also to be transferred to a new supervisory body that would be established by 2003. Thus the Central Bank’s function moved from fiscal distribution to guarding the stability of exchange rates and to devising monetary policy.
2. The Financial Market’s Response to Financial Policies
In the previous section, the process of transformation of the banking system was summarized as the change from a system that consisted of Central Bank and government control of credit through state-owned banks to a modern system based on market mechanism. This section will examine how the financial market responded to the financial policies introduced to bring about the transformation.
Capital inflow
Capital inflow to Indonesia consisted of public capital and private capital. Since Indonesia adopted the balanced-budget principle in 1967, a prerequisite of foreign aid, the volume of public capital inflow was decided by the Consultative Group on Indonesia [CGI].12 Thus public capital inflow was not influenced in principle by economic policy and/or the social situation. Even so, private capital inflow fluctuated in response to changes in the political and/or economic situation (Table-2). There were five Bank Arta Media’s CAR were unknown (21 November, 2001, Jakarta Post).
10
Acting Government Regulation About Amendment of Bankruptcy Law, No1, 1998, and low No. 4, 1998
11 Act for Bank Indonesia No. 23, 1999
12 After the withdrawal of Holland as a chair country, IGGI changed to CGI and was chaired by the World Bank.
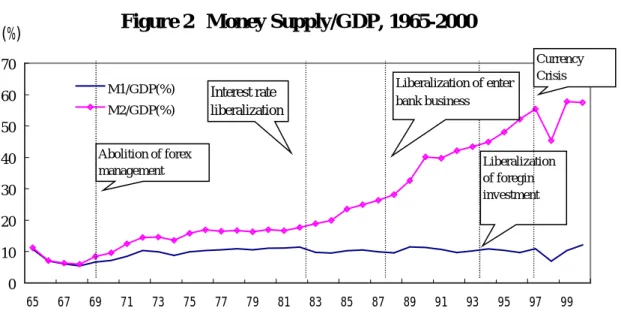
discernible changes in the volume of private-capital inflow between 1966 and 2000. The first occurred at the deregulation of foreign-exchange management in 1970, the second at the liberalization of interest rates in 1983, the third at the liberalization of entry into the domestic banking business in 1988, the forth at the liberalization of foreign investment in 1994, and the fifth during the Asian currency crisis of 1977.
After the deregulation of the foreign-exchange management in 1970, private capital inflow increased in line with the rise in private foreign direct investment in 1972 and 1973. But in 1975, 1.5 billion US dollars, four times the previous year’s amount, went out from Indonesia. This happened in consequence of the Pertamina Crisis. The government paid Pertamina’s, a state-owned oil company, 1.5 billion US dollars in short-term debt due in 1975 out of its total debts 2.3 billion US dollars on behalf of Pertamina. In the same year the government received 1.78 billion US dollars of public capital in order to avoid an expansion of its fiscal deficit, with the result that the capital account in 1975 had a surplus of 285 million US dollars.
Between 1975 and 1981, private capital inflow fluctuated within a short parameter. It must be noted that there was no interruption of the volume of public capital inflow after Indonesia’s receipt of 1.78 billion US dollars in 1975. While private capital inflow could not have been expected during the period when the official interest rates of state-owned banks were set by the government and real interest rates were in the negative. On the contrary, in 1982 private capital inflow increased rapidly to1.6 billion rupiah, an eleven-fold improvement upon that of the previous year.
In 1983, when the first financial reform was implemented, 1.8 billion US dollars of private capital flowed in. But in 1985 that inflow decreased to 68 million US dollars, and thereafter it became volatile. After 1990 private capital inflow developed a `continuous increase’ trend. In that year the amount of inflow reached 4.1 billion US dollars; in the previous year it had been 300 million US dollars. The upward trend was maintained in subsequent years. Because of the foreign-investment liberalization in 1994 and the investment boom in East Asian countries, between 1995 and 1996 more than 10 billion US dollars came into Indonesia. A total of 25 billion US dollars flowed in during the three years until preceding 1997, when capital inflow reversed to outflow. Then, between 1997 and 1999, an almost-equivalent total, 24 billion US dollars, went out.
Capital flow and the development of the financial sector
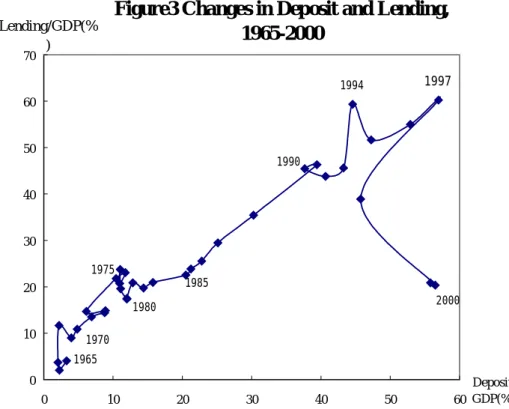
Figure 2 shows that the ratio of money supply to GDP had increased continuously since the beginning of the 1980s, so financial deepening increased. Figure 3 shows that lending also increased proportionately with the increase in the amount of deposit. Especially after the mid-1980s, both deposit and lending rapidly expanded. We can see that after the crisis, though deposit levels were still high, lending decreased rapidly.
Figure 2 Money Supply/GDP, 1965-2000
0 10 20 30 40 50 60 70 65 67 69 71 73 75 77 79 81 83 85 87 89 91 93 95 97 99 (%) M1/GDP(%) M2/GDP(%) Abolition of forex management Interest rate liberalization Liberalization of enter bank business Liberalization of foregin investment Currency Crisis
Source: Bank Indonesia, Indonesian Financial Statistics, various issues.
Changes in the structure of assets and liabilities
After the modernization of the foreign-exchange system in 1967 and the abolition of foreign exchange controls in 1970, assets and liabilities in foreign currency increased. In 1967, assets in foreign currency accounted for 0.8% of total assets, but increased to 18.3% in 1968. Liability in foreign currency also increased from 0.7% to 18% of total assets. After the first financial reform, due to the liberalization of interest rates, the ratio of time deposit to total assets increased from 15.6% in 1982 to 22.5% in 1983. After the second reform in 1988, the liberalization of conditions for entering the domestic banking business accelerated a rise in time deposits and of lending to the private sector. Loans to the private sector accounted for 61.5% of total assets in 1988, up from 49.4% in 1983,
and time deposit also increased to 33.1%. Assets and liabilities in foreign currency increased after 1998 also, but that was due to the depreciation of the rupiah.
Figure3 Changes in Deposit and Lending, 1965-2000 0 10 20 30 40 50 60 70 0 10 20 30 40 50 60 Deposit/ GDP(%) Lending/GDP(% ) 1965 1970 1990 1985 1980 1975 1994 2000 1997
Source: Bank Indonesia, Indonesian Financial Statistics, various issues.
Figure 4 Changes in Structure of Deposits, 1965∼2000
0 10 20 30 40 50 60 70 80 90 100 65 67 69 71 73 75 77 79 81 83 85 87 89 91 93 95 97 99 (%) Demand Deposit Saving/Time Deposit Foreign Currency Deposit Abolition of forex management
Interest rate liberalization
Liberalization of enter bank busibess Liberalization of foreign investment Currency Crisis
Figure 4 shows changes in the structure of demand deposits, savings and time deposits and foreign currency deposits. Savings deposits and time deposits were formally introduced in 1968, before which demand deposits had been the dominant bank deposit. Foreign currency deposit started to increase after the abolition of foreign-exchange controls in 1970. Until the mid-1970s, demand deposits and saving/time deposits were of the same volume, but after the latter half of 1970s, the volume of saving/time deposits decreased. Although the government had set long-term interest rates at high levels in order to encourage mobilization of funds, demand deposits seem to have been preferred: people valued liquidity more than higher interest rates in a financial market that was not yet fully liberalized.
Due to the financial reforms of 1983, discretion concerning the setting of interest rates was shifted from the government to individual banks. Because of that, state-owned banks’ interest rates, which dominated 80% of total deposit in banking sector, impacted on market-deposit rates, causing deposit-interest rates to rise. For example, interest rates on one-year deposits increased from 9% to19%. This increase mobilized funds to time deposit, and thus the volume of saving/time deposit became much greater than that of demand deposits. After 1988 saving/time deposit grew rapidly, and in the 1990s, foreign deposits surpassed demand deposits.
Table 5 Changes in Composition of Total Assets by Group of Ban
1987∼2000
1987 1988 1989 1990 1991 1992 1993 All commercial banks 100.0 100.0 100.0 100.0 100.0 100.0 100.0 State owned bank* 64.7 63.0 54.8 48.7 50.9 51.8 47.0 Private national bank** 21.9 24.0 31.9 36.2 38.2 36.8 41.2 Foreign/Joint bank 5.8 5.1 5.5 7.4 8.5 8.4 9.2 Regional development ban 7.7 8.0 7.8 7.7 3.0 2.9 3.1 1994 1995 1996 1997 1998 1999 2000 All commercial banks 100.0 100.0 100.0 100.0 100.0 100.0 100.0 State owned bank* 42.1 39.7 36.5 38.2 40.0 49.6 51.3 Private national bank** 45.9 47.8 51.8 47.0 46.2 36.9 35.6 Foreign/Joint bank 9.5 9.8 9.2 14.2 13.0 13.0 12.5 Regional development ban 3.2 3.2 2.8 2.3 1.9 2.4 2.6
Source : Bank Indonesia, Indonesian Financial Statistics , various issues.
*Including one state development banks and one state saving bank. **Including private development bank and two private saving banks.
Analysis
The two financial reforms and the massive capital inflow after the liberalization of foreign investment controls promoted the banking sector’s expansion. Private national banks developed at a remarkable rate after the mid-1990s. However, after the crisis the situation relapse into its pre-liberalization state. Table 5 shows the changes in the total-assets composition of commercial banks. After 1999 state owned banks’ total total-assets again surpassed private national banks’ assets. In 2000 state-owned banks controlled more than half of all commercial banks’ assets. During this harsh time, the banking sector, including almost all banks, had negative equity and many private banks were closed. All state-owned banks were bailed out in order to avoid disorder on the financial market. All state banks, including Bank Mandiri, which is the biggest bank forged from the merger of four state owned banks, were re-capitalized with 280 trillion rupiah by the government. Because uncertainty was mounting in the banking sector, many deposits were shifted for safety to owned banks or nationalized banks. This is the main reason why state-owned banks regained the dominant position. Foreign banks’ and joint banks’ volumes also increased to more than 10%. This occurred for the same reason that brought about the resurgence of state-owned banks: depositor flight to safety.
3. Analysis of Commercial Banks’ Financial Indicator
It was demonstrated in the previous section that the liberalization in 1998 of conditions for entering the domestic banking business contributed to the quantitative expansion of the banking sector. Until the financial reforms, state-owned banks had dominated the Indonesian banking sector. After 1994, private national banks surpassed state-owned banks, both in total assets and total lending. Since 1994 and until the currency crisis, private national banks overtook state-owned banks, with the result that the Indonesian banking system came to be considered an effective market in which competitive principle functioned. How then did quantitative expansion affect banks’ behavior? And did it accompany changes in bank lending or asset-investment practices that were conducive to fund raising?
It is said that as part of the state of disorder in the banking sector after the currency crisis, easy loans made the banking sector vulnerable. And it is pointed out that one reason for this vulnerability was the rapid increase in the number of banks in the absence of a sufficiency of skilled human capital and competent screening loan skill. However, such assertions require careful investigation. Against the assumption that the new banks’ management systems were inefficient, there is no ground for claiming that banks which had been managed by the government and the Central Bank since 1965 were run effectively. Until the crisis, the Indonesian government had a `no bankruptcy of banks’ policy. Such a government policy might be seen as one that encourages moral hazard in banking management. Notably, during and after the crisis, state-owned banks were not closed and but merged, and merger does not necessarily improve effectiveness of management.
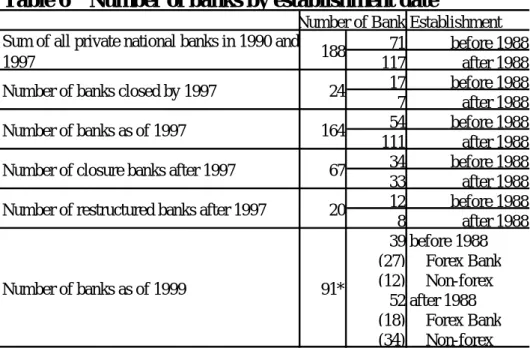
Table 6 Number of banks by establishment date
Establishment 71 before 1988 117 after 1988 17 before 1988 7 after 1988 54 before 1988 111 after 1988 34 before 1988 33 after 1988 12 before 1988 8 after 1988 39 before 1988 (27) Forex Bank (12) Non-forex 52 after 1988 (18) Forex Bank (34) Non-forex
Source : PT Ekofin Konsulindo, “ Indonesian Banking Indicator and Financial
Performance 31 December 1991–31 December 1999” (CD-ROM).
Note: As of 1999 a number of banks decreased to 91 from 164 in 1997, due to closures of 67 bank, merger of 6 nationalized-banks. A merger of BCA and Bank Risjad Salim International(RSI), and Danamon and 8 nationalized-banks were executed gradually and finished in 2000, so that as of 1999 only 6 banks merger to Bank Danamon were finished.
Number of restructured banks after 1997 20
Number of banks as of 1999 91* Number of banks as of 1997 164 Number of closure banks after 1997 67
Number of Banks Sum of all private national banks in 1990 and
1997 188
In this section, the Indonesian banking sector is examined through a six-part categorization of its institutions: state owned banks, regional development banks, private national foreign exchange banks (hereafter, ‘forex’), private national non-foreign exchange banks (‘non-forex’), joint banks, foreign banks. This examination compares the business performance13 of state owned banks, forex banks, non-forex banks and joint banks. Findings concerning management and corporate governance in joint banks are expected to be different from those concerning national banks because of the formers’ foreign capital holdings. On that basis, it is expected that the criteria for evaluating joint banks will yield the fair indicators of the comparison study.
The categories `forex banks’ and ‘non-forex banks’ are further subdivided into groups in accordance with their foundation years: `before 1988’ and `after 1988’, in order to determine whether differences in banks’ behavior can be attributed to commencement before or after the liberalization of 1988.
After 1988, the rush to establish new banks started. By 1999, 18 of the 45 forex banks were established after 1988, as were 34 of 46 non-forex banks. Between 1990 and 1997 in both periods, there was a total of 188 banks (not including joint banks). Of these, 24 were closed by 1997. Among the 164 banks still in existence in 1997, 67 were closed after the crisis, and the government restructured 20 of them. Table 6 shows the change in the number of banks number.
Table 7 Total Assets of Private National Banks
by Establishment Date in 1991, 1994 and 1997
(Mil of Rp)1991 1994 1997 all banks 39,462,148 74,466,467 184,094,891 per bank 769,999 1,438,772 3,503,261 all banks 3,109,380 9,728,864 29,428,073 per bank 103,646 249,602 747,345
Source : PT Ekofin Konsulindo, "Indonesian Banking Indicator and Financial Performance
31 December 1991 - 31 December 1999"(CD-ROM), Jakarta, 2000. after 1988 52 Establishment Number of bank as of Total Assets before 1988 39
13 The database of Ekofin Konsulindo is used in the analysis. This database holds all commercial banks’, including non-listed banks’, half-yearly balance sheets and profit-and-loss assessments from 1991 to 1999. Though there are discontinuities in its records, this database is the only useful one available for a study of the 1990s.
Of the 67 banks closed, 34 were set up before 1988, and 12 of the 20 banks restructured after the crisis were set up before 1988. This shows that `new banks’ does not necessarily imply `badly managed banks’. The significant difference between new and old banks was in their sizes. Table 7 shows that the average total asset of old banks in 1991 was 770 billion rupiah per bank, while new banks’ was 100 billion rupiah per bank, or only one-seventh of that of the old banks. Furthermore, comparing forex and non-forex banks on growth of total assets between 1991 and 1997, the forex banks show (Table 8) the bigger growth in total assets per bank: these assets increased 8.2 times between 1991 and 1997. Table 8 shows also that during the mid-1990s, the private national banks, including the new private national banks, were at the core of the Indonesian banking sector’s expansion.
Table 8 Growth Rate of Total Asset of Private National Banks
by Establishment Date in 1991, 1994 and 1997
(Mil of Rp) Number of bank as of Establish -ment date Total Asset 1991 1994 1997all banks 38,006,174 71,884,693 180,029,945 4.7 times per bank 1,407,636 2,662,396 6,667,776 4.7 times all banks 2,458,781 7,166,421 24,065,276 9.8 times per bank 163,919 421,554 1,336,960 8.2 times all banks 1,455,974 2,581,774 4,064,946 2.8 times per bank 132,361 215,148 338,746 2.6 times all banks 650,599 2,562,443 5,362,797 8.2 times per bank 43,373 77,650 157,729 3.6 times
Source : PT Ekofin Konsulindo, "Indonesian Banking Indicator and Financial Performance
31 December 1991 - 31 December 1999"(CD-ROM), Jakarta, 2000.
Compariso n between in 91 and Forex Bank 27 before 1988 18 after 1988 Non-forex Bank 12 before 1988 34 after 1988
The following six groupings of banks will be compared: seven state-owned banks14, 27 old-forex banks, 18 new-forex banks, 12 old-non-forex banks, 34 new-non-forex banks and 31 joint banks. The differences in management across the six groupings will be examined from the perspective of asset structure. But before that examination, the difference in scale among the groups is worth noting. Table-9 shows the percentage of
14 The seven state-owned banks are Bank Negara Indonesia (BNI), Bank Rakyat Indonesia (BRI), the State Saving Bank (BTN), and the predecessors of Bank Mandiri: Bank Bumi Daya (BBD), Bank Dagang Negara (BDN), Bank Expor Impor (Bank Exim) and Indonesia development bank (Bapindo).
assets of each bank in the six groupings against the total assets of all commercial banks. State-owned banks and old forex banks together commanded around 80% of total assets of all commercial banks. Thus it must be understood that the behavior of both banks types has impacted upon the banking sector as a whole.
Table9 Total Assets by Group of Banks*
(%)Dec-91 Dec-92 Dec-93 Dec-94 Dec-95 Dec-96 Dec-97 Dec-98 Dec-99 State owned bank** 63.0 62.1 59.2 54.7 50.5 46.1 43.2 47.5 46.4 Old forex bank 22.6 23.0 24.8 27.7 30.5 35.0 33.8 31.9 31.7 New forex bank 1.5 1.6 2.0 2.8 3.1 3.5 4.5 4.0 4.2 Old non-forex bank 0.9 1.0 1.0 1.0 1.0 1.0 0.8 0.9 0.9 New non-forex bank 0.4 0.5 0.8 1.0 1.1 1.2 1.0 1.1 0.9 Joint Bank 5.2 5.6 5.8 6.5 6.8 6.6 7.8 8.2 5.5
Source : PT Ekofin Konsulindo, "Indonesian Banking Indicator and Financial Performance
31 December 1991 - 31 December 1999"(CD-ROM), Jakarta, 2000.
Note* : Ratio of each group bank's total assets to all commercial banks' total assets, including regional development banks and foreign banks.
Note** : Until 1988, state owned bank consisted of seven banks: Bapindo, BBD, BDN, EXIM, BNI, BRI, BTN. In 1999. Currently there are four state owned banks: Mandiri, BNI, BRI, BTN.
3-1. Financial and Management Indicators by Bank Group
A sound banking system consists of banks that have high profitability and adequate capital (Greuning at el [2000:76]).
The following is an examination of the basic indicators of profitability, capital, and risk management. ‘Profitability’ indicates banks’ competitiveness and quality of management, ‘sufficiency of capital’ indicates banks’ safety and soundness, and `risk management’ is the most important feature of the lending practices of banks.
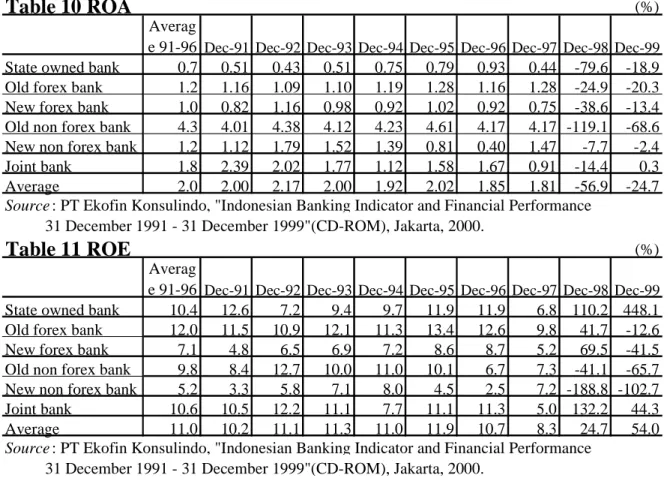
(1) Return on Assets [ROA]: profits / total assets
Return on Assets is a ratio of profit-to-total-asset, an important indicator of a company’s comprehensive profitability (Table-10). Comparing the average ROA of banks in the six groupings between 1991 and 1996, the highest average is the 4.3% of the old-non-forex banks. The lowest is the 0.7% of the state-owned banks. State-owned banks’ ROA was
less than 1% throughout the 1990s. This reveals that the state-owned banks’ profitability was low in proportion to their total assets. The new forex banks’ was lower still at 1.0%, whereas both the old-forex banks’ and the new-non-forex banks’ stood at 1.2 %. Joint banks’ was at 1.8%.
Table 10 ROA
(%)Averag
e 91-96 Dec-91 Dec-92 Dec-93 Dec-94 Dec-95 Dec-96 Dec-97 Dec-98 Dec-99
State owned bank 0.7 0.51 0.43 0.51 0.75 0.79 0.93 0.44 -79.6 -18.9 Old forex bank 1.2 1.16 1.09 1.10 1.19 1.28 1.16 1.28 -24.9 -20.3 New forex bank 1.0 0.82 1.16 0.98 0.92 1.02 0.92 0.75 -38.6 -13.4 Old non forex bank 4.3 4.01 4.38 4.12 4.23 4.61 4.17 4.17 -119.1 -68.6 New non forex bank 1.2 1.12 1.79 1.52 1.39 0.81 0.40 1.47 -7.7 -2.4 Joint bank 1.8 2.39 2.02 1.77 1.12 1.58 1.67 0.91 -14.4 0.3 Average 2.0 2.00 2.17 2.00 1.92 2.02 1.85 1.81 -56.9 -24.7
Source : PT Ekofin Konsulindo, "Indonesian Banking Indicator and Financial Performance
31 December 1991 - 31 December 1999"(CD-ROM), Jakarta, 2000.
Table 11 ROE
(%)Averag
e 91-96 Dec-91 Dec-92 Dec-93 Dec-94 Dec-95 Dec-96 Dec-97 Dec-98 Dec-99
State owned bank 10.4 12.6 7.2 9.4 9.7 11.9 11.9 6.8 110.2 448.1 Old forex bank 12.0 11.5 10.9 12.1 11.3 13.4 12.6 9.8 41.7 -12.6 New forex bank 7.1 4.8 6.5 6.9 7.2 8.6 8.7 5.2 69.5 -41.5 Old non forex bank 9.8 8.4 12.7 10.0 11.0 10.1 6.7 7.3 -41.1 -65.7 New non forex bank 5.2 3.3 5.8 7.1 8.0 4.5 2.5 7.2 -188.8 -102.7 Joint bank 10.6 10.5 12.2 11.1 7.7 11.1 11.3 5.0 132.2 44.3 Average 11.0 10.2 11.1 11.3 11.0 11.9 10.7 8.3 24.7 54.0
Source : PT Ekofin Konsulindo, "Indonesian Banking Indicator and Financial Performance
31 December 1991 - 31 December 1999"(CD-ROM), Jakarta, 2000.
Okuda [2000: 199-208] compared the ROA of Thai and Philippine banks across three groupings: upper class bank, middle-class bank, and lower-class bank. According to that study, the Philippine upper class banks’ ROA in 1991 and 1994 was 2.9% and 2.3%, the middle-class banks’ 3.0% and 2.2%, and the lower-class banks’ 3.2% and 3.2%. The Thai upper-class banks’ was 1.5% and 2.5%, the middle-class banks’ 0.8% and 1.9%, the lower-class banks’ 0.6% and 1.1%. Among Indonesian banks, only the old non-forex banks’ and the joint banks’ profitability was higher than the Thai and Philippine banks’; the rest were lower. On the whole, profitability during the latter part of the 1990s tended to be lower than it was during the early years of that decade.
Table12 Profitability Ratio(Net Interest Profit/Earning Assets)
(%) Average 91-96 Dec-91 Dec-92 Dec-93 Dec-94 Dec-95 Dec-96 Dec-97 Dec-98 Dec-99
State owned bank 2.5 1.9 1.5 2.5 3.3 3.0 2.7 2.4 -5.2 -6.0 Old forex bank 3.3 2.3 3.9 3.6 3.6 3.2 3.2 3.3 -12.1 -5.1 New forex bank 4.3 4.5 5.6 4.0 4.1 4.2 3.6 -0.3 -19.1 -13.8 Old non forex bank 5.6 1.1 6.6 7.3 7.6 5.5 5.5 6.5 10.4 6.6 New non forex bank 4.9 1.7 8.0 5.9 5.3 4.6 4.1 6.4 6.1 3.7
Joint bank 3.7 5.0 4.3 3.5 2.8 3.0 3.3 2.6 4.3 4.2
Average 4.9 3.3 6.0 5.4 5.3 4.7 4.5 4.2 -3.1 -2.1
Source : PT Ekofin Konsulindo, "Indonesian Banking Indicator and Financial Performance 31 December 1991 - 31 December 1999"(CD-ROM), Jakarta, 2000.
(2) Return of Equity [ROE]: net profits/ equity
Return on Equity is as much a basic indicator of a bank’s profitability as is ROA (Table-11). ROE is the ratio of net profit to capital. It is one of the indicators of profitability from the shareholder’s point of view. Between 1991 and 1996 the average ROE of old-forex banks was the highest at 12%. Both state-owned banks and joint banks were at more than 10%, and the lowest, the new non-forex banks’, was at 5.2%. This was so because the state-owned banks’ and the forex banks’ capital was rather small, while the new non-forex banks’ was large. That is, the new-non-forex banks’ capital ratio (capital divided by total asset) was at an average of 33.5% from 1991 to 1996. This was higher than the state-owned banks’ capital ratio of 4%.
(3) Profitability (net interest profits/earning assets)
Banking profitability from the staple business, lending, can be represented as the ratio of `net interest profit from earnings assets’ to `total earnings assets’ (Table-12). The state-owned banks’ profitability was the lowest. The old non-forex banks’ rose after 1992. Next to that the new-forex banks’ was also high. However, the new-forex banks’ net interest profit was already heading towards the negative in 1997. By 1998 three groups’ figures – the state-owned banks’, the old-forex and the new-forex banks’ – were in the negative, while non-forex banks still kept a rather high level. This difference is accounted for in terms of the difference in the volume of foreign currency assets and liabilities. That difference in volume shows that the impact of devaluation was the most severe on the state-owned banks and on the forex banks.
(4) Loan-to-Deposit Ratio [LDR]: total outstanding credit/total deposit
LDR is a ratio of total lending to total deposit (Table-13). From the profitability perspective, high LDR is preferable, but from the risk perspective, too much lending against funding capacity or deposit is not desirable. State-owned banks’ LDR was as high as 106.6% on average. Joint banks’ was the highest at 164.3%. On the other hand, old-forex banks’ and new-old-forex banks’ LDRs were rather low at 78.1% and 67.2 respectively, as were old-non-forex banks’ and new-non-forex banks’ at 56.5% and 57.5%. Especially during the first half of the 1990s, the non-forex banks’ LDR was very low at 30-40%.
Table 13 LDR
(%)Averag
e 91-96 Dec-91 Dec-92 Dec-93 Dec-94 Dec-95 Dec-96 Dec-97 Dec-98 Dec-99
State owned bank 106.6 135.1 124.7 101.9 91.0 91.4 95.5 101.7 130.6 124.5 Old forex bank 78.1 81.2 73.8 73.7 82.7 79.5 77.6 81.5 47.4 22.1 New forex bank 67.2 53.6 65.7 65.1 76.1 73.3 69.4 82.6 -70.5 28.2 Old non forex bank 56.5 31.9 41.6 56.2 68.4 71.8 69.2 69.1 391.4 34.0 New non forex bank 57.5 40.1 44.9 56.4 67.3 67.1 68.9 69.7 38.1 35.4 Joint bank 164.3 150.9 164.5 165.6 156.5 178.9 169.6 200.5 288.6 88.7 Average 106.0 98.6 103.0 103.8 108.4 112.4 110.0 121.0 165.1 66.6
Source : PT Ekofin Konsulindo, "Indonesian Banking Indicator and Financial Performance
31 December 1991 - 31 December 1999"(CD-ROM), Jakarta, 2000.
Table 14 Expenditure Ratio
(%)Averag
e 91-96 Dec-91 Dec-92 Dec-93 Dec-94 Dec-95 Dec-96 Dec-97 Dec-98 Dec-99
State owned bank 38.9 46.1 44.3 36.2 31.2 35.2 40.3 43.5 -18.1 -25.1 Old forex bank 34.6 34.4 35.7 36.3 35.3 34.4 31.3 28.4 -6.4 -18.9 New forex bank 35.6 36.4 33.6 39.8 34.2 32.8 36.7 -485.7 -5.7 -10.6 Old non forex bank 35.5 36.2 32.3 29.9 33.1 42.5 39.1 38.9 20.5 30.9 New non forex bank 28.7 21.8 27.2 27.8 28.7 30.7 35.7 28.4 30.8 44.9 Joint bank 17.8 13.1 15.3 19.5 22.2 18.5 18.4 18.1 13.0 15.7 Average 38.2 37.6 37.7 37.9 36.9 38.8 40.3 -65.7 6.9 7.4
Source : PT Ekofin Konsulindo, "Indonesian Banking Indicator and Financial Performance
31 December 1991 - 31 December 1999"(CD-ROM), Jakarta, 2000.
Ratio of expense for personnel to net interest profit represents management efficiency (Table-14). The state-owned banks’ was high at 38.9% on average from 1991 to 1996, while the lowest was the joint banks’ at 17.8%. The new-non-forex banks’ was in the twenty-percent range, and both the forex-banks’ and the old-non-forex banks were in the thirty-percent range. Except the joint banks’, all other banks’ levels were almost the same.
Table 15 Provision Ratio
(%)Averag
e 91-96 Dec-91 Dec-92 Dec-93 Dec-94 Dec-95 Dec-96 Dec-97 Dec-98 Dec-99
State owned bank 3.1 3.0 3.2 3.8 3.7 2.4 2.2 2.4 39.1 30.5 Old forex bank 1.5 1.1 1.7 1.7 1.6 1.6 1.6 2.0 35.6 20.9 New forex bank 0.9 0.6 0.9 0.9 0.9 1.2 1.1 2.2 33.9 14.5 Old non forex bank 1.3 0.7 1.3 1.5 1.8 1.3 1.4 1.5 10.5 4.6 New non forex bank 1.6 1.8 1.7 1.2 1.1 1.6 1.9 2.4 18.7 9.0 Joint bank 2.4 2.3 3.0 2.7 2.2 2.0 2.3 3.7 24.6 27.1 Average 2.2 1.9 2.4 2.3 2.3 2.0 2.1 2.8 32.5 21.3
Source : PT Ekofin Konsulindo, "Indonesian Banking Indicator and Financial Performance
31 December 1991 - 31 December 1999"(CD-ROM), Jakarta, 2000.
(6) Provision Ratio (provision/total lending)
Provision ratio to total lending is one of the indicators of risk management (Table15). The state-owned banks’ was at 3.1%, and the joint banks’ at 2.4%, while both of forex and non-forex banks’ were at the low level of 0.9-1.6%. In 1995 and 1996 all banks’ figures were falling because in those years default risk tended not to be measured against rapid increase in lending. After the crisis, the state-owned banks’ provisional ratio became high at 39.1%, and the other banks’ also rose to level at 20-30%. Because of the crisis, the problem of non-performing loan came to the surface, and all banks were required to accumulate provision against default risk.
3-2. Asset Portfolio and Funding by Banking Groups
(1) Changes in Asset Portfolio
One of the most important functions in banking is the intermediary. Banks collect short-term funds and lend them to primary borrowers through several mechanisms like