Korean Flow-of-Funds and Policy Evaluation:
Comparison between Monetary Stabilization
Bonds and Korean Treasury Bonds
著者
Kim Jiyoung
権利
Copyrights 日本貿易振興機構(ジェトロ)アジア
経済研究所 / Institute of Developing
Economies, Japan External Trade Organization
(IDE-JETRO) http://www.ide.go.jp
journal or
publication title
IDE Discussion Paper
volume
664
year
2017-04
INSTITUTE OF DEVELOPING ECONOMIES
IDE Discussion Papers are preliminary materials circulated
to stimulate discussions and critical comments
Keywords: monetary policy evaluation, flow-of-funds, asset-liability-matrix JEL classification: C67, E01, E58, G38
*Research Fellow, International Input-Output Analysis Studies Group, Development Studies Center, IDE ([email protected])
IDE DISCUSSION PAPER No. 664
Korean Flow-of-Funds and Policy Evaluation:
Comparison between Monetary Stabilization
Bonds and Korean Treasury Bonds
Jiyoung KIM*
April 2017
Abstract
This study evaluates the authorities’ monetary policies on a “from-whom-to-whom” basis for Korean FOF tables and using the input–output analysis method. In order to compare the monetary policy of the central bank with that of the government, net induced investments (NII) are calculated and decomposed. The notable findings of this study are as follows. After the Asian financial crisis in 1997, negative investments by the financial sectors, induced by the central bank, increased drastically. The sign of total NII finally turned negative during the period of credit card distress. However, the global financial crisis in 2008 was a turning point, in which the NII of the financial sectors, and especially banks, switched to being positive. In contrast, net investments induced by the Korean government have shown a steady increase. In addition, other than in 2008, the effects of changes in the government portfolio have been positive and constant.
In addition, the NII of a combination of financial instruments are used to analyze monetary or fiscal policy simulations. This method will provide useful indicators for policy authorities when needing to select optimal amounts and types of financial instruments for open-market operations.
The Institute of Developing Economies (IDE) is a semigovernmental,
nonpartisan, nonprofit research institute, founded in 1958. The Institute
merged with the Japan External Trade Organization (JETRO) on July 1,
1998.
The Institute conducts basic and comprehensive studies on economic
and related affairs in all developing countries and regions, including Asia,
the Middle East, Africa, Latin America, Oceania, and Eastern Europe.
The views expressed in this publication are those of the author(s). Publication does not imply endorsement by the Institute of Developing Economies of any of the views expressed within.
INSTITUTE OF DEVELOPING ECONOMIES (IDE), JETRO
3-2-2, WAKABA,MIHAMA-KU,CHIBA-SHI
CHIBA 261-8545, JAPAN
©2016 by Institute of Developing Economies, JETRO
No part of this publication may be reproduced without the prior permission of the IDE-JETRO.
1
Korean Flow-of-Funds and Policy Evaluation: Comparison between Monetary
Stabilization Bonds and Korean Treasury Bonds
Jiyoung Kim
Abstract
Since its establishment, the Bank of Korea has primarily used monetary stabilization bonds and foreign exchange holdings for money market operations. By comparison, until the 1990s, far fewer Korean treasury bonds were issued. Despite most countries showing a government deficit, the Korean government can be represented as a surplus sector in terms of flow-of-funds (FOF) accounts. This study evaluates the authorities’ monetary policies on a “from-whom-to-whom” basis for Korean FOF tables and using the input–output analysis method.
In order to compare the monetary policy of the central bank with that of the government, net induced investments (NII) are calculated and decomposed. The notable findings of this study are as follows. After the Asian financial crisis in 1997, negative investments by the financial sectors, induced by the central bank, increased drastically. The sign of total NII finally turned negative during the period of credit card distress. However, the global financial crisis in 2008 was a turning point, in which the NII of the financial sectors, and especially banks, switched to being positive. In contrast, net investments induced by the Korean government have shown a steady increase. In addition, other than in 2008, the effects of changes in the government portfolio have been positive and constant.
In addition, the NII of a combination of financial instruments are used to analyze monetary or fiscal policy simulations. This method will provide useful indicators for policy authorities when needing to select optimal amounts and types of financial instruments for open-market operations.
Keywords: monetary policy evaluation, flow-of-funds, asset-liability-matrix JEL classification: C67, E01, E58, G38
Research Fellow, International Input-Output Analysis Studies Group, Development Studies Center, Institute of
2
I. IntroductionIn general, the central bank decides on its monetary policy in order to achieve sustainable economic growth, while maintaining the value of the currency. This is managed by the amount of money, interest rate, price, and so on. The “base rate” is the most important management responsibility of the Bank of Korea (BOK), the central bank of South Korea. The Monetary
Policy Committee of the BOK sets the base rate every month, considering overall price
movements, financial market conditions, and domestic and foreign economic activities. A newly determined base rate has an immediate impact on the overnight call rate. Then, the change in the call rate affects the market interest rates, which, ultimately, influences the real economy.
Figure 1 shows the benchmark interest rates of the BOK. The solid line represents the fluctuation of the BOK base rate1, while the broken line represents the inflation rate. Overall, the base rate shows a decreasing tendency. In particular, the base rate was slashed in October 2008, when the global economy was confronted with the Lehman shock. The BOK decided to implement a heavy rate cut in a short period to aid the recovery of the real economy, because the crisis had affected the financial and foreign exchange markets. More recently, the base rate has been trending lower since July 2012. Despite implementing two rate cuts in 2014, overall domestic spending has remained in a downturn. The BOK lowered the base rate to a record low of 1.75% on March, 2015. The key rate had never previously been lower than 2%.
[Figure 1 is inserted about here]
The monetary stabilization bond (MSB) is a unique monetary policy, used by Korea to control excess liquidity. The BOK was established in 1950, and MSBs were first issued by the BOK in 1961. If market liquidity increases steadily, the BOK issues MSBs to stabilize excess liquidity. Then, if there is a shortage of liquidity, the BOK buys MSBs from the public and banks to supply sufficient liquidity to the market. MSBs are the main instruments of open market operations. Korea achieved rapid economic growth through its export-driven policy, which attracted foreign investors into the financial markets. Since then, its market liquidity has
1
From May 1999 until February 2008, the call rate (i.e., overnight inter-bank lending rate) was adopted as a target rate of monetary policy. However, this changed to the BOK base rate from March 2008. The BOK base rate is the reference policy rate applied in transactions between banks, such as repurchase agreements (RPs) and deposits and loans used for liquidity adjustments.
3
been affected by overseas factors. Accordingly, MSBs began to assume the role of a foreign exchange policy tool after the Asian financial crisis in 1997. This central bank’s performance is observed in the balance sheets of its flow-of-funds (FOF) accounts. Table 1 presents the liability and financial asset portfolios of the BOK over five-year periods. The BOK liability portfolio comprises mainly financial debentures, while most invested financial instruments are foreign exchange holdings in its financial asset portfolio. According to Park (1996), the BOK had to issue large amounts of MSBs, assigning them to non-bank financial institutions at interest rates below market rates, because the money growth targets were considered to be more important indicators than others were.
[Table 1 is inserted about here]
Since MSBs were functioning as monetary policy tools, the use of Korean treasury bonds (KTBs), which are issued by the Korean government for open market operations, was restrained.
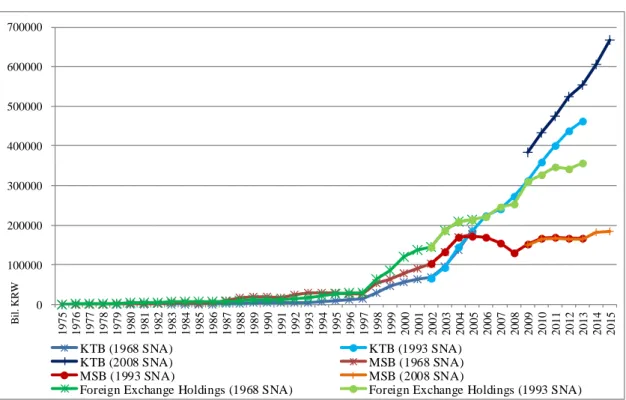
Using FOF account data, Figure 22 shows government and public bonds, which are liabilities of
the general government sector, financial debentures in liabilities, and the foreign exchange holdings in the assets of the BOK. In the FOF accounts, KTBs issued by the general government were less than MSBs issued by the BOK before 2005. For example, the amounts of MSBs were more than twice those of KTBs from 1978 to 2004. In particular, the amounts of MSBs were 26.3 times those of KTBs in 1985. However, the issuance of MSBs has slowed since the crisis in 1997. MSBs have been faltering, particularly during the global financial crisis in 2008. In the other words, prior to the crisis in 1997, the major financial instruments of Korean open market operations were MSBs. However, the use of KTBs has subsequently increased dramatically, and the situation has now completely reversed. Since the crisis in 2008, the amounts of KTBs have grown to twice those of MSBs.
[Figures 2 and 2-a are inserted about here]
MSBs and KTBs have similar reliable yields and have been used as tools for open market operations in Korea. MSBs and KTBs are compared in some prior studies using various
2
4
empirical methods. For example, vector auto-regressions (VARs) were employed by Kim and Kim (2013). Other studies have examined the effectiveness of the monetary policy of the central bank. Chung (2008) examined the relationship between the BOK base rate and household consumption, using the dynamic stochastic general equilibrium (DSEG) model.
Then, Tsujimura and Tsujimura (2006) evaluated policies using financial transaction matrices of FOF accounts and applying the input–output (I–O) analysis method. The authors examined the effectiveness of the central bank’s monetary policies, the so-called quantitative easing policy introduced by the Bank of Japan (BOJ), demonstrating induced investments and savings. Adopting this method, Manabe (2009) evaluated the policies of public financial institutions using the FOF accounts of Japan. This methodology has several advantages. The induced investments and induced savings, sorted by institutional sectors or financial instruments, are calculated. In other words, it is possible to maximize the net induced investments for the entire non-financial economy, or to compute the optimal policy for any particular institutional sector's net induced investments (NII). Therefore, it is possible to suggest valuable indicators for policymakers. However, thus far, there have been no policy evaluations using the FOF accounts of Korea. Therefore, the main aim of this study is to evaluate Korea’s monetary policies and to suggest appropriate market operations. To this end, we evaluate the monetary policies of the central bank and the government using the FOF accounts of Korea.
This paper contains five sections. The second section explains the methodologies and describes the data. The evaluation of the central bank’s policy, using long-term data, is examined in the third section. The fourth section compares the policy evaluations of the central bank and that of the Korean government. Simulated investments and savings induced by MSBs and KTBs are also reported in this section. The final section concludes the paper.
II. Methodology and Data
FOF accounts consist of the balance sheets of all institutional sectors in one country. The FOF system adopts the quadruple-entry system derived by Copeland (1952), wherein each transaction is recorded with a double entry. In this analysis, we adopt the I–O analysis method
devised by Tsujimura and Mizoshita (2002a, b)3 for FOF accounts. By translating these balance
3
For details, refer to Tsujimura and Mizoshita (2002a), Kim (2016) in English and Tsujimura and Mizoshita (2002b), pp. 32–43 and pp. 116–129 in Japanese.
5
sheets into an asset–liability matrix (ALM), which is a sector-by-sector matrix, it is possible to calculate the induced effects of monetary operations.
A. Method used to Evaluate the Central Bank’s Money Market Operation
1. Construction of the Y and Y∗ Tables (Financial Transaction Matrices)
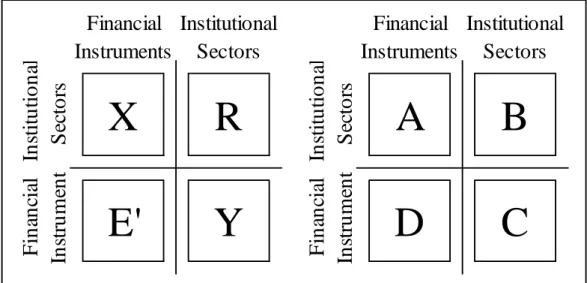
First, two tables need be constructed for this procedure. The E table is a matrix that represents the fund-employment portfolio of each institutional sector, while the R table shows the fundraising in each institutional sector. By applying a method widely used in I–O analyses, it is
possible to construct two types of square matrices, Y and Y∗, using the E and R tables. The Y
table is based on an asset portfolio, while the Y∗ table is founded on a liability portfolio. Matrix R and the transposed matrix E are substituted for matrices U and V in the I–O analysis to obtain the Y table. Goods and industries in the I–O table correspond to financial instruments and institutional sectors, respectively:
U ≡ R (1) V ≡ E′. (2)
In the case of fund-employment assumptions, matrix E and the transposed matrix R are employed to obtain the Y∗ table:
U∗≡ E (3)
V∗≡ R′. (4)
Figure 3 presents tables of fund transactions and coefficients based on the liability approach. Figure 4 shows tables based on the asset approach. The coefficient matrices, B and B∗, are constructed from the R and E tables by dividing by the T vector of the column sums, which are the sum of either assets or liabilities, whichever is larger:
[Figures 3 and 4 are inserted about here]
bij= R
6
bij∗ = Etj. (6)
Likewise, the coefficient matrices, D and D∗, which are computed from E′ and R′ by dividing
by TE and TR, indicate the sums of the financial items. Here, tjE represents the sum of the assets, and tjE indicates the sum of the liabilities for financial instrument j:
dij= E′
tjE (7)
dij∗ = R′
tjR. (8)
The m × m (m = number of institutional sectors) coefficient matrices, C and C∗, are calculated
under the institutional sector portfolio assumption:
C = DB (9) C∗= D∗B∗. (10)
Then, each element of the transaction quantity matrices, Y and Y∗, are computed as follows:
yij= cijtj (11) yij∗ = c
ij∗tj, (12)
where tj represents the sum of either assets or liabilities; yij denotes the funds supplied from
the ith institutional sector to the jth institutional sector; and yij∗ denotes the funds from the jth to
the ith institutional sectors. In Figures 3 and 4, the Y and Y∗ tables show the fund transactions
between institutional sectors. The former is based on the assumption that each institutional sector’s fundraising portfolio is fixed. In contrast, the latter is founded on the assumption that the fund-employment portfolio of each institutional sector is settled.
7
In the SNA, the difference between the assets and liabilities in the FOF accounts reflects net investments (i.e., the difference between savings and investments) in the real economy. Earlier,
we obtained the Y and Y∗ tables showing the financial transactions between institutional
sectors. In an earlier study, Tsujimura and Tsujimura (2006), evaluated the policy of the BOJ using the Y and Y∗ tables. In this study, the central bank is treated as an exogenous institutional sector in the Y and Y∗ tables. We first describe the evaluation method here, and then apply it to the BOK in the third section and to the Korean government in the fourth section. Tsujimura and Tsujimura (2006) estimated the induced quantity of fund demand and supply to analyze the effect of the central bank’s money market operations through financial transactions between institutional sectors, which are represented in Leontief inverse form. According to the
preceding section, the Y and Y∗ tables are expressed as follows:
CTY+εY=TY (13)
C∗TY∗ +ρY∗
=TY∗
. (14)
First, it is necessary to separate the policy authority sector from the Y and Y∗ tables. We denote matrices C𝜋 and C𝜋∗ such that the row and column elements of the central bank are
removed from matrices C and C∗, respectively:
C𝜋TY+ε
𝜆Y= TY (15)
C𝜋∗TY∗
+ρ𝜆Y∗=TY∗
, (16)
where each element of ε𝜆Y is the sum of excess liabilities (εY) and the liabilities of the central bank (ε𝜋Y). Each element of ρ𝜆Y
∗
is the sum of excess assets (ρY∗
) and the assets of the central bank (ρ𝜋Y∗):
ε𝜆Y= ε 𝜋
8
ρ𝜆Y∗ = ρ 𝜋 Y∗ +ρY∗ . (18)Here, ε𝜆Y and ρ𝜆Y∗ are described as an (m − 1) × 1 vector, because the elements of the policy authority are eliminated from the matrices C and C∗. Solving each equation for TY and TY∗, respectively, yields the following:
TY= (I − C 𝜋)−1ε𝜆Y (19) TY∗ = (I − C𝜋∗)−1ρ 𝜆 Y∗ , (20)
where I denotes the [(m – 1) × (m – 1)] unit matrix, and (I − C𝜋)−1 and (I − C𝜋∗)−1 are the Leontief inverse matrices. Denote (I − C𝜋)−1 as matrix Γ𝜋 and (I − C𝜋∗)−1 as matrix Γ𝜋∗.
Using the Leontief inverse matrices Γ𝜋 and Γ𝜋∗, we can calculate the final induced demand and
supply of funds. From the real economy's point of view, the induced demand for funds can be regarded as gross induced savings (GIS), which shows the amount of new savings required. On the other hand, the induced supply represents gross induced investments (GII), which indicates the capacity for new investments.
Since the central bank is exogenous in this model, it is possible to calculate the effect of the monetary policy implemented by the central bank. The policy authority can choose from among various monetary policy options. For instance, the BOK has three monetary policy methods: open market operations, lending and deposit facilities, and a reserve requirements policy. If open market operations are chosen, the BOK may buy MSBs or securities from, or sell to the public and banks. In the case of MSBs issued by the BOK, financial bonds in their liabilities accounts (R table) will increase. In the asset portfolio (E table), the BOK raises mostly foreign
exchange holdings. Let us denote the liabilities held by the policy authority as ε𝜋, which is an n
× 1 vector. In the same way, an (n × 1) vector, ρ𝜋, denotes the policy authority’s financial
instruments. Next, we need to transform the vectors επ and ρ𝜋 into (m − 1) × 1 vectors when
applying a Leontief inverse. For the transformation, we use (m − 1) × n matrices, D𝜋 and D𝜋∗,
which are represented in the row of the policy authority, which is omitted from the m × n matrices D and D∗:
9
fρ = D𝜋∗ρ𝜋. (22)
Because ε𝜋 and ρ𝜋 are given exogenously, the induced savings and induced investments are
calculated as follows:
ŋS= (I − C𝜋)−1f
ε (23)
ŋI = (I − C𝜋∗)−1f
ρ, (24)
respectively, where ŋS and ŋI are (m − 1) × 1 vectors. Element ŋSi represents the induced
savings generated in the ith institutional sector, whereas ŋIi indicates the induced investments
by the ith institutional sector. Then, the GIS and the GII are obtained as follows:
HS= ∑𝑚−1ŋSi
𝑖=1 (25)
HI = ∑𝑚−1𝑖=1 ŋIi. (26)
Finally, the NII as a monetary policy evaluation indicator is obtained by subtracting the GIS from the GII:
HN = HI− HS. (27)
The changes in the NII in period t can be computed as the first difference of HNt:
△ HNt= HNt− HNt−1. (28)
3. Decomposition of NII
1) Decomposition by the Financial Instruments4
The GIS, GII, and NII can be obtained quarterly (or yearly) using the method described in section II.A.2. It is possible to decompose these indices into the elements of the financial instruments. In other words, we can observe which financial instruments were caused by the fluctuation of the NII. For the decomposition, we need to calculate the induced savings and the
4
10
induced investments when the policy authority increases 1 unit of any asset and any liability simultaneously. Let us denote vector ε𝜋,kU that represents 1 unit of a liability of the kth financial instrument, while vector ρ𝜋,hU represents 1 unit of an asset of the hth item:
ε𝜋,kU = [ 0 ⋮ 0 1 0 ⋮ 0] (29) ρ𝜋,hU = [ 0 ⋮ 0 1 0 ⋮ 0] . (30)
Then, D𝜋 and D𝜋∗ are adopted for the transformation:
fε,𝜋,kUY = D𝜋ε𝜋,kU (31) fρ,𝜋,hUY∗ = D𝜋∗ρ
𝜋,h
U . (32)
Multiply them by the Leontief inverse to obtain the induced savings, ŋSkU, and the induced investments, ŋIhU: ŋSkU = (I − C 𝜋)−1fε,𝜋,kUY (33) ŋIhU = (I − C 𝜋 ∗)−1f ρ,𝜋,hUY ∗ . (34)
The GIS and GII are expressed as follows:
HSkU = ∑𝑚−1𝑖=1 ŋSk,i (35)
HIhU = ∑𝑚−1ŋIh,i
𝑖=1 . (36)
11
HN= HI− HS (37) = ∑𝑛 HIkU 𝑘=1 ∙ ρ𝜋,k− ∑𝑛𝑘=1HSkU εk,𝜋 = ∑𝑛 (HIkU 𝑘=1 ∙ ρ𝜋,k− HSkU ∙ εk,𝜋) ,where ρ𝜋,k represents the assets holdings of the policy authority, and εk,𝜋 denotes liabilities.
The NII caused by kth financial instrument is expressed as follows:
Kk= HIkU ∙ ρ
𝜋,k− HSkU ∙ εk,𝜋. (38)
2) Effects of a Mutation in the ALM and a Change in the Portfolio of Policy Authority The NII can be considered to be an evaluation indicator for the monetary policy. The changes in the NII can also decompose the cause of an increase or a decrease in these indices into two elements:
△ HNt= HNt− HNt−1 (39) = (HIt− HSt) − (HIt−1− HSt−1)
= (I′Γt∗fρ,t− I′Γtfε,t) − (I′Γt−1∗ fρ,t−1− I′Γt−1fε,t−1).
In this paper, we adopt the following IO-SDA method, as examined by Tsujimura and Tsujimura (2006):
△ HNt= (40)
{(I′Γt∗f
ρ,t− I′Γtfε,t) − (I′Γt∗fρ,t−1− I′Γtfε,t−1)} + {(I′Γt−1∗ fρ,t− I′Γt−1fε,t) − (I′Γt−1∗ fρ,t−1− I′Γt−1fε,t−1)}
2 +{(I′Γt
∗f
ρ,t− I′Γtfε,t) − (I′Γt−1∗ fρ,t− I′Γt−1fε,t)} + {(I′Γt∗fρ,t−1− I′Γtfε,t−1) − (I′Γt−1∗ fρ,t−1− I′Γt−1fε,t−1)}
2 .
This is the arithmetic average of the Laspeyres and Paasche decomposition. According to Tsujimura and Tsujimura (2006), the first term of the right-hand in the equation shows the effects of changes in fundraising or in the fund-employment portfolio of the policy authority. On the other hand, the effects of the mutation in the Leontief inverse (i.e., structural changes) are represented in the second term. We can simplify the above equation as follows:
12
△ HNt=△ ft+△ Γt. (41)
B. Data
To achieve the purpose of this analysis, the FOF accounts are used. The BOK publishes Korean FOF accounts both quarterly and yearly. These accounts contain (1) financial transactions (flows), and (2) financial assets and liabilities (stocks). Table 2 shows the number of institutional sectors and financial instruments in the Korean FOF accounts in the 1968, 1993, and 2008 Systems of National Accounts (SNA). The FOF account data in the 1993 SNA, which contains 22 institutional sectors and 35 financial items, are retroacted to 2002. Furthermore, the 2008 SNA data, which contain 23 institutional sectors and 46 financial instruments, have existed since 2008. Therefore, we decided to use FOF accounts in the 1968 SNA to observe the long-term of fluctuation of the monetary policy of the BOK for the third section. The 1968 SNA is composed of nine institutional sectors and 34 financial instruments, and is available from 1975 to 2005. For the next step, we use the FOF accounts in the 1993 SNA and in the 2008 SNA to compare the KTBs of the general government sector and the MBSs, because the issuance of KTBs was significantly small before the Asian financial crisis.
[Table 2 is inserted about here]
Ⅲ. Evaluations of the Money Market Operations by the BOK
A. Calculating the GIS, GII, and NII from the Money Market Operations 1. Overall
In the balance sheets of the BOK, the proportion of MSBs is the largest in the liabilities table, while foreign currency is the main instrument of investment in its financial asset portfolio. However, the BOK can have other financial instruments in its balance sheets. Table 1, in the first section, represents the liability and financial asset portfolios of the BOK. There are currency, deposits, repurchase agreements (RPs), financial debentures, loans, and foreign debts in the liability portfolios. On the other hand, the BOK has RPs, bonds, BOK loans, equities, foreign exchange holdings, and foreign claims in its financial assets. If the BOK takes an action for the money market operation, it is required to choose financial instruments in liabilities and
13
financial assets simultaneously. For example, if the BOK issues 1 unit of MSBs as a liability, it has to decide the component ratio of the newly added unit in their assets. The BOK may choose 1 unit of foreign exchange holdings in their financial assets, or may select 0.6 units of foreign exchange holdings and 0.4 units of BOK loans. The BOK is able to decide the ratio and amounts of financial asset and liability portfolios, which depend on its monetary policies. These kinds of actions might have an effect on the GII, GIS, and NII. The sign of the NII, which is the difference between the GII and GIS, can be a useful indicator of the effectiveness of the monetary policies. If it is positive, the policy boosts the expansion of the non-financial economy. In contrast, a negative NII means the policy will lead to an economic contraction.
Figures 5 and 6 show the fluctuations in three indices, the GII, GIS, and NII, using the annual data from the 1968 and 1993 SNAs. Figure 7 shows the fluctuation using the quarterly data of the 2008 SNA. The NII shows a positive sign for 40 years, with the exception a period around 2005. The tendency of a positive NII during this approximate 40-year period indicates that the monetary policies of the BOK helped to expand the Korean economy. Overall, the monetary policies of the BOK, or strictly speaking, the liability and asset portfolios chosen by the BOK, seem to have performed well from the viewpoint of positive induced investments.
[Figures 5, 6 and 7 are inserted about here]
The first differences of the NII are described in Figure 8. Here, the indicator is negative between in 1985 and 1988, when Korea experienced an economic boom. The period from 1986 to 1989 was a so-called “Boom with Three Lows,” which means low oil prices, low international interest rates, and a weak US dollar. The negative NII during this period seems to be caused by the central bank seeking ways to prevent the economy from overheating. In Figure 9, Korea showed a current account surplus during this period. After 1988, it remained positive for 10 years. However, after the Asian financial crisis, the NII turned negative again in 1998, as shown in Figure 8. In Figure 9, the current account deficit changes quickly to be positive in 1998. The current account surplus became smaller until 2001, but then increased again. From 2001 to 2006, the current account curve has the shape of a mountain that peaked in 2004. This seems to reflect the monetary policy of the BOK after 2001 of decreasing the NII, as shown in Figure 8 (1968 SNA data). The financial shock in 2008 exerted a strong influence on the current
14
account and the NII, where the currency account surplus shrank and the NII rose sharply. The next section discusses the period of negative NII.
[Figures 8 and 9 are inserted about here]
2. Negative NII during the Period of Credit Card Distress
In Figures 5, 6, and 7, the net investments induced by the BOK show negative signs only
around 20055. To understand the negative net investments in this period, Figures 106, 11 and 12
show the NII sorted by institutional sector. In these figures, non-financial corporations and the rest of the world appear in the positive area because their GII is bigger than their GIS. On the other hand, individuals (households and NPOs, households and NPISHs) appear in the negative area when households are the main saving sector in the country. The general government shows this distinctive feature in Figure 10. It had been located in the positive region until 1986, but the values became negative from 1987 when its GIS became larger than its GII, because it had been shown as a financial surplus sector in the FOF accounts of Korea. With the exception of the general government, the proportion of the positive NII taken up by the overseas sector has grown remarkably since the late of 1980s.
In Figure 10, the growth of positive investments by private corporations declined in 2004 and 2005. Furthermore, negative investments (in other words, positive savings) by banks, insurance and pension funds, and other financial institutions increased substantially over the same period. Similarly, Figure 11 shows the negative investment by the financial sectors during this period. Because the 1993 SNA data are composed of more specific institutional sectors, Figure 13 displays the NII of each financial sector. At a glance, Figure 13 is separated two parts. The first is before 2008, which shows relatively smaller net investments by other banks and bigger negative contributions by domestically licensed banks. Then, after 2008, the portion of net investments by other banks has increased. The former period records huge negative investments because most financial sectors are included in the negative domain. Moreover, only two sectors, other banks and credit-specialized financial institutions, are located in the positive area in 2006.
5
2004 and 2005 in Figure 5 (1968 SNA), 2005 and 2006 in Figure 6 (1993 SNA).
6
15
[Figures 10, 10-a, 11, 12 and 13 are inserted about here]
To investigate the reason for the negative investments induced by the BOK, we have to address the issue of the credit card booms and busts that resulted in a crash in 2003. After the Asian financial crisis in 1997, lending to households increased at a remarkable rate, with the deregulation of the financial industry in Korea. According to Kang and Ma (2008), a combination of demand and supply side factors contributed to increase consumer finance. Weak corporate loan demand and an easing of monetary policy, rising living standards and house prices, reduced costs in retail finance owing to rapid progress in information technology, financial deregulation (e.g., new and foreign entrants in the banking sector), and government policies8 all boosted lending to households. Additionally, Park (2009) pointed out that one of most obvious reasons why household debt increased drastically was the low interest rate policy that started in 1999. However, the reckless issuance of credit cards caused a serious social problem. Excessive debt payment burdens led borrowers to default on their obligations and file for individual bankruptcy, causing serious financial problems for card issuers, who were not able to redeem the debt. As a result, several credit card companies collapsed in 2003, and had to be rescued by the government or parent banks. Accordingly, loans to households by credit companies declined. Using the Y table9, Figure 14 shows the financial asset portfolio of credit-specialized financial institutions, which includes credit card companies. In this figure, households and the non-profit sector are the greatest lenders. However, this dropped in 2003 and 2004, corresponding to the credit card lending distress. The countermeasures put in place by the Korean authorities were as follows (Kang and Ma, 2008; Valderrama, 2004). First, the BOK supplied short-term liquidity of 4 trillion KRW through open market operations in March 2003, purchasing government bonds and redeeming MSBs. Second, LG card, the biggest credit card issuer, had to be rescued by the government, arranging a 3.7 trillion KRW package through the Korean Development Bank (KDB)10. This is reflected in Figure 15 using the Y table11, which shows the liability portfolio of credit-specialized financial institutions. The shares of fundraising from general
8
Tax benefits for merchants accepting credit cards, and income tax deductions linked to credit card purchases for cardholders.
9
Differences between total financial assets and total liabilities are excluded in Figures 13 and 14.
10 KDB is included in specialized banks in the FOF accounts.
11
16
government and banks12 increased sharply in 2003. Overall, the central bank’s monetary policy in this period carried a contraction. In particular, it attempted to induce greater savings from the financial sectors. However, induced savings (i.e., negative investment) by the financial sectors, especially depositary corporations and other financial institutions, shrank from 2007, turning positive in 2008, as shown in Figures 11 and 12. Figure 16, which shows the financial asset portfolio divided by the shares of institutional sectors, explains the increase in the net investments in the financial sectors induced by the BOK. Essentially, the BOK invested over 80% of financial assets in the foreign sector. However, fund employment to domestic financial sectors13 rose sharply in 2008. The global financial crisis led to the BOK increasing its domestic financial asset holdings, rather than reducing foreign claims. As a result, it enlarged the NII of the domestic financial sectors.
[Figures 14, 15 and 16 are inserted about here]
B. Decomposition of the NII by the BOK
1. Decomposition using the Financial Instruments
The NII and the changes in the NII were calculated in section Ⅲ.A. Here, we can decompose
the causes of the increases and decreases in each financial instrument. Figures 1714, 18, and 19
show the GII and GIS using the shares of financial items. The GII is composed mainly of foreign exchange holdings. Other financial assets have very small proportions, for example,
BOK loans and beneficiary certificates15. On the other hand, financial debentures issued by the
BOK (i.e., MSBs) are the largest item in the GIS. However, government loans16 are increasing
continuously in Figures 17 and 18.
[Figures 17, 17-a, 18 and 19 are inserted about here]
12 Fundraising by the general government shifted from 6.3% in 2002 to 8.5% in 2003, while that of domestic banks
increased from 12.6% to 18.9%, specialized banks increased from 5.1% to 7.6%, and other banks increased from 3.3% to 3.9%.
13
Fund employment to investment institutions expanded to 9.7% in 2008 from 0.6% in 2007, while domestic licensed banks rose to 6.1% from 2.3%, specialized banks rose to 3.1% from 2.3%, other banks rose to 2.3% from 0.7%, and other non-banks rose to 0.9% from 0.1%.
14
Enlarged partial details for 1975–1996; see Figure 17-a.
15 The shares of these two items only increased during the crisis in 2008.
16
This refers to money that the BOK borrows from the general government sector. Proportions of government loans in the NII by the BOK only existed in the 1968 SNA and 1993 SNA, as shown in Figures 12 and 13. However, government loans disappeared in Figure 14, because the 2008 SNA records government loans in the liabilities of the BOK as zero.
17
2. Effects of a Mutation in the ALM and a Change in Money Market Operations
It is possible to decompose the changes in the NII into two elements, as described in section II.A.3. The first is the effect of structural changes in the money market, and the second is the effect of money market operations, which are reflected in the asset liability portfolio of the policy authority. The changes in the NII, along with its decomposition, are shown in Figures 20, 21, and 22. Furthermore, the pillars are decomposed into two parts, as described above.
The first impression of Figure 20 might be that the effect of a mutation in the ALM (vertical-lined segment) is positive, except during 2005. In contrast, the effect of changes in the BOK portfolio (oblique-lined segment) shows a general negative trend from the middle of the 1980s. The contributions of the asset liability portfolio of the BOK are smaller than those of the mutation in the ALM until the early 2000s. Despite the positive NII, the money market operations of the BOK helped to shrink the growth of the non-financial economy.
[Figures 20, 21 and 22 are inserted about here]
This situation is quite different to that shown by the decomposition of the Japanese NII. The annual fluctuation in the NII in Japan from 1980 to 2004, as calculated by Tsujimura and Tsujimura (2006), demonstrates a negative NII, except between 1987 and 1993. In addition, according to the decomposition shown in Tsujimura and Tsujimura (2006), using quarterly data from 1998 to 2004, “the contributions of the shift in money market operations reflected in the asset and liability portfolio of the central bank are greater than those of the mutation of the ALM17.”
On the other hand, the NII shown in Figure 21 is spread nearly evenly between positive and negative values, though a positive trend lasted until the early 2000s (see Figure 20). In Figure 21, both elements show huge positive signs, caused by the crisis in 2008. In Figures 21 and 22, the relative effect of mutations in the ALM decreased. Moreover, those pillars are located in the negative region in some cases. In recent years, Korean monetary policies do not seem to have increased the growth rate of the non-financial economy, with the exception of the asset-liability portfolio of the BOK, which caused an increase to a positive NII during the global financial
17
18
crisis. Figure 23-a shows the changes in the NII divided by the institutional sectors, based on Figure 21. In Figure 23-a, all institutional sectors are located in the positive region in 2008. In particular, the largest sectors are depositary corporations and private non-financial corporations. Figure 23-a is then decomposed into Figures 23-b and 23-c. These figures are also sorted by institutional sector. In Figure 23-b, the proportion of depositary corporations is smaller than that in Figure 23-a, while the proportion of private non-financial corporations is greater. Figure 23-c shows that the effect of the mutation in the ALM for private non-financial corporations is negative in 2008. This implies that the money market operations of the BOK helped to increase real investments, mainly for private non-financial corporations, during the crisis.
[Figures 23-a, 23-b and 23-c are inserted about here]
Ⅳ. Comparison between the Central Bank and General Government A. Calculating the NII by the General Government and Decomposition
In the introduction, we mentioned that MSBs issued by the BOK and the GTBs issued by the Korean government have similar yields. Furthermore, they are not risky items because they are guaranteed by the central bank or government. If these two kinds of bonds have the same yields, then which policy can induce greater investment in the non-financial economy? In order to answer this question, we first estimate the NII induced by the general government. Then, we compare the two types of NII using the decompositions. Finally, we examine simulations for each policy.
First, the NII by the general government can be obtained using the same method described in section II.A.2. In this section, we treat the general government sector as exogenous, rather than
the BOK. Denote matrices CG and CG∗ such that the row and column elements of the general
government are eliminated from matrices C and C∗:
CGTY+ε g
Y= TY (42)
CG∗TY∗
19
where each element of εgY represents the sum of excess liabilities (εY) and the liabilities of the
general government (εGY). Then, each element of ρ
g
Y denotes the sum of excess assets (ρY∗) and
the assets of the general government (ρGY∗):
εgY= ε G Y+εY (44) ρgY∗= ρ G Y∗ +ρY∗. (45)
Here, εgY and ρgY∗ are displayed as an (m – 1) × 1 vector, because the elements of the general
government sector have been removed from matrices C and C∗. Solving for TY and TY∗ yields the following:
TY= (I − C G)−1εgY (46) TY∗ = (I − CG∗)−1ρ g Y∗ . (47)
Then, we can calculate the NII in the same way as in the case of the BOK. In Figure 24, the GII contains mainly government loans. In the same way, the GIS contains mostly government bonds. There is a remarkable difference. In Figure 24, the GII and GIS of the general government sector show greater numbers of financial instruments than those of the BOK, as shown in Figure 18. For example, varied securities and stocks (shares and other equities) are also shown in the GII of the general government. This difference in the diversity of the NII between the two types of policies may bring about different results for the economy. Which institutional sectors are more affected in terms of investments (or savings) by each policy? We analyze the GIS, GII, and NII by institutional sector in the next section.
[Figure 24 is inserted about here]
B. Comparison between the NII of the Central Bank and the General Government
Figures 25–28 show the computed NII and the first differences when the general government is given exogenously.
The GIS (or GII) is defined as the sum of induced savings (or induced investments) in the previous section. Each element of induced savings, ŋSi, and induced investments, ŋIi, is
20
expressed per institutional sector i. Figures 17–19 show the net investments induced by the BOK. The NII curve is identical to those in Figures 10–12, where the bars indicate the GIS or GII of each institutional sector. In the same way, the NII curves in Figures 24 and 25 are the same. However, a remarkable difference is evident between Figures 11 and 25. If the elements selected by the BOK (most of which are composed of MSBs in the liability portfolio, and foreign currency as asset holdings brought on by the BOK monetary policy) are exogenous, then the overseas sector and the non-financial corporations are shown as positive induced investments in Figures 11 and 12, while households and government NPOs are negative. In other words, the BOK monetary policy led to households increasing their savings. In contrast, when the general government is exogenous, most institutional sectors are positive, as shown in Figures 25 and 26. Only small amounts of the GIS appear in life insurance companies, households, and NPOs.
[Figures 25 and 26 are inserted about here]
Figures 27 and 28 show the decomposition into two elements, namely the effect attributed to changes in the general government portfolio, and that of mutations of the coefficients of the ALM. In these figures, the contributions from the general government portfolio are positive, except during the global crisis in 2008. In contrast, the contributions of changes in the market structure are negative. This is the opposite of what we found for the BOK, where changes in the portfolio were large and positive in 2008 (see Figure 21).
[Figures 27 and 28 are inserted about here]
To clarify the differences in the effects of the two policy authorities, Figure 29-a shows the changes in the NII by institutional sector. Similarly to Figure 23-a, the largest sector in 2008 is depositary corporations (see Figure 29-a). However, the portion of private non-financial corporations in 2008 is lower than in other periods. Figure 29-a is decomposed into Figures 29-b and 29-c. The latter shows that the contributions of structural changes are caused mainly by depositary corporations. In contrast to Figure 23-b, which shows that the BOK money
21
market operations induced large investments by private non-financial corporations in 2008, only
public non-financial corporations have a positive sign in Figure 29-b18.
[Figures 29-a, 29-b and 29-c are inserted about here]
To investigate this difference in the effects of the two policy authorities, Figures 30 and 31 show the asset liability portfolios of the BOK, and Figures 32 and 33 show that of the general government. In Figure 32, government bonds in liabilities increase steadily, from 48.2% in 2002 to 93.2% in 2013. The financial asset holdings of the general government vary considerably, with little change evident in Figure 23. In contrast, the composition ratio of the BOK financial asset portfolio changes significantly in 2008. BOK foreign exchange holdings are over 80% in Figure 30. However, this drops to 68.8% in 2008 in order to deal with the financial crisis. Beneficiary certificates and BOK loans increase in 2008 in place of reduced foreign exchange holdings. The BOK liability portfolios show substantial changes in Figure 25. The ratio of financial debentures (i.e., MSBs) decrease gradually. Instead of a downturn in MSBs, the ratio of government loans increases drastically, from 0% in 2002 to 33.2% in 2013. This shows that fundraising by the BOK changed to depend on government loans rather than on issuing MSBs directly.
[Figures 30, 31, 32 and 33 are inserted about here]
C. Comparison of the NII by Financial Instruments of the Policy Authorities
Based on the formula for the NII defined in the second section, we can analyze monetary or fiscal policy simulations. The GIS, GII, and NII are calculated when each element of the BOK (or the Korean government) is given exogenously. In the previous section, we computed the coefficient matrices C𝜋 and C𝜋∗ for the BOK, and CG and CG∗ for the general government in the same way. To calculate the GIS and GII, we use the liabilities and financial asset holdings of the exogenous sectors. The NII obtained using this calculation indicates past induced investments. Using these coefficients, we can forecast the NII for the near future for the
18
Some financial institutions are aggregated in this figure. Strictly speaking, four financial sectors have positive values: small loan financial companies for households and small businesses (1016 bil KRW), other non-banks (1081 bil KRW), public financial institutions (1226 bil KRW), and other financial intermediaries (3079 bil KRW).
22
financial instruments of the two policy authorities. In the other words, we can compare and simulate investments and savings induced by the policies that will come into effect in future, because we have the current information. For example, if the BOK decided to issue 1000 units of additional MSBs, the element of MBSs in ε𝜋,kU increases. With 1000 units of increased liabilities, the BOK is confronted with a financial asset selection. If the BOK chooses 700 units of foreign currency and 300 units of BOK loans for its investments, these two elements in ρ𝜋,hU will increase. The changes in ε𝜋,kU and ρ𝜋,hU are determined by the BOK policy. There are various ways in which the BOK can increase its liabilities, including deposits with the BOK, government deposits with the BOK, RPs, currency, and other foreign debts. Although the BOK creates the same increase in liabilities, the GIS will not be equal in each case because each instrument has different ripple effects.
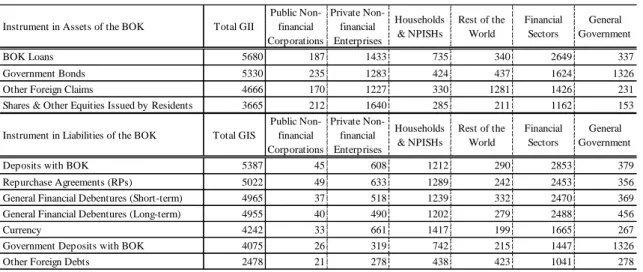
Using the latest data, Table 319 shows the induced investments and savings, sorted by the financial items of the BOK, when the BOK increases its financial instruments by one unit (1 trillion KRW). According to this table, deposits with BOK induce the biggest savings. On the other hand, the smallest savings are induced by other foreign debts. Induced savings are also listed per institutional sector. Currency shows the largest induced savings for private non-financial enterprises, households, and NPISHs. Government deposits with the BOK is the best measure when the BOK intends to induce savings by the general government. For the GII, BOK loans indicate the largest induced investment in the overall economy. However, shares and other equities issued by residents induce the greatest investment in non-financial corporations. As expected, other foreign claims induce the greatest investments for rest of the world, while government bonds do so for the general government. Table 4 shows induced investments and savings, categorized by the financial instruments of the general government. Trade credits result in the greatest GIS for the overall economy and for non-financial enterprises. Other deposits is the best choice if the Korean government aims to induce more savings in households and NPISHs. We anticipate that BOK loans in the liabilities of the Korean government induce the largest savings by the BOK, while other foreign debts do so for rest of the world. On the other hand, general financial debentures (long-term) induce the largest investments for the overall economy. However, trade credits in assets and government
19
23
bonds (long-term) in liabilities are the best combination if the Korean government wishes to induce greater investments by private non-financial enterprises.
[Tables 3 and 4 are inserted about here]
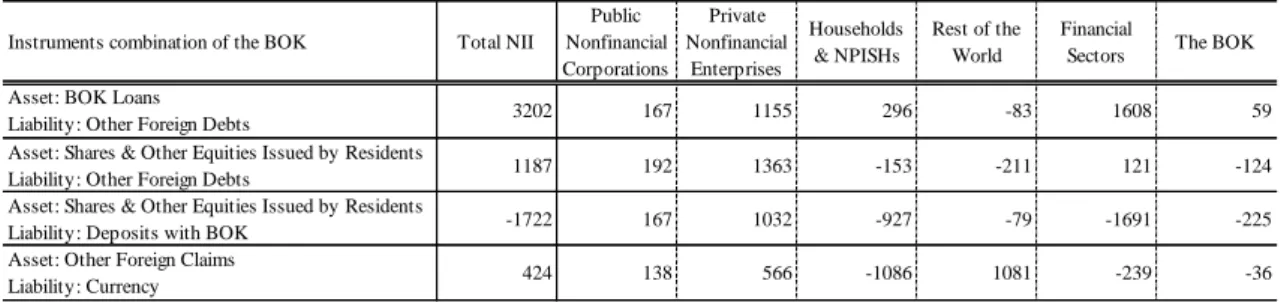
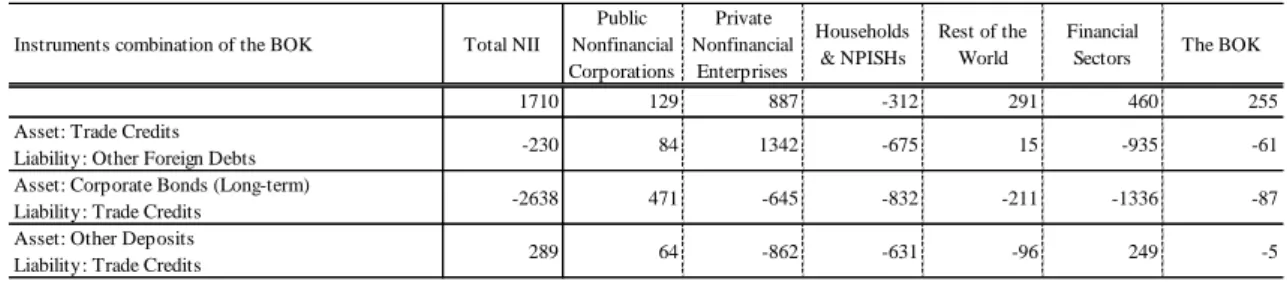
For example, Tables 5 and 6 show the NII, organized by selected financial instrument combinations, based on the results of Tables 3 and 4. The second row of Table 3 presents the financial instrument combinations that cause the greatest NII for the overall economy. The third row of tables indicate the biggest NII for the private non-financial economy. In contrast, the fourth and fifth rows show the smallest NII for the overall economy and for the private non-financial economy, respectively, in the same manner. The information listed in Figures 3 and 4 is useful for policy authorities seeking the best combination of financial measures.
[Tables 5 and 6 are inserted about here]
From this point of view, we can compare the forecasted NII from issuing MSBs and KTBs. In the previous section, the liability and asset portfolios of the BOK and the general government were given exogenously. The major financial instruments of the BOK are MSBs (general financial debentures in Figure 3) for liabilities and foreign claims20 for assets. On the other hand, shares of KTBs in the liability portfolio and government loans in the asset portfolio play a greater role for the Korean government. However, it is difficult to compare the ripple effects of the two sectors’ policies because the amounts of their liabilities and assets are not the same. Therefore, we measure the NII of MSBs and compare them to equivalent amounts of KTBs. For simplification, we select only one financial instrument for each simulation. First, we compute the NII when the BOK increases MSBs (short-term) by one unit in liabilities and one unit of other foreign claims in assets. Second, for the general government, one unit of KTBs (long-term) in liabilities and one unit of government loans are chosen. Each simulated NII is shown in Figure 34. The total NII of the Korean government is positive, while that of the BOK is negative. For non-financial enterprises, the combination of financial items of the
20 More precisely, these are the foreign exchange holdings for the 1968 and 1993 SNA. However, they are included
24
government is a greater NII than in the case of the BOK. However, the BOK induces a large NII for the foreign sector. Furthermore, induced savings by the BOK combination is more than treble that of the government. The amounts of induced investments and savings are different to those of the combinations of asset and liability instruments. These should be considered carefully by policymakers when implementing a new policy.
[Figure 34 is inserted about here]
V. Concluding Remarks
Since its establishment, the BOK has primarily used MSBs and foreign currency for its money market operations. In contrast, the issuance of KTBs was significantly smaller than that of MSBs until the 1990s. The Korean government was a surplus sector in the FOF accounts, even though most countries were showing a government deficit. However, the BOK had to pay bond interest on issued MSBs, which have the same yields as KTBs, which meant that profits of the BOK turned negative in the 2000s. Several researchers have pointed out the problems of using MSBs for money market operations.
In this study, we calculated the GIS, GII, and NII, decomposed by financial instruments and institutional sectors, in order to evaluate the operations implemented by the BOK and the Korean government. Changes in NII are also divided into two elements, namely the effects of mutations in the ALM and the effects of changes in the portfolio of each policy authority. In contrast to the Japanese case, analyzed in previous studies (Tsujimura and Tsujimura, 2006; Manabe, 2009), Korea shows interesting features. After the Asian financial crisis in 1997, the negative NII of the financial sectors induced by the central bank increased drastically. The sign of the total NII eventually turned negative, quite suddenly, during the period of credit card distress. However, the global financial crisis in 2008 was a turning point, when the NII of the financial sectors, and especially banks, switched to being positive. On the other hand, net investments induced by the Korean government have shown a steady increase. In addition, the effects of changes in the government portfolio have consistently been positive, except in 2008.
Furthermore, the NII of combinations of financial instruments were demonstrated using monetary or fiscal policy simulations. Selected combinations of financial measures for each
25
functions are quite different. There is an obvious contrast between the spreads of MSBs and KTBs. This method will provide useful indicators when policymakers need to select optimal amounts and types of financial instruments for open market operations.
For the future work, there are numerous possible new economic policies, applying and extending this analysis method. For example, Kim (2014) examined subdividing the non-financial private corporations sector into a chaebol sector, representing large-scale and family-run enterprises, and an “other private corporations” (small and middle size) sector. If we employ these reconstructed FOF accounts, along with the simulation methods described in the fourth section, we can obtain the optimal quantity of financial instruments as a proper financial policy in order to maximize the NII of small and medium-sized enterprises. Certainly, the NII of these enterprises will be a helpful indicator for policies related to these businesses. There is no doubt that policymakers will be able to refer these simulation results as indicators of policy evaluations.
◆References◆
Chung, Kyuil (2008) Household Debt, the Savings Rate and Monetary Policy: the Korean Experience, BIS Papers, No.46, pp.83-94.
Copeland, Morris A. (1952), A Study of Money flow in the United States, NBER.
Kang, Tae Soo and Ma, Guonan (2008) Household Debt: Implications for Monetary Policy and Financial Stability, BIS Papers, No.46, pp.95-106.
Kim, Jinyong and Kim, Yong-Cheol (2013) Financial crisis and a transmission mechanism of external shocks: The signaling role of the Korean Monetary Stabilization Bond,
Journal of Financial Stability, Vol.9, pp.682-694.
Kim, Jiyoung (2014) Financial Structure of South Korea's Chaebol and Flow-of-Funds Analysis, Pan Pacific Association of Input-Output Studies, the 25th Conference Reports, pp.93-97.
_________ (2016) “Inter Industry Analysis and Monetary Policy Evaluations in the Korean Flow-of-Funds Accounts,” IDE Discussion Paper, No.619.
26
Manabe, Masashi (2009) “Policy Evaluation of Public Insurance Institutions from the View Points of Flow of Funds,” Osaka University Discussion Papers In Economics and Business, No.09-25 (In Japanese)
Park, Chang-Gyun (2009) Consumer Credit Market in Korea since the Economic Crisis [ed. Takatoshi Ito and Andrew K. Rose] Financial Sector Development in the Pacific Rim, East Asia Seminar on Economics, Vol. 18, University of Chicago Press. Park, Won Am (1996) Financial Liberalization; The Korean Experience, [ed. Taketoshi Ito and
Anne O. Krueger] Financial Deregulation and Integration in East Asia, NBER-EASE Vol.5, pp.247-276.
Tsujimura, Kazusuke and Mizoshita, Masako (2002a) European Financial Integration in the Perspective of Global Flow of Funds, KEO Discussion Paper, No.72.
_________(2002b) Flow-of-Funds Analysis-Basic Technique and Policy Evaluation, Keio University Publication (in Japanese).
Tsujimura, Kazusuke and Tsujimura, Masako (2006) Does Monetary Policy Work under Zero-Interest-Rate?, Journal of Applied Input-Output Analysis, Vol.11 & 12, pp.49-72.
Valderrama, Diego (2004) After the Asian Financial Crisis: Can Rapid Credit Expansion Sustain Growth?, FRBSF Economic Letter, 2004-38.
27
Table 1. Liability and Financial Asset Portfolios of the BOK (1968 SNA, Unit: Bil. KRW)
Table 2. Flow of Funds Accounts in Korea
1975 1980 1985 1990 1995 2000 2005
Total Liabilities 1919 5647 15953 42005 66431 140327 283027
Currency 561 2039 3570 8145 17237 21336 26037
Deposits at BOK 799 1572 7262 5623 10127 6729 16942
Demand Deposits 13 65 15 69 140 174 269
Government Deposits at BOK 248 789 1276 7561 6875 11018 5917
Time & Savings Deposits 0 0 7 3 1 11 25
Non-resident Deposits 0 0 6 33 41 116 103
Repurchase Agreements (RPs) 0 0 0 2000 2000 5525 0
Financial Debentures (Short-term) 27 530 1900 17903 24247 64503 154574
Financial Debentures (Long-term) 0 0 0 0 4200 13464 21390
Government Loans 10 0 0 1 0 0 45700
Other Foreign Debts 242 598 1683 70 80 7698 771
Miscellaneous 20 55 236 600 1483 9754 11298
Total Financial Assets 1742 8900 20477 41166 69176 160449 261627
Repurchase Agreements (RPs) 0 0 0 20 0 147 0
Government & Public Bonds (Short-term) 0 0 0 1932 1642 0 0
Government & Public Bonds (Long-term) 11 11 0 2 0 3864 5254
Financial Debentures (Short-term) 0 0 0 220 0 0 0
Financial Debentures (Long-term) 10 0 0 0 427 674 0
Corporate Bonds 0 0 0 0 0 2000 143
Beneficiary Certificates 0 0 0 0 0 0 2506
BOK Loans 1453 3822 11708 11901 12049 8436 10202
Stocks 0 0 0 395 395 395 395
Equities Other Than Stocks 70 360 565 240 265 1165 1575
Foreign Exchange Holdings 94 4316 6870 10596 25315 121096 213051
Other Foreign Claims 75 16 147 393 583 1364 1287
Miscellaneous 29 375 1187 15467 28500 21308 27214
1968 SNA 1993 SNA 2008 SNA Institutional Sectors 9 sectors* 18 sectors** 23 sectors Financial Instruments 34 items 35 items 46 items
1975Q1-2005Q4 2002Q4-2013Q4 2008Q4-present (Quarterly/Annual) (Quarterly/Annual) (Quarterly/Annual)
* Five sectors on the BOK website, Economic Statistics System ** Available to extend to 22 sectors
28
Table 3. GII and GIS by Financial Instruments of the BOK in 2015 (Unit: Bil. KRW)
Instrument in Assets of the BOK Total GII
Public Non-financial Corporations Private Non-financial Enterprises Households & NPISHs Rest of the World Financial Sectors General Government BOK Loans 5680 187 1433 735 340 2649 337 Government Bonds 5330 235 1283 424 437 1624 1326 Other Foreign Claims 4666 170 1227 330 1281 1426 231 Shares & Other Equities Issued by Residents 3665 212 1640 285 211 1162 153 Instrument in Liabilities of the BOK Total GIS
Public Non-financial Corporations Private Non-financial Enterprises Households & NPISHs Rest of the World Financial Sectors General Government
Deposits with BOK 5387 45 608 1212 290 2853 379
Repurchase Agreements (RPs) 5022 49 633 1289 242 2453 356 General Financial Debentures (Short-term) 4965 37 518 1239 332 2470 369 General Financial Debentures (Long-term) 4955 40 490 1202 279 2488 456
Currency 4242 33 661 1417 199 1665 267
Government Deposits with BOK 4075 26 319 742 215 1447 1326 Other Foreign Debts 2478 21 278 438 423 1041 278
29
Table 4. GII and GIS by Financial Instruments of the General Government in 2015 (Unit: Bil. KRW)
Table 5. NII by Selected Financial Instruments combination of the BOK in 2015 (Unit: Bil. KRW) Instrument in Assets of the General
Government Total GII
Public Non-financial Corporations Private Non-financial Enterprises Households & NPISHs Rest of the World Financial Sectors * The Bank of Korea General Financial Debentures (Long-term) 5250 155 1241 636 565 2284 369 Depository Corporation Long-term Savings
Deposits 5240 158 1275 670 359 2660 117
M oney in Trust 5230 200 1126 449 353 2983 120
Depository Corporation Short-term Deposits 5228 154 1285 686 376 2602 126 Negotiable Certificates of Deposit (CDs) 5224 153 1306 702 389 2543 132 Depository Corporation Transferable
Deposits 5222 154 1289 687 386 2577 129
General Financial Debentures (Short-term) 5119 149 1203 538 690 2034 506 Asset-Backed Securities (Long-term) 5037 196 1409 549 265 2537 81 Investment Fund Shares 4963 192 1165 386 502 2578 139 Government Deposits with the BOK 4942 136 1040 284 1164 1242 1076 Financial Derivatives 4737 165 1128 435 706 2192 111 Other Foreign Claims 4092 139 1078 277 1288 1233 77 External Securities (Long-term) 4048 253 1074 369 784 1496 73 Shares Issued by Non-Residents 3957 136 1017 232 1527 983 62
Other Deposits 3931 172 853 344 268 2178 116
Government Loans 3913 312 1090 649 250 1530 81
Foreign Direct Investment 3833 128 1244 254 1042 1101 64
Trade Credits 3309 109 1695 273 290 889 53
Shares & Other Equities Issued by Residents 3301 192 1545 251 220 1038 55 Corporate Bonds (Long-term) 2557 563 1070 143 153 593 34 Instrument in Liabilities of the General
Government Total GIS
Public Non-financial Corporations Private Non-financial Enterprises Households & NPISHs Rest of the World Financial Sectors The Bank of Korea Trade Credits 5195 92 1715 975 364 1929 121 Financial Derivatives 5068 52 632 938 683 2500 263 Depository Corporation Loans 4583 39 544 1107 224 2575 94
BOK Loans 4346 28 420 927 187 1707 1076
Other Foreign Debts 4286 32 468 851 492 1783 659
Other Deposits 4032 33 469 1236 175 2056 63
Local government securities (Long-term) 3970 30 428 1110 157 2185 60 Shares & Other Equities Issued by Residents 3876 54 747 943 429 1579 125 Government Bonds (Long-term) 3540 25 354 948 275 1824 114 * Financial sectors other than the BOK.
Instruments combination of the BOK Total NII
Public Nonfinancial Corporations Private Nonfinancial Enterprises Households & NPISHs Rest of the World Financial
Sectors The BOK Asset: BOK Loans
Liability: Other Foreign Debts 3202 167 1155 296 -83 1608 59 Asset: Shares & Other Equities Issued by Residents
Liability: Other Foreign Debts 1187 192 1363 -153 -211 121 -124 Asset: Shares & Other Equities Issued by Residents
Liability: Deposits with BOK -1722 167 1032 -927 -79 -1691 -225 Asset: Other Foreign Claims
Liability: Currency 424 138 566 -1086 1081 -239 -36 * Financial sectors other than the BOK.
30
Table 6. NII by Selected Financial Instruments combination of the General Government in 2015 (Unit: Bil. KRW)
Figure 1. The Base Rate of the BOK and Inflation Rate Instruments combination of the BOK Total NII
Public Nonfinancial Corporations Private Nonfinancial Enterprises Households & NPISHs Rest of the World Financial
Sectors The BOK 1710 129 887 -312 291 460 255 Asset: Trade Credits
Liability: Other Foreign Debts -230 84 1342 -675 15 -935 -61 Asset: Corporate Bonds (Long-term)
Liability: Trade Credits -2638 471 -645 -832 -211 -1336 -87 Asset: Other Deposits
Liability: Trade Credits 289 64 -862 -631 -96 249 -5 * Financial sectors other than the BOK.
-3 -2 -1 0 1 2 3 4 5 6
Call Money Rates (Overnight) Bank of Korea Base Rate Inflation Rates (CPI) Inflation Rates (PPI)
31
Figure 2. KTB, MSB, and Foreign Exchange Holdings (End of the Year)
Figure 2-a. KTB, MSB, and Foreign Exchange Holdings (End of the Year, Enlarged)
* GTB: government & public bonds in liabilities of the general government ** M SB: financial debentures in liabilities of the BOK
*** Foreign exchange holdings: financial assets of the BOK. This financial item is aggregated in "other foreign claim" for 2008 SNA. 0 100000 200000 300000 400000 500000 600000 700000 1975 1976 1977 1978 1979 1980 1981 1982 1983 1984 1985 1986 1987 1988 1989 1990 1991 1992 1993 1994 1995 1996 1997 1998 1999 2000 2001 2002 2003 2004 2005 2006 2007 2008 2009 2010 2011 2012 2013 2014 2015 KTB (1968 SNA) KTB (1993 SNA) KTB (2008 SNA) MSB (1968 SNA) MSB (1993 SNA) MSB (2008 SNA)
Foreign Exchange Holdings (1968 SNA) Foreign Exchange Holdings (1993 SNA)
B il . K R W
* GTB: government & public bonds in liabilities of the general government ** M SB: financial debentures in liabilities of the BOK
*** Foreign exchange holdings: financial assets of the BOK 0 5000 10000 15000 20000 25000 30000 1975 1976 1977 1978 1979 1980 1981 1982 1983 1984 1985 1986 1987 1988 1989 1990 1991 1992 1993 1994 1995 1996 GTB (1968 SNA) MSB (1968 SNA) Foreign Exchange Holdings (1968 SNA)
B il . K R W