The innovation process of a privately-owned
enterprise and a state-owned enterprise in
China
著者
Kang Byeongwoo
権利
Copyrights 日本貿易振興機構(ジェトロ)アジア
経済研究所 / Institute of Developing
Economies, Japan External Trade Organization
(IDE-JETRO) http://www.ide.go.jp
journal or
publication title
IDE Discussion Paper
volume
470
year
2014-07-01
INSTITUTE OF DEVELOPING ECONOMIES
IDE Discussion Papers are preliminary materials circulated to stimulate discussions and critical comments
Keywords: China, Patent data, Privately-owned enterprise, State-owned enterprise JEL classification: L25, L96, O31
* Researcher, Technological Innovation and Economic Growth Studies Group, Inter-disciplinary Studies Center, IDE ([email protected])
IDE DISCUSSION PAPER No. 470
The Innovation Process of a Privately-Owned
Enterprise and a State-Owned Enterprise in
China
Byeongwoo Kang*
July 2014
Abstract
This study compares the innovation process of a privately-owned enterprise and a state-owned enterprise in China using their patent data. Huawei and ZTE were selected for this study because they experienced the same historical environment in the same industry from the same region in China leaving their owner types as their critical difference. This study investigates the difference in the innovation process in R&D between a privately-owned and a state-owned enterprise by analyzing (1) domestic and international patent application pattern, (2) co-application and co-applicants, (3) knowledge accumulation inside Huawei and ZTE, and (4) knowledge spillover to domestic and foreign firms.
The Institute of Developing Economies (IDE) is a semigovernmental, nonpartisan, nonprofit research institute, founded in 1958. The Institute merged with the Japan External Trade Organization (JETRO) on July 1, 1998.
The Institute conducts basic and comprehensive studies on economic and related affairs in all developing countries and regions, including Asia, the Middle East, Africa, Latin America, Oceania, and Eastern Europe.
The views expressed in this publication are those of the author(s). Publication does not imply endorsement by the Institute of Developing Economies of any of the views expressed within.
INSTITUTE OF DEVELOPING ECONOMIES (IDE), JETRO 3-2-2, WAKABA,MIHAMA-KU,CHIBA-SHI
CHIBA 261-8545, JAPAN
©2014 by Institute of Developing Economies, JETRO
No part of this publication may be reproduced without the prior permission of the IDE-JETRO.
1. Introduction
Recent years have witnessed an explosion of domestic and international patent filing by Chinese firms. According to a report by the World Intellectual Property Organization (WIPO) in 2011, ZTE Corporation and Huawei Technologies Co, Ltd, both Chinese telecommunication equipment manufacturers, ranked 1 and 3 respectively as Patent Cooperation Treaty (PCT) applicants (Table 1). This burst of Chinese patent filings has raised the question of whether this increase in patent applications in China reflects a growth in Chinese R&D capability. To answer this question, two studies sought to explain the recent surge of Chinese patent applications. Hu et al. (2009) found that China’s patent explosion can be attributed to the increase in foreign direct
investment (FDI) and patent system reform while the intensification of research and development (R&D) has had little effect. Then a recent study by Li (2012) found that a more significant reason has been the patent subsidy program by local governments.
Table 1. Published PCT International Applications by Top Five Applicants
2011 Ranking Applicant Country of
Origin
PCT applications published in 2011
1 ZTE Corporation China 2826
2 Panasonic Corporation Japan 2463
3 Huawei Technologies Co. Ltd China 1831
4 Sharp Kabushiki Kaisha Japan 1755
5 Robert Bosch Corporation Germany 1518
Source: WIPO (2011).
An interesting finding in Table 1 is that ZTE, a state-owned enterprise,
outperformed the other top applicants, all privately-owned enterprises, in terms of R&D. It is generally accepted that patenting correlates positively with R&D, although not every result of R&D is patented (Pakes et al., 1980). Since a privately-owned enterprise is aimed at profit maximization and a state-owned enterprise at purposes other than profit maximization, that finding is counterintuitive. R&D is a sunk cost spent for innovation. Without a system that protects an innovator from free riders, no one will invest such a sunk cost for R&D. The patent system bestows on the patent owner a legal monopoly for the use of the invention described in a patent document. Accordingly, a patent applicant is rewarded for its R&D sunk cost and can increase its profit.
That finding prompted the research questions examined in this study. Is this evidence that a state-owned enterprise can be more innovative than a privately-owned enterprise? And how does a state-owned enterprise perform differently from a
privately-owned one? To answer these questions, this study investigates how a
state-owned enterprise and a privately-owned one innovate.1 I chose ZTE and Huawei as representative of a state-owned and a privately-owned enterprise, respectively. Choosing appropriate research samples is very important for comparison because innovation pattern can be explained as the outcome of different technological regimes (Breschi et al., 2000; Lee et al., 2001). As will be discussed later in this study, Huawei and ZTE have almost the same history and operate in almost the same field of business in the same industry. Their one critical difference is ownership type. Thus, I assume that the difference in their innovation pattern is largely affected by the difference in their ownerships.
This study uses Huawei’s and ZTE’s patent data to compare their innovation process. Even if their patent filings are a result of non-R&D factors including the increase in FDI, patent system reform, and the patent subsidy program (Hu et al., 2009; Li, 2012), patent data provide valuable information for understanding the innovation process. Patent statistics (Griliches, 1990), statistical information retrieved from a large number of patent documents, is widely used to measure innovation performance.
The structure of this paper is as follows. The next section discusses previous literature on privately-owned and state-owned enterprises. Section 3 gives a brief overview of Huawei and ZTE. Section 4 presents the research data and shows the findings of this study. Section 5 discusses the findings. Section 6 concludes with remarks on the implications and the limitations of this study.
2. Literature Review
2.1 Corporate performance of state-owned enterprises and privately-owned enterprises There is a large accumulation of literature gathered over a long period of time discussing the corporate performance of state-owned and privately-owned enterprises, and much of this literature indicates that the former performs more poorly and
inefficiently than the latter (Boardman et al., 1989). For example, Majumdar (1998) evaluated the differences in the performance of government-owned, mixed, and private enterprises in India using the Annual Survey of Industries (ASI) for the period
1973-1974 to 1988-1989. He found that the government-owned enterprises performed the least efficiently while the mixed enterprises performed more efficiently and the private ones performed the most efficiently.
1 The National Bureau of Statistics of China classifies Chinese firms into six groups in terms of ownership (Appendix A). However, studies on China generally have classified them only as state-owned or privately-owned enterprises.
China’s case is no exception. Guan et al., (2009) showed that state-owned enterprises did not outperform privately-owned ones in that country. Considering that state-owned enterprises receive special support from the government, such as
acquisition of import and export rights, priority access to resources, and the use of distribution channel, their finding implied that innovation by state-owned enterprises is less effective than that of non-state-owned enterprises. In addition, a study by Pyke et al. (2000) conducted a survey comparing state-owned, collectively-owned, and
privately-owned enterprises in China. The study found that state-owned enterprises lag behind in the implementation of advanced manufacturing technologies and increasing production capability although most other indicators did not show significant difference among the three.
A theory explaining why state-owned enterprises show poorer corporate performance than privately-owned enterprises argues that, in general, state-owned enterprises cannot provide incentives to innovate and to reduce costs as much as privately-owned enterprises can (Shleifer, 1998). Since state-owned enterprises are owned by the state, politicians and bureaucrats use them for their political goals and for themselves. Politicians and bureaucrats give benefits such as job opportunities and business contracts to political supporters and contributors. Under such an environment, since decision making is not based on the market, it does not matter if an enterprise operates inefficiently. Thus, managers of state-owned enterprises avoid risks in an uncertain environment.
2.2. Role of the state-owned enterprises in China
A large amount of literature indicates that the corporate performance of state-owned enterprises is poorer than that of privately-owned ones. However, such criticism does not imply that every state-owned enterprise must be closed or privatized. It is not fair to compare privately-owned and state-owned enterprises merely in terms of corporate performances because privately-owned enterprises are aimed at profit
maximization while state-owned enterprises operate for the purposes of the government, such as maximizing the social welfare of a designated government organization.
China’s State-owned Assets Supervision and Administration Commission of the State Council (SASAC) is a commission that manages state-owned enterprises. SASAC evaluates the performance of the state-owned enterprises under its control and can appoint and remove managers. SASAC oversees 117 state-owned enterprises and supervises their management. Although the classification of these enterprises is not clear-cut, it helps to understand the roles of the state-owned enterprises in China. Below are three representative roles these enterprises play.
First, the state-owned enterprises serve in key industries such as electricity, oil, and steel. Many of the state-owned enterprises overseen by SASAC are run for this purpose. Examples are firms such as the China Power Investment Corporation, China National Offshore Oil Corporation, and China Datang Corporation.
Second, the state-owned enterprises take the initiative in areas that
privately-owned enterprises are unable or reluctant to enter but which are necessary for national development. Ventures in heavy industry require vast initial investment. For example, the China State Shipbuilding Corporation, China Shipbuilding Industry Corporation, and China First Heavy Industry fall into this category.
Third, state-owned enterprises serve as a coordinator to encourage knowledge diffusion from leading foreign firms to domestic firms. Building up technological capability to innovate and to compete with advanced foreign firms is a major concern for China. In fact, Alcatel-Lucent Shanghai Bell Co., Ltd., and Aviation Industry Corporation of China operate for this purpose (Fernandez et al., 2007; Szamosszegi et al., 2012).
2.3. History of state-owned and privately-owned enterprises in China
Despite the role they have played in the country’s economic growth, many of China’s state-owned enterprises have been privatized over the course of the country’s economic reforms (Chow, 2004; Kang et al., 2008; Li et al., 2008; Nee et al., 2007; Young, 1995; Yusuf et al., 2005). In this subsection, I briefly review the administrative history of the state-owned and privately-owned enterprises in China to understand how the environment surrounding firms in China changed.
China’s first attempt to create a framework for the modern corporation can be traced back to 1904 when a corporation law was passed. But when the People’s
Republic of China was established by the Communist Party in 1949, the law was nullified. Since the Communist Party represented the working class and private entrepreneurs were regarded as the capitalist economic class, privately-owned enterprises were strictly banned (In fact, private entrepreneurs were not allowed to obtain Communist Party membership until the Party’s sixteenth congress in 2002). The whole economy was run by state-owned enterprises in accordance with the plans of the central government. Thus, decision making in the state-owned enterprises was not market-driven (and remains less than fully market driven today).
A market economy started in China with the economic reforms that began in 1978 under Deng Xiaoping. Although private businesses were still heavily restricted, the State Council ratified the introduction of free markets in 1979. A big step was achieved in 1984 when the State Council promulgated enterprise reforms. Under these
reforms state-owned enterprises were granted autonomy. Henceforth they were allowed to retain some of their profit for investment purposes instead of remitting it all to the state. The reforms also began the privatization of state-owned enterprises. A market economy system with market-based price setting and resource allocation also started to spread rapidly. In 1993 China’s Company Law was enacted which called for the
maximization of owners’ interest as the primary goal of corporate practice. On the surface the enactment of the Company Law removed the government’s control over the state-owned enterprises.
As described above, a major component of China’s economic reform was giving the state-owned enterprises autonomy in production, marketing, and investment decisions rather than having them produce goods as planned by the government. However even after the reforms, scholars and other governments question whether China’s state-owned enterprises can have full autonomy and still have to submit to government intervention (Child et al., 1996; Rogers, 2012). In fact, state-owned enterprises even now sometimes choose state interests over market returns (Szamosszegi et al., 2012).
3. Huawei and ZTE2
Based on the above review of the literature on state-owned and
privately-owned enterprises, I assume that the innovation process of the former differs from that of the latter. Starting from this assumption, this study examines a state-owned and a privately-owned enterprise in a case study to understand the difference in
innovation process between the two.
I chose Huawei and ZTE for this case study for two reasons. First, they are in the China’s telecommunications industry. China has played “catch-up” in this industry, and it is generally accepted that it has been successful. In addition, China has built up a basis for long-term innovation in the industry (Lee et al., 2009). Second, prior studies (Harwit, 2007; Gao, 2011) have showed that Huawei and ZTE stand out among the players in China’s effort to catch up. Other representative companies in China’s
telecommunications industry have been Eastcom, Datang and Great Dragon. Eastcom’s strategy of merely buying foreign advanced technology without accumulating
technological capability did not increase its revenue (Gao, 2011). Datang had technological capability and was the main developer of Time Division Synchronous Code Division Multiple Access (TD-SCDMA), but the company failed to achieve
2 Most of the information profiling Huawei and ZTE comes from their webpages and
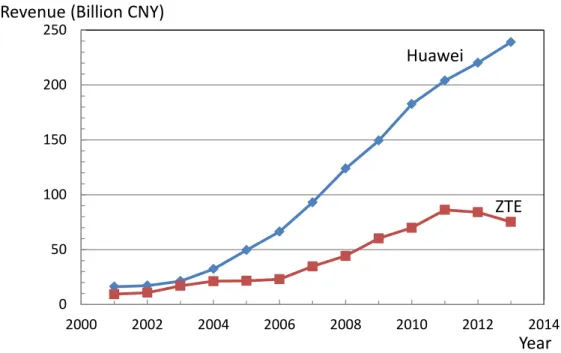
commercial success (Gao, 2011). Great Dragon, which became a conglomerate when the Chinese government decided to amalgamate domestic manufacturers into one in 1995, could not survive a price war initiated by domestic competitors (Harwit, 2007). Meanwhile, despite their short histories, Huawei and ZTE have achieved rapid growth in global markets (Figure 1).
Figure 1. Huawei’s and ZTE’s Growth in the 2000s
0 50 100 150 200 250 2000 2002 2004 2006 2008 2010 2012 2014 Year Revenue (Billion CNY)
Huawei
ZTE
(Source: GTA Data and Huawei’s and ZTE’s annual reports)
Huawei is a global telecommunications equipment manufacturer. It was founded by Ren Zhengfei in 1987 in Shenzhen. After working for the army and a state-owned enterprise, Ren started his business as a sales agent for a Hong Kong company producing private branch exchange (PBX) switches. The company achieved rapid growth, and today Huawei has become one of the top telecommunications
equipment suppliers. The company is famous for its active R&D. Nearly 50 per cent of all the employees are R&D staff. The shareholders of Huawei are the Union of Huawei Investment & Holdings Co., Ltd. and Ren; the former is wholly owned by Huawei’s employees, meaning that Huawei is owned by its employees.
ZTE also is a global telecommunications equipment manufacturer. ZTE was founded in 1985 in Shenzhen by a group of state-owned enterprises associated with China's Ministry of Aerospace. With the government seeing the need for more domestic companies to produce telecommunications switches, ZTE expanded its business into the telecommunications industry (Harwit, 2007). The largest shareholder is Shenzhen
Zhongxingxin Telecommunications Equipment Company Limited (Zhongxingxin), a state-owned shareholder (ZTE, 2013). ZTE claims its business model is a “state-owned and privately-managed (guo you si ying)” one (Harwit, 2007). Nevertheless, since the largest shareholder is a state-owned entity, it is natural to assume that ZTE’s
management is influenced by Zhongxingxin for governmental purposes.
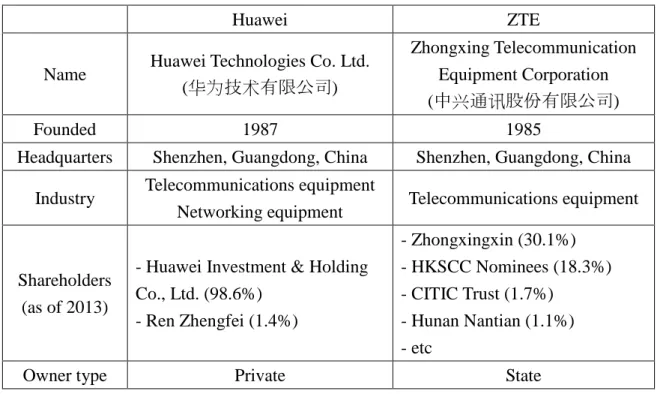
Information about Huawei and ZTE is summarized in Table 2. As can be seen, the two companies have almost the same history and operate in almost the same field of business with one critical difference: their type of ownership. Huawei is
privately-owned while ZTE is state-owned. As seen from their histories, Huawei and ZTE have experienced the same historical environment in the same industry within the same city, leaving their type of ownership as the critical difference. In the following analysis I examine whether the difference in their ownership type affected the difference in their innovation process.
Table 2. Information about Huawei and ZTE
Huawei ZTE
Name Huawei Technologies Co. Ltd. (华为技术有限公司)
Zhongxing Telecommunication Equipment Corporation (中兴通讯股份有限公司)
Founded 1987 1985
Headquarters Shenzhen, Guangdong, China Shenzhen, Guangdong, China
Industry Telecommunications equipment
Networking equipment Telecommunications equipment
Shareholders (as of 2013)
- Huawei Investment & Holding Co., Ltd. (98.6%) - Ren Zhengfei (1.4%) - Zhongxingxin (30.1%) - HKSCC Nominees (18.3%) - CITIC Trust (1.7%) - Hunan Nantian (1.1%) - etc
Owner type Private State
4. Data and Findings 4.1. Patent data
I examined the patent data that Huawei and ZTE submitted to the State Intellectual Property Office (SIPO) of the People’s Republic of China and to the US Patent and Trademark Office (US PTO) from the time of each company’s founding until 2012. I also examined PCT applications filed with SIPO during the same period. The
PCT is administered by the International Bureau of WIPO. Since the PCT enables a patent application filed with one patent authority to be effective with other patent authorities of PCT contracting states, companies doing business in global markets file many PCT applications.
The numbers of annual patent applications by Huawei and ZTE are shown in Tables 3-1 and 3-2, respectively. The patent application data held by SIPO indicates that Huawei started to apply for patents from 1995 and ZTE 1999. It took 8 years and 14 years respectively from their foundings for Huawei and ZTE to file their first patent applications. Although ZTE was established earlier than Huawei, it filed its first patent application later than Huawei. There are endogenous and exogenous explanations for this gap. An endogenous explanation is that ZTE did not have enough technological capability to conduct R&D; and even if it had, it did not have a culture for legally protecting its R&D output. An exogenous explanation is the social environment in China. As a communist country, private ownership of property has generally been prohibited. In addition, even if inventions by a state-owned enterprise are patented, the state makes decisions for the usage of the patent.3 Thus, firms in China, especially state-owned enterprises, were not motivated to actively apply for patents before China’s economic and political reforms.
The second columns in Tables 3-1 and 3-2 show the number of patent applications to SIPO. From 1999 Huawei’s and ZTE’s patent applications to SIPO increased rapidly and continuously until the late 2000s. This increase implies that their R&D activities increased, which in the case of ZTE is also supported by the increase in the number of its R&D employees in the 2000s. Considering that ZTE’s R&D staff accounts for about half of its employees (Figure 2), ZTE is being more aggressive in applying for patents than is Huawei. Since peaking around 2008/2009, the number of patent applications for both companies has been decreasing. An explanation for this drop could be the nature of the patent database. The Worldwide Patent Statistical Database (October 2012 edition) of the European Patent Office, the patent database used in this study, is constructed from the published patent documents. A patent
application to SIPO is published 18 months after the date of receipt of the application, if the applicant does not request early publication. Thus, the significant decrease from
3 The Patent Law of the People's Republic of China was amended to mandate in Article
14 the submission of prior art: “If an invention patent of a State-owned enterprise or institution is of great significance to national or public interests, upon approval by the State Council, the relevant competent department under the State Council or the people's government of the province, autonomous region, or municipality directly under the Central Government may decide to have the patent widely applied within an approved scope and allow the designated units to exploit the patent, and the said units shall pay royalties to the patentee in accordance with the regulations of the State.”
2010 is presumably due to the delay in the publication of patent applications.
The third and the fourth columns in Tables 3-1 and 3-2 show respectively the number of patent applications to the US PTO and the number of PCT applications. Interestingly, US applications and PCT applications by both Huawei and ZTE started from 2000. China’s accession to the World Trade Organization (WTO) in December 2001 probably made the Chinese firms consider to expand their business into the global market and accordingly, as a first step, file international patent applications.
Applications to the US PTO and PCT applications by both companies continued to increase until recently. For both firms, the ratio of PCT applications to applications to SIPO has been much higher than that of the US PTO applications to applications to SIPO. This is because the PCT application allows an applicant to delay up to 30 months after the first patent filing the making of any strategic decision, and hence the PCT applicant has a longer time to consider a strategic patent filing. As was seen with patent applications to SIPO, the number of US PTO and PCT applications has been decreasing. Presumably, as with the sharp drop in patent applications to SIPO, this is also due to the delay in publishing patent applications. The two tables show that in recent years Huawei had tended to file more patent applications than ZTE with the US patent office while ZTE has been filing more PCT applications than Huawei has.
Figure 2. Size of R&D Staff in Huawei and ZTE
0 10,000 20,000 30,000 40,000 50,000 60,000 70,000 2006 2007 2008 2009 2010 2011 2012 2013 2014 Year R&D employees Huawei ZTE
Table 3-1. Huawei’s Patent Applications Year CN US PCT US/CN (%) PCT/CN (%) 1987~1994 - - - - - 1995 5 - - - - 1996 11 - - - - 1997 17 - - - - 1998 22 - - - - 1999 86 - - - - 2000 181 1 8 0.6 4.4 2001 452 4 30 0.9 6.6 2002 1003 12 83 1.2 8.3 2003 1482 57 111 3.8 7.5 2004 2098 67 175 3.2 8.3 2005 3490 103 424 3.0 12.1 2006 5714 261 1177 4.6 20.6 2007 4601 343 1542 7.5 33.5 2008 4237 470 1870 11.1 44.1 2009 3030 597 1984 19.7 65.5 2010 2110 420 1364 19.9 64.6 2011 732 653 1706 89.2 233.1 2012 - 155 118 - - 1987 ~ 2012 29271 3143 10592
Table 3-2. ZTE’s Patent Applications Year CN US PCT US/CN (%) PCT/CN (%) 1985~1998 - - - - - 1999 2 - - - - 2000 19 - 2 - 10.5 2001 121 3 13 2.5 10.7 2002 215 2 43 0.9 20.0 2003 431 11 89 2.6 20.6 2004 525 21 187 4.0 35.6 2005 972 36 238 3.7 24.5 2006 2154 23 430 1.1 20.0 2007 4516 55 369 1.2 8.2 2008 4416 167 1150 3.8 26.0 2009 5832 365 3412 6.3 58.5 2010 3443 367 2099 10.7 61.0 2011 770 14 29 1.8 3.8 2012 - 3 - - - 1985 ~ 2012 23416 1067 8061
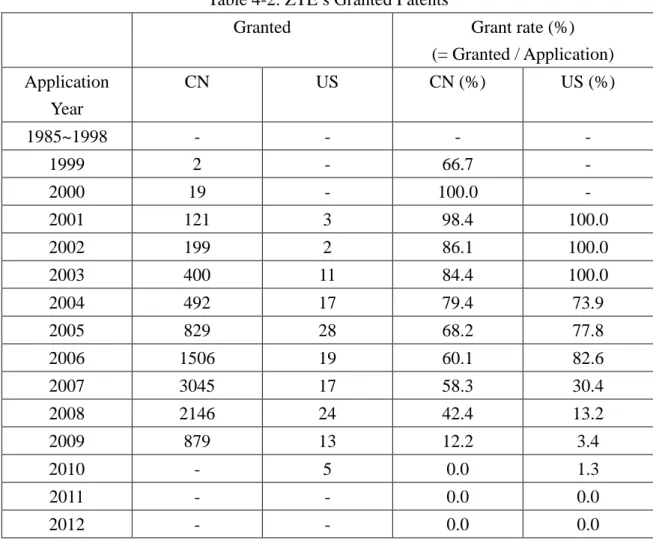
The numbers of patents granted annually to Huawei and ZTE per application year are shown in Tables 4-1 and 4-2, respectively. The grant rate in domestic and international patent applications has decreased as the 2000s have progressed. Assuming that there has been no change in the norm needed to examine patentability despite the boost in global patent applications, the rise in Huawei and ZTE patent applications should affect the quality of their invention. Huawei and ZTE has applied for patents without owning by disclosing knowledge before the knowledge is owned by competitors. This strategic behavior gives a degree of freedom for future R&D. The sharp drop in the grant rate of both firms in recent years presumably can be explained by the time lag for patent examination. The statistics are similar for both Huawei and ZTE showing no clear difference between the two in the rate of patents granted.
Table 4-1. Huawei’s Granted Patents
Granted Grant rate (%)
(= Granted / Application) Application Year CN US CN (%) US (%) 1987~1994 - - - - 1995 5 - 100.0 - 1996 10 - 58.8 - 1997 16 - 57.1 - 1998 20 - 80.0 - 1999 82 - 73.9 - 2000 171 - 88.1 0.0 2001 440 4 88.5 100.0 2002 946 11 80.4 91.7 2003 1316 54 77.5 91.5 2004 1790 62 75.1 92.5 2005 2816 75 70.1 72.8 2006 4016 156 57.1 59.1 2007 2638 191 42.3 55.2 2008 1755 193 28.3 40.6 2009 584 162 11.4 27.0 2010 125 73 3.5 16.6 2011 2 57 0.1 8.2 2012 - - 0.0 0.0
Table 4-2. ZTE’s Granted Patents
Granted Grant rate (%)
(= Granted / Application) Application Year CN US CN (%) US (%) 1985~1998 - - - - 1999 2 - 66.7 - 2000 19 - 100.0 - 2001 121 3 98.4 100.0 2002 199 2 86.1 100.0 2003 400 11 84.4 100.0 2004 492 17 79.4 73.9 2005 829 28 68.2 77.8 2006 1506 19 60.1 82.6 2007 3045 17 58.3 30.4 2008 2146 24 42.4 13.2 2009 879 13 12.2 3.4 2010 - 5 0.0 1.3 2011 - - 0.0 0.0 2012 - - 0.0 0.0
4.2. Co-applicants and inventors
Recent environmental changes such as shortened product life cycles, increasing technological complexities, and the increasing cost of R&D have made it necessary to utilize external knowledge sources. Collaboration with others is one channel to external knowledge sources. Collaboration with others appears as co-applications in the patent data. Table 5 shows the number of applicants and inventors in Huawei’s and ZTE’s patent applications to SIPO. For both firms, the number of applicants has slightly increased since their first patent applications. Until the mid 2000s, their patent
applications were filed only by themselves. Since 2004 and 2005, their co-applications have increased although the increase is slight. When the two companies are compared, Huawei has more co-applicants than ZTE has, implying that Huawei is more active in utilizing external knowledge sources. The number of inventors in both firms’ patent applications has also increased slightly with Huawei showing slightly more inventors than ZTE.
Table 5. Applicant and Inventor in Huawei’s and ZTE’s Patent Applications to SIPO Huawei ZTE Year Number of Applicants Number of Inventors Number of Applicants Number of Inventors 1987~1994 - - - - 1995 1. 1.800 - - 1996 1. 1.545 - - 1997 1. 1.882 - - 1998 1. 1.955 - - 1999 1. 2.093 1. 1. 2000 1. 1.895 1. 1.263 2001 1. 1.699 1. 1.405 2002 1. 1.506 1. 1.758 2003 1. 1.578 1. 1.710 2004 1.002 1.687 1. 2.109 2005 1.004 1.759 1.001 2.295 2006 1.011 1.964 1.002 2.283 2007 1.013 2.322 1.002 2.255 2008 1.021 2.607 1.002 2.150 2009 1.034 2.747 1.003 2.281 2010 1.015 2.427 1.005 2.230 2011 1.007 2.202 1.025 2.216
Figures 3-1 and 3-2 show the share of Huawei and ZTE co-applicants by type. Huawei (Figure 3-1) has had 56 co-applicants in total; these have been 29 universities, 19 domestic firms, 5 foreign firms, 1 national institute and 8 individuals. Universities account for slightly over 50 per cent of all the co-applicants. This indicates that Huawei is active in university-industry collaboration (UIC). Meanwhile ZTE (Figures 3-2) has had 32 co-applicants in total: 7 universities, 15 domestic firms, 1 foreign firm, 4 national institutes, and 5 individuals. The domestic firms among ZTE’s co-applicants account for nearly 50 per cent of all the co-applicants. Further analysis of whether collaboration with ZTE has helped these domestic firms innovate beyond the knowledge they received from ZTE will be presented in subsection 4.3.
The figures show that ZTE has more collaboration with national institutes. While Huawei has collaborated with only one such institute (1.8 per cent), ZTE has collaborated with four (12.5 per cent). This greater collaboration with national institutes
implies that ZTE is an important partner for these institutes. ZTE being a state-owned enterprise could be a factor for this greater collaboration. However, because of the lack of data, it is difficult to gauge how ZTE is involved in collaboration with the national institutes.
Figure 3-1. Huawei’s Co-applicants in Patent Applications to US PTO
Universities (29) Domestic Firms (13) Individuals (8) National Institutes (1) Foreign Firms (5) Total of 56 co-applicants
Figure 3-2. ZTE’s Co-applicants in Patent Applications to US PTO
Universities (7) Domestic Firms (15) Individuals (5) Foreign Firms (1) National institutes (4) Total of 32 co-applicants
Figures 4-1 and 4-2 show the share of the co-applications per each co-applicant type shown in Figures 3-1 and 3-2. Huawei co-applied for 491 patents: 437 with
universities, 34 with domestic firms, 11 with foreign firms, 1 with a national institute, and 8 with individuals. Universities accounted for 89.0 per cent (= 437 / 491 × 100) of all co-applications. Although co-applicants other than universities made up nearly 50 per cent of Huawei’s co-applicants, its collaborations with these co-applicants
accounted for only 11.0 per cent (= 54 / 491 × 100) of Huawei’s co-applications. Thus, Huawei’s collaboration is concentrated in universities. This may be because Huawei is the leading domestic firm in the telecommunications industry, and it is difficult for
Huawei to find firms qualified for collaboration. In the case of ZTE, its rate of co-applications has been far less, numbering 75 compared to Huawei’s 491; 32 have been with universities, 27 with domestic firms, 1 with a foreign firm, 10 with national institutes, and 5 with individuals. The distribution of ZTE’s collaboration has been more than Huawei’s. Universities and domestic firms have been ZTE’s largest collaborators. Figure 4-2 again confirms that ZTE’s collaboration with the national institutes is not insignificant. While Huawei filed one patent application with one national institute, ZTE filed 10 patent applications with four national institutes, which accounted for 13.3 per cent of its co-applications, further confirming that ZTE is an important partner for the national institutes in China.
Figure 4-1. Huawei’s co-applications to US PTO
Universities (437) Total of 491 co-applications Foreign Firms (11) Individuals (8)
National institutes (1) Domestic Firms (34)
Figure 4-2. ZTE’s co-applications to US PTO
Universities (32) Domestic Firms (27) Foreign Firms (1) Individuals (5) Total of 75 co-applications National Institutes (10)
4.3. Knowledge accumulation
This section analyzes knowledge accumulation by Huawei and ZTE. This accumulation comes from internal as well as external knowledge sources, and this accumulated knowledge contributes to a firm’s ability to innovate (Svetina, 2008). The internal accumulation of knowledge is a process by which a firm shapes a portfolio of core competencies (Prahalad et al., 1990). Core competencies are a firm’s collective knowledge about ‘how to coordinate diverse production skills and technologies.’ A firm’s internal knowledge source correlates to its absorptive capacity (Cohen et al., 1990). Absorptive capacity is defined as ‘the ability of a firm to recognize the value of new, external information, assimilate it, and apply it to commercial ends.’ Both core competency and absorptive capacity are known as keys for a firm to innovate. Accordingly, the accumulation of knowledge can be considered as an important requisite for innovation.
I conducted a patent citation analysis to measure Huawei’s and ZTE’s
knowledge accumulation. Patent citation analysis is widely used to measure knowledge flow (Jaffe et al., 2002). The interpretation of patent citations is such that if patent A cites patent B, knowledge flows from B to A. To measure knowledge accumulation, I calculated the proportion of patent citations filed by the same applicant (self citation).
To conduct the citation analysis, I relied on patent applications to the US PTO. This is because of the unavailability until recently of patent citations in patent
applications to SIPO.4 When applying to the US PTO, patent applicants must disclose the prior art behind an invention. Failure to disclose all prior art results in no patent being granted. Consequently, patent applications to US tend to have more patent citations than those to other patent authorities. However, there is a limitation in using patent citations. A significant proportion of citations in a patent application to a patent authority come from domestic references of the patent authority (Michel et al., 2001). Accordingly, readers need to be aware that in this study a significant number of citations in a patent may come from US references.
The results of the citation analysis are shown in Figure 5. The figure shows that Huawei and ZTE have grown increasingly reliant on internal knowledge (internal knowledge source) for patents. Until 2002 Huawei relied entirely on the knowledge received from external sources for its patents. Thereafter accumulated internal
4 At the 6th Meeting of the Standing Committee of the Eleventh National People's
Congress on December 27, 2008, Article 36 of the Patent Law of the People's Republic of China was amended to mandate the submission prior art: “When an applicant for an invention patent requests substantive examination, he shall submit the reference materials relating to the invention existing prior to the date of application.”
knowledge began to become a source, and in 2009, 13 per cent of Huawei’s patents relied on knowledge obtained within itself. Although the knowledge flow from external sources still predominates, knowledge has accumulated within Huawei and this
accumulated knowledge has assisted Huawei’s growth. The company’s knowledge dependence has fluctuated in recent years, but the trend of Huawei’s knowledge reliance has been increasing on its own internal source. Meanwhile, ZTE’s patents until 2003 also relied entirely on the knowledge received from external sources. Thereafter reliance on internal knowledge for patents gradually increased. In 2009, 6 per cent of ZTE’s patents relied on knowledge obtained within. However, ZTE’s reliance on internal knowledge for patents has increased less than it has for Huawei.
Figure 5. Self-citation Ratio
Year Self Citation Ratio (%)
Huawei
ZTE
4.4. Knowledge spillover to domestic and foreign firms
The previous subsection measured knowledge accumulation by counting Huawei’s and ZTE’s self citations. This subsection measures knowledge spillover from Huawei and ZTE to others by focusing on applicants whose patent applications cite Huawei’s and ZTE’s patent applications; i.e., self citations are excluded for the analysis in this subsection. I used applications to the US patent office for the same reason as cited in the last subsection. Thus, this analysis also contains a US bias.
The results are shown in Table 6. The left side of the table show those for Huawei, the right side for ZTE. A total of 1106 patent applications to the US PTO cited Huawei’s patent applications, and they were filed from 25 different regions. The most applicants, more than 40 per cent of them, were from the US, followed by applicants from Japan (12.2 per cent) then Korea (10.9 per cent). Applicants from China accounted
for only 7.4 per cent. For ZTE a total of 332 patent applications to the US PTO cited ZTE’s patent applications, and they were filed from 17 different regions. Interestingly, the most applicants (nearly 40 per cent) were from China; those from the US were next. In absolute patent count, ZTE is higher with 126 compared to Huawei’s 83. This
indicates that there is a significant knowledge flow from ZTE to domestic firms (a point that will be further analyzed in this subsection). The results in Table 6 imply that
Huawei’s technology is highly and globally valued by others when focusing on the number of Huawei’s forward citations compared to that of ZTE’s,5 but as a knowledge input, ZTE’s patents seem to be contributing more to Chinese domestic firms’ future R&D.
Table 6: Top Five Regions of Origin for Applicants Seeking US patents That Cited Huawei’s and ZTE’s Patent Applications
Huawei ZTE’s
Regional Origin Patent
count Ratio Regional Origin Patent count Ratio
US 485 43.5 % China 126 38.0 % Japan 136 12.2 % US 89 26.8 % Korea 122 10.9 % Korea 33 9.9 % China 83 7.4 % Japan 30 9.0 % Taiwan 57 5.1 % Taiwan 20 6.0 % Other* (20 countries) 233 20.9 % Other** (12 countries) 34 10.2 % *
Other included Canada (46), Sweden (41), France (36), Finland (26), Germany (26), Israel (9), and Spain (9).
**
Other included Canada (14), Sweden (7), Finland (3), and the Netherlands (2).
Analyzing more closely who in China are using Huawei’s and ZTE’s patents for their future R&D, Figures 6-1 and 6-2 show the results for Huawei and ZTE, respectively. Eighty-three of the US patents shown in Table 6 cited Huawei patents and were filed by 19 firms. The largest share, accounting for 37.3 per cent (= 31 / 83 × 100) of the filings, was by ZTE. Seven patents each were filed by DaTang, H3C, China
5 More precisely speaking, the technological value of a patent can be better measured
by dividing the number of forward citations by the average number of forward citations from the same application year and technological category (Jaffe et al., 2002; Nagaoka et al., 2010). But since Huawei and ZTE have a similar patent application history in the same industry, I assume that normalization will not change the findings.
Iwncomm, and Utstarcom Telecom. On the other hand, 126 of the US patents in Table 6 that cited ZTE were filed by 9 firms. The largest share, 89.7 per cent (= 113 / 126 × 100), was filed by Huawei. The remaining 13 patents were filed by 8 firms. The results
presented here show that ZTE’s patent output as a knowledge source for China’s domestic R&D is by and large being absorbed by one company, Huawei. On the other hand, although Huawei’s patent output as a knowledge source for domestic R&D has been less than ZTE’s, its effect has spread to a wider distribution of firms (although ZTE has been the largest absorber). Figures 6-1 and 6-2 confirm that Huawei and ZTE are the most significant citers of each other’s patents, that they are the two leading firms in China’s telecommunications sector, as indicated by other studies (Harwit, 2007; Gao, 2011), and that their knowledge has become interdependent.
A comparison between Huawei’s and ZTE’s R&D collaborators and the absorption of knowledge from Huawei’s and ZTE’s R&D output by these collaborators reveals that the co-applicants of both companies (shown in subsection 4.2.) scarcely cited Huawei’s or ZTE’s patent applications. This implies that collaboration with Huawei and ZTE does not promote knowledge spillover from them to their collaborators.
Figure 6-1. Chinese Patent Applicants That Cited Huawei’s Patent Applications
ZTE (31) DaTang (7) H3C (7) Total of 83 patent applications China Iwncomm (7) Utstarcom Telecom (7) Other 14 firms (28)
Figure 6-2. Chinese Patent Applicants That Cited ZTE’s Patent Applications Huawei (113) Total of 126 patent applications Other 8 firms (13) 5. Discussion
The findings of this study can be summarized as follows:
(1) Huawei: This study used Huawei as a representative of China’s privately-owned enterprises. The study used patent statistics as a proxy indicating innovation (Griliches, 1990), and these supported the argument that Huawei is an innovative actor. The number of its patent applications to domestic and foreign authorities is growing; the company’s internal knowledge is accruing; and spillover of this knowledge is going to both domestic and foreign firms. Huawei’s R&D output has functioned as a knowledge input for various domestic firms to conduct future R&D. This study also found that Huawei has been very active in UIC. This is attributable to Huawei being a leading domestic firm in its field making it hard to find qualified firms as collaborators.
(2) ZTE: This study used ZTE as a representative of China’s state-owned enterprises. Although the number of its patent applications to domestic and foreign authorities has increasing rapidly, other patent statistics used in this study did not support ZTE as an innovative actor. More specifically, ZTE’s knowledge accumulation has not been as great as Huawei’s. The knowledge absorption of ZTE’s R&D output has been concentrated in Huawei. Nevertheless, this study indicates that ZTE is an important partner for national institutes. However, lack of data prevented an examination of how ZTE has contributed to collaboration with these institutes.
Based on the foregoing findings and discussion, the answer to the research questions posed in this study is that the capacity of China’s state-owned enterprises to innovate has essentially not outperform that of the privately-owned enterprises. It is something of a surprise that in recent years ZTE has filed more domestic and international patent applications than Huawei given that ZTE has only about half as
many R&D employees as Huawei. This recent increase in filings may give ZTE the image of being more "innovatively productive" than Huawei. However, when
comparing the statistics for ZTE’s patent applications with those for Huawei and other companies, ZTE’s recent boost in patent applications gives the impression of a company that has a great interest merely in patent filing per se.
What has motivated ZTE to greatly boost its patent filing? One typical reason is competition in a patent race that has become global. This race is being sustained by a belief that a stronger intellectual property rights policy encourages innovation, and in this race, filing patent applications, whether these applications are granted or not, is an important tactic. As other companies have been doing, by applying for patents
regardless of patentability, ZTE as a follower is now trying to make its knowledge known to the public before such knowledge is exclusively owned by other competitors, especially leaders. The intent is to prevent competitors from impinging on ZTE’s future R&D. This behavior gives a degree of freedom for future R&D and protects it from being narrowed down. However, there could be other reasons specifically for ZTE’s behavior, such as CEO leverage over company contracts by exhibiting ZTE’s
performance to the government. Whatever the case, one cannot help but presume that the recent jump in ZTE’s patent has not been accidental.
The results of this study present implications for researchers and policy makers. First, new indicators are needed to measure the performance of the state-owned
enterprises. Prior studies have measured the performance of state-owned enterprises using conventional corporate indicators, concluding that these enterprises perform inefficiently. However, since state-owned enterprises are not aimed at profit maximization, it is not fair to evaluate them only with indicators used to evaluate privately-owned enterprises. The contributions of state-owned enterprises are sometimes difficult to measure. Thus, new indicators need to be introduced to fairly evaluate state-owned enterprises.
Second, this study presented evidence that ZTE’s R&D output has been absorbed primarily by Huawei. This implies that in this case the knowledge created by the state-owned enterprise is valuable, and the privately owned domestic champion in the industry uses this knowledge as an input for future R&D. However, this study also shows that there are not enough innovating actors in the industry that can absorb the knowledge and create economic value based on it. Thus, this study suggests that the government devise policy to nurture innovating actors that can utilize the existing knowledge for innovation.
Lastly, this study provides an implication for developing countries. A report by WIPO (2011) showed that 92% of all international patent applications are from 15
advanced countries, implying that knowledge is monopolized by the advanced countries. Using such knowledge is not free. Thus, policy makers in developing countries,
especially those trying to achieve knowledge-based economic growth, will have to find leverage for getting access to monopolized knowledge.
6. Conclusion
This study presented an empirical analysis of Huawei and ZTE, the two major enterprises in China’s telecommunications industry, using their patent data. The study first reviewed the prior research gone on the corporate performance of China’s
privately-owned and state-owned enterprises, and the social background and economic reforms that these enterprises faced. After this review, patent data was used to
investigate Huawei’s and ZTE’s innovation process. Four aspects of this process were analyzed: (1) domestic and international patent application pattern, (2) co-application and co-applicants, (3) knowledge accumulation inside of Huawei and ZTE, and (4) knowledge spillover to domestic and foreign firms.
However, this study is not without limitations. One is its assumption that the difference in Huawei’s and ZTE’s innovation is largely affected by the difference in their type of ownership. Nevertheless, these two companies are good representatives for comparing publically and privately owned enterprises in China. As pointed out, both are major players in the same industry, are operating in the same location, have experienced the same historical changes, and both have shown successful growth since founding. In addition, up-to-date data is availability for both companies; the data is suitability for examining the research questions; and various information sources are available to support or refute the findings. However, some of the study results may derive from factors other than the difference in ownership type. For example, as of 2013, Huawei had more than twice as many employees, 150,000 to ZTE’s 70,000.6 One might assume that this difference would give Huawei twice the resources of ZTE. Future research can elaborate further on the present study to remove the effect, if any, of this difference.
An agenda for future research will be to test the findings in this study in a quantitative manner using a larger sample of firms. Despite the limitation mentioned above, this case study of Huawei and ZTE provides valuable hints which can be the base for the next study, one that expands the analysis via quantitative research to other companies to test if the findings of this study are applicable to other cases.
Appendix A
The National Bureau of Statistics of China classifies Chinese firms into six groups in terms of ownership: State-owned enterprises, collectively-owned enterprises, shareholding enterprises, Hong Kong-Macau-Taiwan funded enterprises, foreign funded enterprises, and other. The definitions of these enterprises, as stated by the National Bureau of Statistics of China, are shown in Table A1.
Table A1. Firm classification in terms of ownership (1) State-owned
enterprises
Enterprises where the means of production or income are owned by the state.
(2)
Collectively-owned enterprises
Enterprises where the means of production are owned
collectively, including urban and rural enterprises invested by collectives and some enterprises.
(3) Shareholding Corporations Ltd.
Economic units registered in accordance with the regulation of the People’s Republic of China on the Management of
Registration of Corporate Enterprises, with total registered capitals divided into equal shares and raised through issuing stocks.
(4) Hong Kong-Macau-Taiwan
funded enterprises
Enterprises registered as the joint-venture, cooperative, sole (exclsive) investment industrial enterprises and limited liability corporations with funds from Hong Kong, Macao, and Taiwan.
(5) Foreign Funded Enterprises
Enterprises registered as the joint-venture, cooperative, sole (exclsive) investment industrial enterprises and limited liability corporations with foreign funds.
(6) Other
Other enterprises (units) including private enterprises, joint-owned enterprises, share-holding economy, foreign-funded enterprises, enterprises funded by the entrepreneurs from Hong Kong, Macao and Taiwan, etc.
Source: National Bureau of Statistics of China: 13. Industry in “Classifications & Methods”
Reference
Boardman, A. E., & Vining, A. R. (1989) Ownership and performance in competitive environments: A comparison of the performance of private, mixed, and state-owned enterprises, Journal of Law and Economics 32(1), 1-33.
Breschi, S., Malerba, F., & Orsenigo, L. (2000) Technological regimes and
Schumpeterian patterns of innovation, Economic Journal 110(463), 388-410.
Child, J., & Yuan, L. (1996) Institutional constraints on economic reform: The case of investment decisions in China, Organization Science 7(1), 60-77.
Chow, G. C. (2004) Economic reform and growth in China, Annals of Economics and Finance 5(1), 127-152.
Cohen, W. M. & Levinthal, D. A. (1990) Absorptive capacity: A new perspective on learning and innovation, Administrative Science Quarterly 35(1), 128-152.
Fernandez, J. A., & Fernandez-Stembridge, L. (2007) China’s State-Owned Enterprise Reforms: An industrial and CEO approach, Routledge.
Gao, X. (2011) Effective strategies to catch up in the era of globalization’ Experiences of local Chinese telecom equipment firms, Research-Technology Management 54(1), 42-49.
Griliches, Z., (1990). Patent Statistics as Economic Indicator: A Survey, Journal of Economic Literature 28(4), 1661-1707.
Guan, J. C., Yam, R. C.M., Tang, E. P.Y., & Lau, A. K.W. (2009) Innovation strategy and performance during economic transition: Evidence in Beijing, China, Research Policy 38, 802-812.
Harwit, E. (2007) Building China’s telecommunications network: Industrial policy and the role of Chinese state-owned, Foreign and private domestic enterprises, The China Quarterly 190, 311-332.
Hu, A. G., & Jefferson, G. H. (2009) A great wall of patents: What is behind China’s recent patent explosion?, Journal of Development Economics 90, 57-68.
Jaffe, A. B., & Trajtenberg, M. (2002) Patents, Citations & Innovations: A Window on the Knowledge Economy. MIT Press.
Kang Y., Shi, L., & Brown E. D. (2008) Chinese Corporate Governance – History and Institutional Framework, Rand
Lee., K., & Lim, C. (2001) Technological regimes, catching-up and leapfrogging: findings from the Korean industries, Research Policy 30, 459-483.
Lee., K., Cho S.-J., & Jin, J. (2009) Dynamics of catch-up in mobile phones and
automobiles in China: sectoral systems of innovation perspective, China Economic Journal 2(1), 25-53.
Li, H., Meng, L., Wang, Q., & Zhou, L.-A. (2008) Political connections, financing and firm performance: Evidence from Chinese private firms, Journal of Development Economics 87, 283-299.
Li, X. (2012) Behind the recent surge of Chinese patenting: An institutional view, Research Policy 41, 236-249.
Majumdar, S. K. (1998) Assessing comparative efficiency of the state-owned, mixed, and private sectors in Indian industry, Public Choice 96, 1-24.
Michel, J., & Bettels, B. (2001) Patent citation analysis: A close look at the basic input data from patent search reports, Scientometrics 51(1), 185–201.
Nagaoka, S., Motohashi, K., & Goto, A. (2010) Patent Statistics as an Innovation Indicator, in Hall, B.H, Rosenberg, N., (Eds), Handbook of the Economics of Innovation, Volume 2, Academic Press, 1083-1128.
Nee, V., Opper, S, & Wong, S. (2007) Developmental state and corporate governance in China, Management and Organization Review 3(1), 19-53.
Pakes, A., & Griliches, Z. (1980) Patents and R&D at the firm level: A first report, Economic Letters 5, 377-381.
Prahalad, C. K. & Hamel, G. (1990) The core competence of the corporation, Harvard Business Review 68(3), 79-91.
China: A survey of state-, collective-, and privately-owned enterprises, European Management Journal 18(6), 577-589.
Rogers, M. (2012) Investigative report on the U.S. national security issues posted by Chinese telecommunications companies Huawei and ZTE, 112th Congress, U.S. House of Representatives. Available at:
https://intelligence.house.gov/sites/intelligence.house.gov/files/documents/Huawei-ZTE%20Investigative%20Report%20(FINAL).pdf
Shleifer, A. (1998) State versus private ownership, Journal of Economic Perspective 12(4), 133-150.
Svetina A. C. & Prodan, I. (2008) How internal and external sources of knowledge contribute to firms’ innovation performance, Managing Global Transitions 6(3), 277-299.
Szamosszegi, A., & Kyle, C. (2012) An Analysis of State-Owned Enterprises and State Capitalism in China, in Harris, R., & Martin, W. K., (Eds), State-Owned
Enterprises and State Capitalism in China, Nova Science Publishers, Inc., 1-119.
WIPO (2011) “International patent filings set new record in 2011”, Available at http://www.wipo.int/pressroom/en/articles/2012/article_0001.html#annex1 (Last access: 10/06/2014)
Young, S. (1995) Private Business and Economic Reform in China, M.E. Sharpe, New York.
Yusuf, S., Nabeshima, K., & Perkins, D. H. (2005) Under New Ownership: Privatizing China’s State-Owned Enterprises. Stanford, CA: Stanford University Press.
ZTE (2013) Annual Report 2013, (Available at:
http://wwwen.zte.com.cn/en/about/investor_relations/corporate_report/annual_repo rt/201404/P020140408599365909862.pdf)