Bank capital and bank lending in the
Indonesian banking sector
著者
Hamada Miki
権利
Copyrights 日本貿易振興機構(ジェトロ)アジア
経済研究所 / Institute of Developing
Economies, Japan External Trade Organization
(IDE-JETRO) http://www.ide.go.jp
journal or
publication title
IDE Discussion Paper
volume
662
year
2017-03
INSTITUTE OF DEVELOPING ECONOMIES
IDE Discussion Papers are preliminary materials circulated to stimulate discussions and critical comments
Keywords: Bank capital, Bank capital channel, Bank lending channel, Indonesia JEL classification: G21, G30, N25
*Development Studies Center, Institute of Developing Economies, [email protected]
IDE DISCUSSION PAPER No. 662
Bank capital and bank lending in the
Indonesian banking sector
Miki Hamada
*March 2017
Abstract
We used bank-level data of Indonesian commercial banks to examine the role of bank capital in bank lending. Indonesian commercial bank capitalization has improved with the implementation of bank restructuring programs after the Asian financial crisis. The capital adequacy ratio has returned to a sound level; however, bank loan disbursement continues to remain low. We examine the bank lending channel in Indonesian banks and investigate the effects of monetary policy on bank lending through bank capital. The results indicate that a well-capitalized bank can increase its provisions of bank loans while still not responding to monetary policy, excepting non-forex banks.
1. Introduction
Bank capitalization is an important issue in monetary policy; however, traditional monetary theory has largely ignored the role of bank equity (Van den Heuvel 2002). In research on monetary policy transmission mechanisms, two types of views have emerged: one is the money view, which emphasizes the effects of monetary instruments like interest rates, and the other is the credit view, which places importance on bank credit. The latter is also called the bank lending channel which focuses on the effects of bank provision on bank lending. In the bank lending channel, bank equity is less considered for bank lending. It was only recently that bank equity has been taken into account in the context of the “bank lending channel” (Kishan and Opiela 2000, Gambacorta and Mistrulli 2004). In contrast, the bank capital channel focuses on the effects of bank capital on bank lending. Both channels are derived from the failed Modigliani-Miller theorem for banks. In a Modigliani-Miller world of perfect capital markets, a bank’s lending decisions are independent of its financial structure. Because the bank will always be able to finance any profitable lending opportunities, the level of bank capital is irrelevant to lending. In the bank lending channel if all banks always have sufficient liquidities, there is no lending channel, and in the bank capital channel, the risk-based capital requirements of the Basle Accord and an imperfect market for bank equity are prerequisite.Those conditions imply a failure of the Modigliani-Miller logic for the bank (Van den Heuvel 2002).
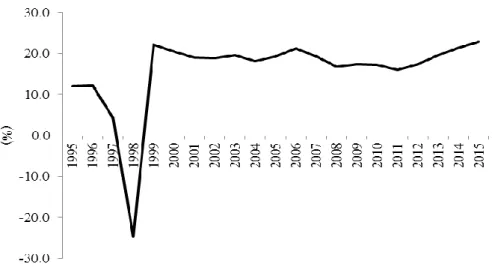
In Indonesia, after the Asian financial crisis from 1997–1998, the capital adequacy ratio (CAR) sharply declined to -24.6% due to the heavy devaluation of rupiah following the crisis (Figure 1). At that time, most of the Indonesian commercial banks fell into capital deficits—restructuring programs were implemented, and ailing banks were either bailed out or liquidated. Bank capital has since recovered to an adequate level; however, while the soundness of banks has recovered, bank lending remains low. Against this background, we focus on bank capital and examine the relationship between bank capital and bank lending. The purpose of this paper is to address the question empirically whether the capital level of a bank affects bank lending.
The remainder of the article is organized as follows. Section 2 explains the related literature on bank lending and bank capital. Section 3 describes the Indonesian banking sector structure and monetary policy. Section 4 discusses the empirical analysis, data, models, and results. Section 6 concludes.
Figure 1: Capital adequacy ratio (CAR) 1995–2015
Source: Bank Indonesia, Indonesian Financial Statistics.
2. Related literature
Recent research on bank capital focuses on the capital buffer, which is the difference between the CAR and the minimum Basel capital requirement; it investigates the relationship between capital buffers and business cycles. Some studies have pointed out the pro-cyclical relationship between the business cycle and the capital buffer, indicating a negative relationship between the two (Ayuso, Pérez and Saurina 2004, Stolz and Wedow 2011, Jokipii and Milne 2008, Francis and Osborne 2009). Other studies found a counter-cycle with a positive relationship (Bikker and Metzemakers 2005, Jokipii and Milne 2008, Lai and Konishi 2014).
Diverging from the subject of business cycles, role of bank capital as lending channel are investigated (Kishan and Opiela 2000, Van den Heuvel 2002, Gambacorta and Mistrulli 2004, Kishan and Opiela 2006). In the bank lending channel theorem the effects of reserve requirements on demand deposits were focused on while no attention is paid to bank equity (Gambacorta and Mistrulli 2004).
Several researchers take into account CAR under the Basel capital requirements in augmenting the bank capital channel (Bolton and Freixas 2006, Van den Heuvel 2002). Some have pointed out that if the capital is insufficient for the Basel capital requirements, banks may decrease their lending (Gambacorta and Mistrulli 2004, Berrospide and Edge 2010). At the same time, if banks hold capital beyond the
minimum capital requirement, they incur costs; however, if banks violate the minimum capital regulations, different costs will arise, such as regulatory intervention. Therefore, banks have incentives to hold excess capital as insurance in order to avoid violating regulations (Stolz, Heid and Porath 2003).
According to the bank capital channel theorem, monetary policy affects bank lending in part through its impact on bank equity capital (Van den Heuvel 2002). As a first prerequisite to the bank capital channel, banks’ capital markets must be incomplete, and they cannot easily issue shares due to agency cost and tax disadvantage. Secondly, banks are subject to interest rate risk because their assets typically have a longer maturity than liability (maturity mismatch), and it is necessary that they comply with the regulatory minimum capital requirements (Gambacorta and Mistrulli 2004).
3. The Indonesian banking sector structure and monetary policy 3.1 Structure of the Indonesian banking sector
The Indonesian commercial banking sector comprises five types of banks, which are categorized by ownership: state-owned banks, regional development banks, private banks, joint banks, and foreign banks (Table 1). Private banks are divided into two types based on their foreign exchange operations: foreign exchange banks (forex banks) and non-foreign exchange banks (non-forex banks). The Indonesian government holds more than 60% of the total shares of state-owned banks, regional governments hold regional development banks, domestic capital owns private banks, domestic capital and foreign capital hold joint banks, and foreign banks are branches of foreign banks overseas.
Insert Table 1 here.
Figure 2 illustrates banks’ excess capital, which is the difference between their CAR and the Basel regulatory requirements. The condition of bank capital was much improved by 2009 compared to 1998, reflecting the government’s strengthening of prudential regulations. The level of excess capital varies with bank type. Due to the Asian crisis, state-owned banks had a capital deficit until 1999, after which restructuring programs like capital injection improved state-owned banks’ financial soundness and increased capital. Since the early 2000s, the level of excess capital has remained stable at around 10%. Excess capital of forex banks is relatively higher, at 33.7% in 1999 and 25.9% in 2000; since then, it has been maintained at 13–20%. Non-forex banks’ excess capital is always been maintained at a higher level of 20–35%.
Joint banks hold very high levels of excess capital, ranging from 30–50%. Foreign banks and regional development banks keep their excess capital at around 25% and 13%, respectively. The level of excess capital varies with bank type, and since 2006, non-forex banks, joint banks, and foreign banks have increased their levels of excess capital.
Figure 2: Excess capital by bank type
Source: Ekofin Konsulindo, Indonesian Banking Indicators.
In order to examine the differences in capitalization among bank types more closely, we compared the mean and median values of the excess capital in the large and small banks measured in the banks’ total assets (Figure 3).
Figure 3: Comparison of excess capital in small banks and large banks
Large banks are defined as banks with total assets in the upper 75th percentile of all banks; small banks are defined as those with a total asset amount below the 25th percentile of all banks. In the mean value, we found that the difference between the large bank and the small bank was large, with a gap of around 20%, but in the median value, there was little practical difference between large banks and small banks. Small banks have rapidly increased their capital ratio beginning in the second half of 2007.
Figure 4 illustrates trends in gross domestic product (GDP) growth rates. The economic growth rate began to slow in the second half of 2007, after which the growth rate fell sharply due to the global financial crisis in 2008. The sharp increases in excess capital of the small banks may reflect the declining trend of economic growth, as most of the small banks are non-forex banks. Non-forex banks operate in a limited area and do not have many branches, so their funding sources are not as strong as government and forex banks. Therefore, their cost of funds index is the highest among all of the types of banks (Table 1), and they were most susceptible to the economic downturn. Table 2 compares bank performance by bank size. In 2007, the return on equity (ROE) of the small banks fell into the negative, -1.2% in June 2007 and -0.1% in December 2007, while large banks’ ROE are 22.9% and 19.2% respectively. These low profits result in reduced capital accumulation; therefore, the banks may increase their capital as a precautionary measure so as not to violate regulations.
Figure 4: GDP growth rate (2001–2013)
Source: Bank Indonesia, Indonesian Financial Statistics.
3.2 Monetary policy transmission mechanisms in Indonesia
While bank capital has increased and bank soundness has recovered, bank lending remains sluggish (Figure 5). Before the crisis, the ratio of bank lending to GDP surpassed 50%, whereas after the crisis, it dropped sharply to less than 20% due to the transfer of massive non-performing loans to a national assets management agency, the Indonesian Bank Restructuring Agency (IBRA). Since then, bank lending has continued to be low, with a ratio under 40% to GDP.
Figure 5: Ratio of bank lending to GDP (1995–2016)
Source: Bank Indonesia, Indonesian Financial Statistics.
Goeltom (2008) explained the results of the survey conducted by Bank Indonesia about the monetary transmission mechanism through the interest rate channel in Indonesia in the pre-crisis period (before the Asian financial crisis of 1997) and the post-crisis period (after 2000). In the post-crisis period, a changing policy rate was transmitted to the real sector to various retail banking rates. The banks’ response to the policy rate decrease was to reduce their deposit rates and decrease SBI(Sertifikat Bank Indonesia) which is the central bank certificates, holdings in their portfolios, and increase their loan portfolios. The survey results indicated an opposite movement between policy rates and loans. As Table 3 shows, SBI is a major investment in banks’ portfolios.
Figure 6 shows trends of interest rate and bank lending growth from 2003–2015. As Goeltom (2008) mentioned, the trends of loan growth and interest rate, which are calculated by policy rate minus inflation rate (consumer price index [CPI]), move in opposite directions.
Wulandari (2012) assessed the role of the two monetary transmission mechanism channels in managing inflation and contributing to economic growth in Indonesia, finding that the two channels played different roles in influencing the real sector. Further, while the interest rate channel was important for managing inflation, the credit bank lending channel still dominated economic growth.
Figure 6: Policy rate and consumer price index (CPI) (2000–2016)
Figure 7: Interest rate and bank lending growth
Source: Bank Indonesia, Indonesian Financial Statistics.
Note: Interest rate is the real interest rate, which is calculated by policy rate minus inflation rate (CPI). Loan growth
is a semiannual growth rate.
Hamada (2016) examined the determinants of excess capital in four Indonesian bank groups: government banks (state-owned banks and regional development banks), forex banks, non-forex banks, and foreign banks (joint banks and foreign banks). ROE as a proxy for the direct costs of capital (Jokipii and Milne, 2008) has a negative and significant effect on excess capital, which is measured by differences between the risk weighted CAR and regulatory minimal capital requirements, except for foreign banks. Concerning the relationship between excess capital and business cycles, GDP growth rate affects the excess capital of forex and non-forex banks. This implies that during an economic upturn, forex and non-forex banks increase their capital because the cost of capital funding is lower.
Hamada (2016) examined the effect of bank capital on loan growth in Indonesia, a well-capitalized bank could increase its credit. In other words, smaller banks such as non-forex and joint banks with lower fundraising capabilities should increase their capital in order to increase their credit.
4. Empirical analysis
4.1 Dataset and empirical model
Our dataset was comprised of 118 banks: 4 state-owned banks, 34 forex banks, 30 non-forex banks, 15 joint banks, 9 foreign banks, and 26 regional development banks, all of which were in a database of Indonesian banking indicators, provided by Ekofin Konsulindo in Jakarta, Indonesia.
We examined the effects of bank capital on bank loan growth using a fixed effects model and a random effects model of panel data regressions; we used the banks’ semiannual financial data from 1998–2009. We estimated the effects of bank capital using the following equation (1):
(1),
where Y is the dependent variable (i.e., semiannual bank loan growth rate). X is a vector of basic characteristics of individual banks: the bank book value of total assets, return on assets (ROA), and non-performing loan rate. Z is the macro economy (i.e., GDP growth rate, interest rate, inflation rate). The CAPITAL_DUMMY variable comprises
LOW and HIGH. LOW represents a poorly capitalized bank, which is given a value of 1
when the bank’s equity ratio, which is calculated by its total equity divided by its total assets, is below the 25th percentile of all banks; otherwise, it is given a value of 0.
HIGH represents a well-capitalized bank, which is given a value of 1 when the bank’s
equity ratio is in the 75th percentile; otherwise, it is given a value of 0. Finally, ε represents error terms.
Insert Table 4 here.
In addition to Equation (1), we used Equation (2) to examine the interaction terms of the
CAPITAL_DUMMY and the interest rate.
(2)
These equations allowed us to examine how bank capital level affects bank lending behaviors. The most interesting variables were CAPITAL_Dummy and the interaction terms. The interaction terms for CAPITAL_Dummy and interest rate were used to
examine the effects of monetary policy on bank lending through bank capital. We expected that the effects of monetary tightening would be smaller for banks with higher capital ratios, as they have easier access to uninsured financing (Gambacorta and Mistrulli 2004).
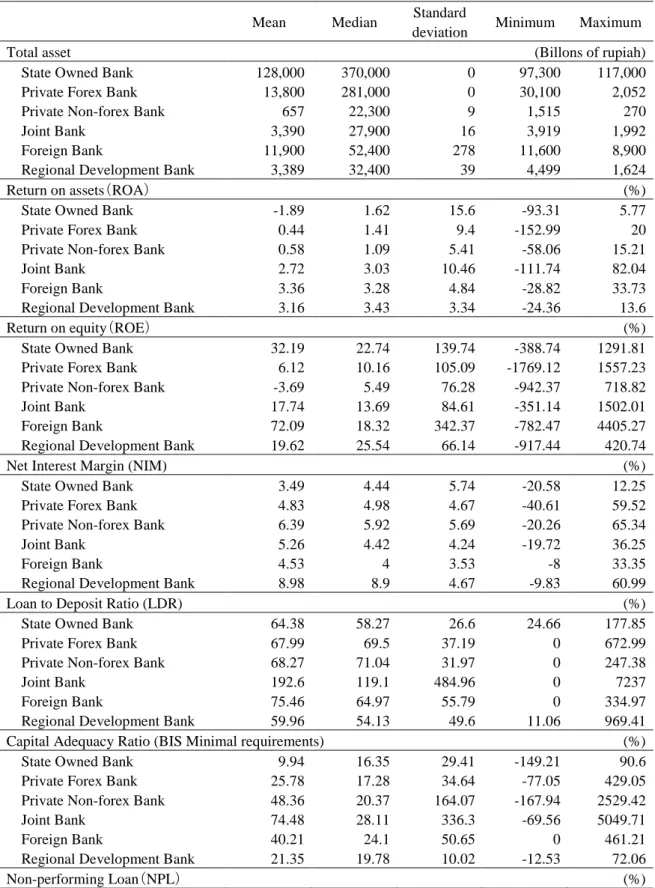
Table 5 compares the major indicators of poorly capitalized banks, hereafter, LOW, and well-capitalized banks, hereafter, HIGH. A t-test was used to compare the averages of the LOW and HIGH. Concerning profitability, measured by ROA and net interest margin (NIM), HIGH were more profitable than LOW. As for efficiency, the operational expense ratio (OER) of HIGH was lower than it was for LOW, which implies that HIGH are more efficient than LOW. The loan to deposit ratio (LDR) and the ratio of total credit to total assets, which represents the financial intermediary function, were higher in HIGH than in LOW. In general, HIGH’ performance was better than LOW’; and there is a decisive difference between them. Table 1 shows the major indicators of the Indonesian banking sector from 1997–2009. Regarding CAR, which is a Bank for International Settlements (BIS) minimal requirement, private non-forex banks, joint banks, and foreign banks’ CARs were very high (greater than 40%).
Insert Table 5 here
4.2 Regression results
The results of the estimation of loan growth are summarized in Table 6. We estimated the models using fixed effects panel regressions for Models I, II, III, and V and a random effects panel regression for Model IV.1 Our main focus was the coefficients of the CAPITAL_DUMMY and the interaction terms of the CAPITAL_DUMMY and interest rate. The coefficients of HIGH were positive and significant for Model I, III, and IV, while the coefficients of LOW of all models except Model V were negative but not significant. This implies that a well-capitalized bank tends to increase its loan provisions more so than do other banks. In Model II for government banks, the coefficients of both HIGH and LOW were negative and not significant. This indicates that government banks’ behavior could be different from other types of private banks. Hamada (2016) warned of the possibility of a moral hazard for government banks
1
We tested the null hypothesis that an individual effect does not exist using the F-test. The null hypothesis was rejected for all specifications. We further tested the null hypothesis that the individual effect was correlated with regressors using Hausman’s specification test. The null hypothesis was rejected for specification Models I, II, III, and V, but not for Model IV. We used the fixed effects model to estimate the regression equations for Models I, II, III, and V and used the random effects model for Model IV.
concerning determinants of bank capital because banks’ excess capital has negatively related risk factors (Francis and Osborne, 2012). In other words, government banks can take more risks than private banks based on an implicit guarantee by the government; thus, government banks’ lending behavior might be different from other banks.
Concerning the interaction terms, the results of HIGH_iINT_RATE were significant for Model (1) of I and Model (7) of IV, but they were negative. This means that well-capitalized banks respond to changing monetary policy better than poorly capitalized banks. This finding was the opposite of what we expected. Except for Model I for all banks, the results were significant only for non-forex banks. As we mentioned in Section 3, non-forex banks increase their capital as a precautionary measure during economic downturns due to their weak funding capacities; therefore, we assume that well-capitalized non-forex banks are more vulnerable to economic environment changes.
Regarding other explanatory variables, bank size measured by ASSET negatively affected loan growth. ROA had a less obvious effect on loan growth. Bank profitability had no significant effect on bank loan provision. Bank risk measured by non-performing loan (NPL) negatively affected loan growth, but it was significant for all banks (Model I), government banks (Model II), and foreign ownership banks (Model V). GDP growth had a positive effect on government banks, but it had no effect on any other type of bank. Finally, policy rate (INT_RATE) negatively affected loan growth, except for in government banks, it suggests that government banks may act on different principles from other banks The effect of CPI on changing in bank lending was not clear.
Insert Table 6 here
5. Conclusion
We investigated the role of bank capital in bank lending using bank-level data from Indonesian commercial banks. Indonesian commercial bank capitalization improved with the implementation of bank restructuring programs after the Asian financial crisis. CARs have returned to an acceptable level; however, bank loan disbursement has remained low. We focused on the bank lending channel in Indonesian banks and investigated the effects of monetary policy on bank lending through bank capital. The results indicate that well-capitalized banks can increase their provision of bank loans, except in the case of government banks, but cannot respond to monetary policy, except in the case of non-forex bank. which turned out that the result varies depending on the
type of bank, especially, government banks’ behavior could be different from other types of private banks.
In this paper only the effects of bank lending channel is examined, but not sufficiently verified bank capital channel due to the data limitation. As future subject investigation of the bank capital channel precisely is necessary in order to address to the question of why Indonesia's sluggish banking sector and declining financial intermediation function are occurring.
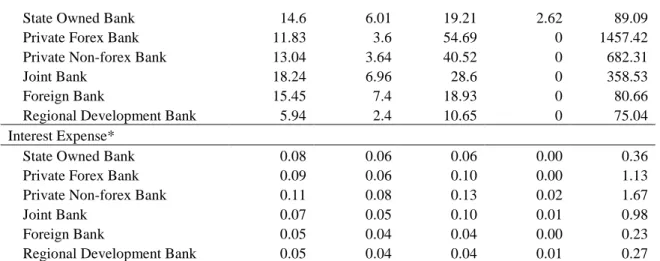
Table 1: Major bank indicators of the Indonesian banking sector (1997–2009)
Mean Median Standard
deviation Minimum Maximum Total asset (Billons of rupiah)
State Owned Bank 128,000 370,000 0 97,300 117,000 Private Forex Bank 13,800 281,000 0 30,100 2,052 Private Non-forex Bank 657 22,300 9 1,515 270 Joint Bank 3,390 27,900 16 3,919 1,992 Foreign Bank 11,900 52,400 278 11,600 8,900 Regional Development Bank 3,389 32,400 39 4,499 1,624 Return on assets(ROA) (%) State Owned Bank -1.89 1.62 15.6 -93.31 5.77 Private Forex Bank 0.44 1.41 9.4 -152.99 20 Private Non-forex Bank 0.58 1.09 5.41 -58.06 15.21 Joint Bank 2.72 3.03 10.46 -111.74 82.04 Foreign Bank 3.36 3.28 4.84 -28.82 33.73 Regional Development Bank 3.16 3.43 3.34 -24.36 13.6 Return on equity(ROE) (%) State Owned Bank 32.19 22.74 139.74 -388.74 1291.81 Private Forex Bank 6.12 10.16 105.09 -1769.12 1557.23 Private Non-forex Bank -3.69 5.49 76.28 -942.37 718.82 Joint Bank 17.74 13.69 84.61 -351.14 1502.01 Foreign Bank 72.09 18.32 342.37 -782.47 4405.27 Regional Development Bank 19.62 25.54 66.14 -917.44 420.74 Net Interest Margin (NIM) (%) State Owned Bank 3.49 4.44 5.74 -20.58 12.25 Private Forex Bank 4.83 4.98 4.67 -40.61 59.52 Private Non-forex Bank 6.39 5.92 5.69 -20.26 65.34 Joint Bank 5.26 4.42 4.24 -19.72 36.25 Foreign Bank 4.53 4 3.53 -8 33.35 Regional Development Bank 8.98 8.9 4.67 -9.83 60.99 Loan to Deposit Ratio (LDR) (%) State Owned Bank 64.38 58.27 26.6 24.66 177.85 Private Forex Bank 67.99 69.5 37.19 0 672.99 Private Non-forex Bank 68.27 71.04 31.97 0 247.38 Joint Bank 192.6 119.1 484.96 0 7237 Foreign Bank 75.46 64.97 55.79 0 334.97 Regional Development Bank 59.96 54.13 49.6 11.06 969.41 Capital Adequacy Ratio (BIS Minimal requirements) (%) State Owned Bank 9.94 16.35 29.41 -149.21 90.6 Private Forex Bank 25.78 17.28 34.64 -77.05 429.05 Private Non-forex Bank 48.36 20.37 164.07 -167.94 2529.42 Joint Bank 74.48 28.11 336.3 -69.56 5049.71 Foreign Bank 40.21 24.1 50.65 0 461.21 Regional Development Bank 21.35 19.78 10.02 -12.53 72.06 Non-performing Loan(NPL) (%)
State Owned Bank 14.6 6.01 19.21 2.62 89.09 Private Forex Bank 11.83 3.6 54.69 0 1457.42 Private Non-forex Bank 13.04 3.64 40.52 0 682.31 Joint Bank 18.24 6.96 28.6 0 358.53 Foreign Bank 15.45 7.4 18.93 0 80.66 Regional Development Bank 5.94 2.4 10.65 0 75.04 Interest Expense*
State Owned Bank 0.08 0.06 0.06 0.00 0.36 Private Forex Bank 0.09 0.06 0.10 0.00 1.13 Private Non-forex Bank 0.11 0.08 0.13 0.02 1.67 Joint Bank 0.07 0.05 0.10 0.01 0.98 Foreign Bank 0.05 0.04 0.04 0.00 0.23 Regional Development Bank 0.05 0.04 0.04 0.01 0.27
Source: Ekofin Konsulindo, Indonesian Banking Indicators.
Note: Interest expense represents the ratio of interest expense to total funds.
Table 2: Comparison of bank performance by bank size
ROA ROE NIM NPL
SMALL LARGE SMALL LARGE SMALL LARGE SMALL LARGE 1997/12 2.42% 1.43% 9.4% 33.2% 7.8% 4.0% . . 1998/6 1.17% -0.77% 0.0% 82.2% 4.9% 1.0% . . 1998/12 -2.57% -40.40% -26.9% 191.7% 9.0% -4.6% 41.3% 64.3% 1999/6 -0.42% -5.13% 0.7% 31.6% 3.6% -1.8% 84.3% 41.7% 1999/12 -0.49% -11.08% -89.8% 229.2% 6.1% -2.3% 38.0% 47.9% 2000/6 -0.15% -0.44% -6.9% 10.8% 4.0% 0.9% 29.7% 35.1% 2000/12 0.63% 1.06% 8.0% 47.2% 5.3% 2.6% 13.2% 18.7% 2001/6 1.87% 1.15% -0.2% 17.8% 6.2% 3.3% 10.5% 18.3% 2001/12 2.35% 1.11% 20.4% -18.1% 8.7% 3.4% 6.9% 15.4% 2002/6 0.96% 2.40% -7.5% 26.6% 5.8% 3.9% 6.6% 9.7% 2002/12 -0.71% 1.95% -8.9% 13.7% 6.8% 4.0% 5.3% 9.1% 2003/6 1.32% 2.78% -10.6% 27.7% 5.4% 4.6% 5.8% 5.4% 2003/12 0.90% 2.52% -7.3% 28.4% 6.5% 5.2% 6.1% 6.0% 2004/6 2.64% 3.60% 15.8% 32.0% 7.4% 6.4% 6.0% 5.5% 2004/12 1.66% -2.11% 4.9% 25.2% 8.6% 6.1% 5.3% 4.3% 2005/6 2.50% 2.87% 14.8% 25.0% 8.9% 6.0% 4.5% 4.5% 2005/12 1.97% 2.42% 7.9% 21.2% 9.8% 5.8% 3.7% 4.4% 2006/6 1.57% 2.70% 2.2% 23.0% 7.5% 6.4% 4.4% 4.9% 2006/12 1.24% 2.66% 2.3% 21.7% 7.8% 6.4% 4.6% 4.1% 2007/6 0.94% 3.10% -1.2% 22.9% 7.3% 6.4% 5.4% 4.0% 2007/12 2.07% 2.69% -0.1% 19.2% 7.4% 6.3% 4.9% 2.9% 2008/6 1.88% 2.42% 3.9% 18.8% 7.2% 6.5% 4.6% 3.0% 2008/12 1.04% 2.70% 1.3% 19.3% 7.4% 6.4% 2.4% 2.7% 2009/6 0.63% 2.81% 0.1% 17.3% 7.7% 5.9% 4.9% 4.1% 2009/12 -0.26% 1.46% -0.3% -1.7% 8.3% 5.9% 5.4% 3.7%
Table 3: Bank assets structure* 1998 1999 2000 2001 2002 2003 2004 2005 2006 2007 2008 2009 Credit (Rp) 45.2% 33.4% 19.8% 15.7% 18.0% 23.8% 29.0% 34.0% 38.4% 38.6% 40.1% 46.5% Credit(USD) 27.1% 41.6% 14.4% 13.4% 12.5% 9.1% 8.4% 9.4% 9.3% 8.8% 10.3% 11.0% Credit(Rp+USD) 72.3% 75.0% 34.2% 29.1% 30.6% 32.9% 37.4% 43.5% 47.6% 47.4% 50.4% 57.5% BI placement** 3.0% 4.3% 5.4% 7.8% 11.5% 13.5% 15.9% 15.9% 13.8% 18.7% 20.3% 14.3% Government bond 0.0% 0.0% 23.9% 45.5% 41.2% 37.3% 30.7% 24.9% 21.4% 18.4% 15.2% 12.7% SBI** 0.0% 0.9% 0.9% 2.9% 5.1% 7.5% 9.6% 7.9% 4.8% 9.8% 10.6% 6.5% Cash 1.2% 1.3% 1.6% 1.4% 1.3% 1.5% 1.6% 1.5% 1.5% 1.6% 1.9% 2.2%
Source: Ekofin Konsulindo, Indonesian Banking Indicators.
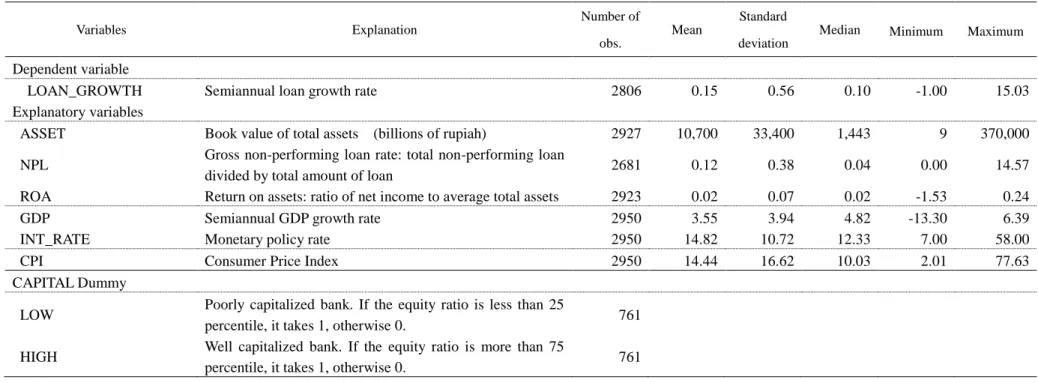
Table 4: Explanation of variables and descriptive statistics value Variables Explanation Number of obs. Mean Standard deviation
Median Minimum Maximum
Dependent variable
LOAN_GROWTH Semiannual loan growth rate 2806 0.15 0.56 0.10 -1.00 15.03 Explanatory variables
ASSET Book value of total assets (billions of rupiah) 2927 10,700 33,400 1,443 9 370,000
NPL Gross non-performing loan rate: total non-performing loan
divided by total amount of loan 2681 0.12 0.38 0.04 0.00 14.57 ROA Return on assets: ratio of net income to average total assets 2923 0.02 0.07 0.02 -1.53 0.24 GDP Semiannual GDP growth rate 2950 3.55 3.94 4.82 -13.30 6.39 INT_RATE Monetary policy rate 2950 14.82 10.72 12.33 7.00 58.00 CPI Consumer Price Index 2950 14.44 16.62 10.03 2.01 77.63 CAPITAL Dummy
LOW Poorly capitalized bank. If the equity ratio is less than 25
percentile, it takes 1, otherwise 0. 761
HIGH Well capitalized bank. If the equity ratio is more than 75
Table 5: Comparisons of major indicators between low-capitalized and high-capitalized banks
ROA ROE NIM OER LDR NPL Equity Ratio INT_PAY Credit Ratio Loan Growth ASSET (Billions of rupiah) LOW -0.01 0.13 0.04 0.95 0.73 0.17 0.02 0.10 0.47 0.19 13,300 HIGH 0.03 0.09 0.07 0.78 0.92 0.14 0.26 0.09 0.52 0.13 2,002 t-value* 8.40*** -0.55 11.30*** -6.37*** 4.43*** -1.29 35.50*** -1.46 4.06*** -1.40 -10.01*** All banks 0.02 0.12 0.06 0.84 0.78 0.12 0.13 0.08 0.52 0.15 10,700
Source: Ekofin Konsulindo, Indonesian Banking Indicators.
Note: *The results of the t-test are based on LOW. ***p < 0.01. **p < 0.05. *p < 0.1. ROA is the ratio of net income to average total assets. ROE is the ratio of net income to
shareholders’ equity. NIM is calculated as the difference between investment return and interest expense divided by average earning assets. OER measures a bank’s profitability or efficiency by dividing annualized operating expenses by operating income. LDR is the total loans divided by the sum of collection of funds and core capital. NPL is the banks’ NPLs divided by their total loans. The equity ratio is the banks’ total equity to their total assets. INT_PAY represents the expense of interest payments, which is the ratio of interest expense to total funds. The credit ratio shows the banks’ intermediary function, which is their total credit divided by their total assets. Loan growth is the semiannual growth rate of the banks’ loans.
Table 6: Regression results on loan growth (All banks, Government banks)
I II
All banks Government banks (State Owned and Regional development banks)
(1) (2) (3) (4)
Coef. Std. Err. Coef. Std. Err. Coef. Std. Err. Coef. Std. Err. ASSET(log) (t-1) -0.108 0.028 *** -0.115 0.028 *** -0.049 0.019 *** -0.054 0.019 *** NPL(t-1) -0.054 0.028 * -0.058 0.028 ** -0.419 0.064 *** -0.405 0.064 *** ROA(t-1) 0.282 0.151 * 0.218 0.146 0.012 0.104 0.013 0.092 LOW -0.047 0.047 -0.024 0.030 -0.022 0.024 -0.023 0.015 HIGH 0.135 0.049 *** 0.065 0.033 * -0.016 0.039 -0.023 0.017 LOW_int_rate 0.001 0.002 0.000 0.001 HIGH_int_rate -0.004 0.002 * 0.001 0.002 GDP(t-1) -0.012 0.013 -0.011 0.013 0.026 0.007 *** 0.026 0.007 *** INT_RATE -0.025 0.011 ** -0.025 0.011 ** 0.013 0.006 ** 0.013 0.006 ** CPI -0.003 0.004 -0.003 0.004 -0.003 0.002 -0.003 0.002 CONS 2.176 0.440 *** 2.245 0.440 *** 0.700 0.282 ** 0.778 0.284 *** YEAR yes yes yes Number of observations 2551 2551 641 641
R2 0.051 0.049 0.231 0.234
Table 6 Regression Results on Loan growth (Forex banks and Non-forex banks)
III IV
Forex banks Non forex banks
(5) (6) (7) (8)
Coef. Std. Err. Coef. Std. Err. Coef. Std.
Err. Coef. Std. Err. ASSET(log) (t-1) -0.162 0.047 *** -0.180 0.047 *** -0.008 0.035 -0.009 0.035 NPL(t-1) -0.044 0.035 -0.050 0.035 -0.105 0.084 -0.100 0.084 ROA(t-1) 0.352 0.228 0.345 0.224 -0.920 0.762 -1.068 0.757 LOW -0.097 0.078 -0.027 0.048 -0.019 0.125 0.006 0.078 HIGH 0.188 0.074 ** 0.147 0.053 *** 0.321 0.130 ** 0.157 0.086 * LOW_int_rate 0.001 0.004 0.001 0.007 HIGH_int_rate -0.005 0.004 -0.011 0.007 * GDP(t-1) -0.019 0.021 -0.016 0.021 -0.026 0.040 -0.022 0.040 INT_RATE -0.033 0.018 * -0.033 0.018 * -0.044 0.035 -0.044 0.035 CPI -0.003 0.007 -0.003 0.007 -0.005 0.014 -0.005 0.014 CONS 2.962 0.661 3.184 0.654 *** 0.712 0.691 0.743 0.690 YEAR yes yes yes yes Number of observations 1392 1392 656 656
R2 0.061 0.059 0.049 0.044
F-value 4.21 *** F-value 4.56 *** Wald
Table 6 Regression Results on Loan growth (Foreign ownership banks)
V
Foreign ownership banks
(9) (10)
Coef. Std. Err. t Coef. Std. Err. t ASSET(log) (t-1) -0.121 0.067 * -0.124 0.067 ** NPL(t-1) -0.320 0.120 *** -0.324 0.119 *** ROA(t-1) 0.124 0.353 0.058 0.343 LOW 0.010 0.120 0.091 0.098 HIGH -0.113 0.108 -0.093 0.074 LOW_int_rate 0.005 0.005 HIGH_int_rate 0.002 0.006 GDP(t-1) -0.045 0.028 -0.049 0.028 * INT_RATE -0.055 0.025 ** -0.053 0.025 ** CPI -0.004 0.010 -0.004 0.009 CONS 2.986 1.076 *** 3.053 1.064 *** YEAR yes yes Number of
observations 518 518
R2 0.128 0.126
F-value 3.47 *** F-value 3.81 ***
Note: “All banks” includes 118 banks: 4 state-owned banks, 34 forex banks, 30 non-forex banks, 15 joint banks, 9 foreign banks, and 26 regional development banks from 1997–2009.
References
Ayuso, J., D. Pérez and J. Saurina 2004. “Are capital buffers pro-cyclical? Evidence from Spanish panel data,” Journal of Financial Intermediation 13 (2): 249-264.
Bikker, J. A. and P. A. J. Metzemakers 2005. “Bank provisioning behaviour and procyclicality,” Journal of International Financial Markets, Institutions and Money 15: 141-157.
Berrospide, J. M. and R. M. Edge 2010. “The effects of bank capital on lending: what do we know, and what does it mean?” FEDS Working Paper 2010-44, Washington, D.C.: Board of Governors of the Federal Reserve System.
Bolton, P. and X. Freixas 2006. “Corporate Finance and the Monetary Transmission Mechanism,” Review of Financial Studies 19 (3): 829-870.
Francis, W. B. and M. Osborne 2009. “On the behavior and determinants of risk-based capital ratios: revisiting the evidence from UK banking institutions,” Occasional Paper Series No. 31, London: Financial Services Authority.
――― 2012. “Capital requirements and bank behavior in the UK: Are there lessons for international capital standards?” Journal of Banking and Finance 36 (3): 803-816.
Gambacorta, L. and P. E. Mistrulli 2004. “Does bank capital affect lending behavior?” Journal
of Financial intermediation 13 (4): 436-457.
Goeltom, M. S. 2008. “The transmission mechanisms of monetary policy in Indonesia,” BIS
Papers 35, Basel: Bank for International Settlements.
Hamada, M. 2016. “Excess capital and bank behavior: Evidence from Indonesia,” IDE
DISCUSSION PAPER No. 588, Chiba: Institute of Developing Economies.
Jokipii, T. and A. Milne 2008. “The cyclical behavior of European bank capital buffers,”
Journal of Banking and Finance 32 (8): 1440-1451.
Kishan, R. P. and T. P. Opiela 2000. ” Bank Size, Bank Capital, and the Bank Lending Channel,”Journal of Money, Credit and Banking 32 (1): 121-141.
---2006. “Bank capital and loan asymmetry in the transmission of monetary policy,” Journal of Banking & Finance 30: 259–285.
Lai, K. and M. Konishi 2014. “Capital requirements and bank behavior: Evidence from Japanese commercial banks,” Unpublished manuscript.
Stolz, S., F. Heid, and D. Porath 2003. “Does Capital Regulation Matter for Bank Behavior? Evidence for German Savings Banks,” EFMA 2004 Basel Meetings Paper, European Financial Management Association.
Stolz, S. and M. Wedow 2011. “Banks’ regulatory capital buffer and the business cycle: Evidence for Germany,” Journal of Financial Stability 7: 98-110.
Van den Heuvel, S. J. 2002. “Does bank capital matter for monetary transmission?” Federal Reserve Bank New York Economic Policy Review May: 258-265.
Wulandari, R. 2012. “Do Credit Channel and Interest Rate Channel Play Important Role in Monetary Transmission Mechanism in Indonesia? :A Structural Vector Autoregression Model.” Procedia - Social and Behavioral Sciences 65 :557 – 563.
The Institute of Developing Economies (IDE) is a semigovernmental, nonpartisan, nonprofit research institute, founded in 1958. The Institute merged with the Japan External Trade Organization (JETRO) on July 1, 1998.
The Institute conducts basic and comprehensive studies on economic and related affairs in all developing countries and regions, including Asia, the Middle East, Africa, Latin America, Oceania, and Eastern Europe.
The views expressed in this publication are those of the author(s). Publication does not imply endorsement by the Institute of Developing Economies of any of the views expressed within.
INSTITUTE OF DEVELOPING ECONOMIES (IDE), JETRO 3-2-2, WAKABA,MIHAMA-KU,CHIBA-SHI
CHIBA 261-8545, JAPAN
©2017 by Institute of Developing Economies, JETRO
No part of this publication may be reproduced without the prior permission of the IDE-JETRO.