APCをめぐる国際的動向
三根慎二(三重大学)
本日の内容
1. 背景
2. APC関連領域の動向
1.
学術雑誌
2.
出版者
3.
研究者
4.
研究助成機関
5.
大学・大学図書館
3. APCが取り得るシナリオ
英国のOA方針
•
OA Game
•
フィンチレポートの衝撃
•
公的助成研究に対するOA実現手段の方針転換
•
機関リポジトリ < OAジャーナル w/APC での公表を重視
•
政府(
David Willetts/
前大学・科学担当閣外大臣
)の支持支援
とBISの見直し要請
•
フィンチ準拠のOA方針策定
•
RCUK
,Wellcome Trust,NIHRなど
•
REF 2020
•
評価対象成果 → 機関リポジトリ等へ登録義務
フィンチレポート
1. Accessibility, sustainability, excellence: how to expand
access to research publications
2. Review of Progress in Implementing the Recommendations
of the Finch Report
•
要点
•
公的助成研究のOAを,Gold OAによって実現
•
OA
ジャーナルあるいはハイブリッドジャーナルのAPC
を支援することを方針として明確にすべき
•
APC
によるOA出版が,現実的かつ持続可能な学術
出版のモデル
REF(HEFCE)
•
REF(
Research Excellence Framework
)2020
•
英国大学の研究評価(研究活動向け交付金の傾斜配分)
•
Output, Impact, Environment
の三領域
•
評価対象の研究成果をIR等でOA化
•
対象:学術雑誌論文・会議録論文(w/ISSN)の
著者最終稿(2016/4/1以降)
•
登録時期:受理後即時,かつ三ヶ月以内
•
OA
化:登録時あるいはエンバーゴ終了以降1ヶ月以内
•
最大12ヶ月/24ヶ月
•
REF 2014
のサンプル調査:96%が準拠
出典:Open access in the post-2014 Research Excellence Framework. http://www.hefce.ac.uk/pubs/year/2014/cl072014/#d.en.86764
http://www.hefce.ac.uk/media/hefce/content/whatwedo/research/infrastructure/openaccess/faq/Analysis_REF_2014_submission.pdf
欧州を中心としたOA方針
•
Horizon 2020(H2020)
•
European Research Council
•
Science Europe
•
GRC
OAジャーナルの進展
•
OAジャーナルタイトル数
タイトル数
割合
総タイトル数
総タイトル数
9930
100%
APC
あり
2577
26.0%
APC
なし
6456
65.0%
APC
条件付き
519
5.2%
APC
不明
145
1.5%
a fee in the instructions for authors or other documentation
on the journal Web site. We likewise expect there may have
been publishers who did not indicate their journals charged
fees but in fact do. We expect that any such biases in our
results would be small.
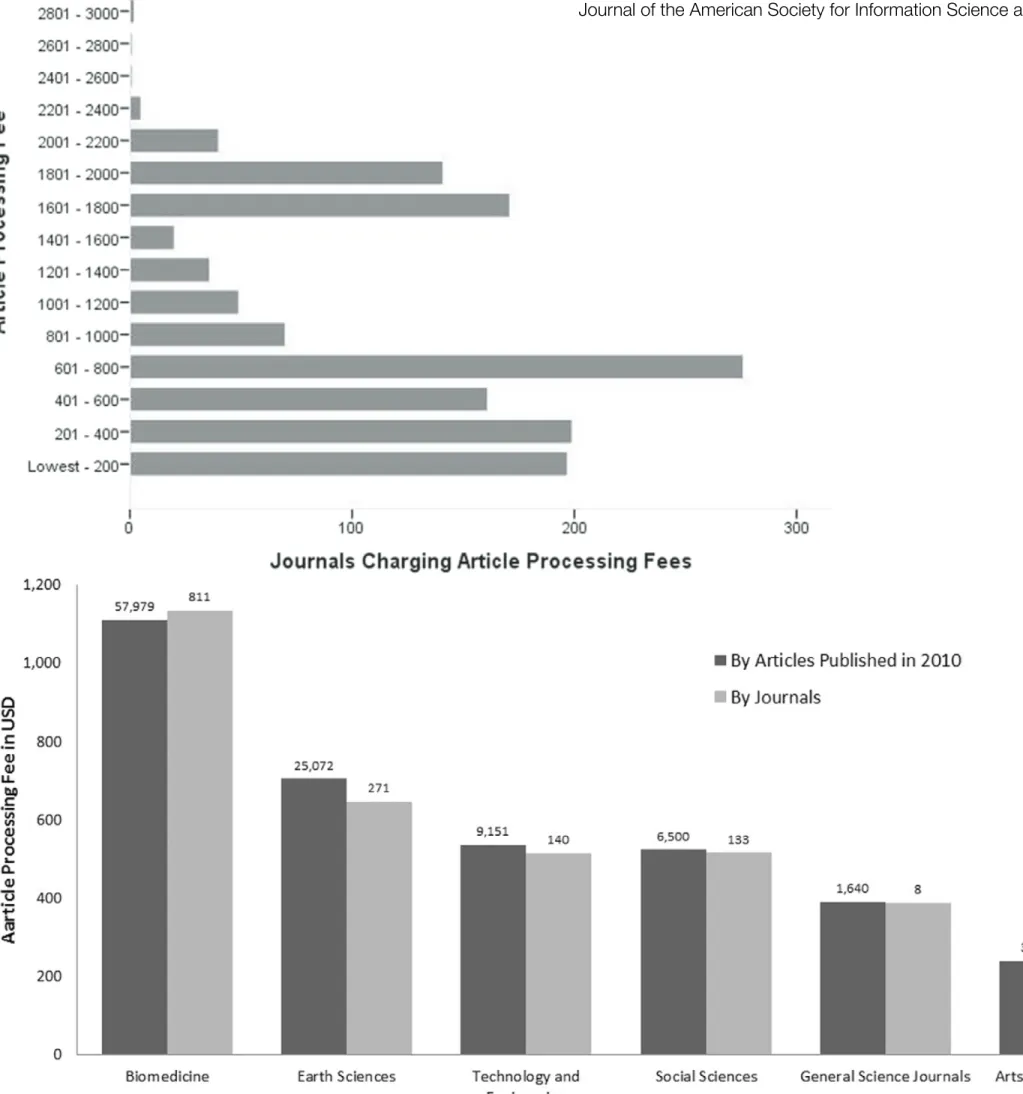
As can be seen in Figure 1a, journals charging $200 USD
or less published by far the most articles. There is also a
smaller spike in articles published in the $1,500–2,000 USD
range, likely reflecting articles from large biomedical
pub-lishers such as BioMed Central. There is a smaller spike in
the $1,200–1,400 USD range, possibly reflecting PLoS One
which published over 6,700 articles at $1,350 USD in 2010.
The distribution of APCs charged by journals presented
in Figure 1b demonstrates a large number of low- to
moderate-cost journals from below $200 USD up through
$800 USD. The large number of journals in the $601–800
USD range largely reflects the 200-plus journals published
by Bentham Open, all at $800 USD. There is also a large
group of journals charging between $1,601 and $2,000
USD. These likely reflect BioMed Central and other large
FIG. 4. Average article processing charge by subject matter area.
Note. Numbers above the bars are articles published in 2010/journals.
FIG. 5. Average article processing charge by impact factor category.
JOURNAL OF THE AMERICAN SOCIETY FOR INFORMATION SCIENCE AND TECHNOLOGY—August 2012
1491
DOI: 10.1002/asi
Discussion
We feel our methodology is robust. The data set
included a complete sample of all OA publishers in the
DOA listed as charging APCs that published at least two
journals. We included a random sample of approximately
11% of the single-journal publishers weighted to represent
the full sample of single publishers. Given the ease and
lack of any cost of including one’s journals in the DOAJ
and the visibility it provides, we expect the directory
FIG. 1a. Number of articles published in 2010 by article processing charge size category.
FIG. 1b. Number of journals by article processing charge size category.
JOURNAL OF THE AMERICAN SOCIETY FOR INFORMATION SCIENCE AND TECHNOLOGY—August 2012
1489
DOI: 10.1002/asi
出典:Solomon DJ, Björk B-C. A study of open access journals using article processing charges.
Journal of the American Society for Information Science and Technology. 2012;63(8):1485–1495.
http://www.biomedcentral.com/1741-7015/10/124
:124
article volume lacks coverage in major publication
indexes. This issue highlights the importance of using
manual data collection methods in OA studies because
data available from indexes only provide part of the total
picture. In addition to the results concerning full
immediate OA journals, Table 2 also contains volume
data for two other types of publisher-provided OA in
each respective index: delayed OA and hybrid OA.
Of the 1.66 million articles indexed by Scopus in 2011,
11% were published in full immediate OA journals, 0.7%
as hybrid OA and 5.2% in journals that have a maximum
OA delay of 12 months. Together, these account for
almost 17% of the total article volume in the whole index.
The figures for articles indexed by Thomson Reuters Web
of Knowledge are comparable to those of Scopus, with a
total publisher-provided OA rate of 16.2% for 2011. Of the
1.29 million articles indexed by Thomson Reuters Web of
Knowledge, 7.9% are available in full immediate OA
jour-nals, 0.7% as hybrid OA and 6.4% in journals that have a
maximum OA delay of 12 months. Overall the results
sug-gest that there has been an increase of about one
percen-tage point annually in relative OA volume in both Scopus
and Thomson Reuters Web of Knowledge during 2008 to
2011.
Figure 3 presents the longitudinal development of OA
publisher output as measured by the number of articles
output by publishers based in different regions of the
world. This figure, and all that follow, only includes full
immediate OA journals, excluding delayed and hybrid
OA. Prior to interpretation it needs to be noted that this is
a publisher-centric analysis. In some cases, the publisher is
not registered within the same country, or even region of
the world, as the journal. The results suggest that Latin
American countries were early to have substantial OA
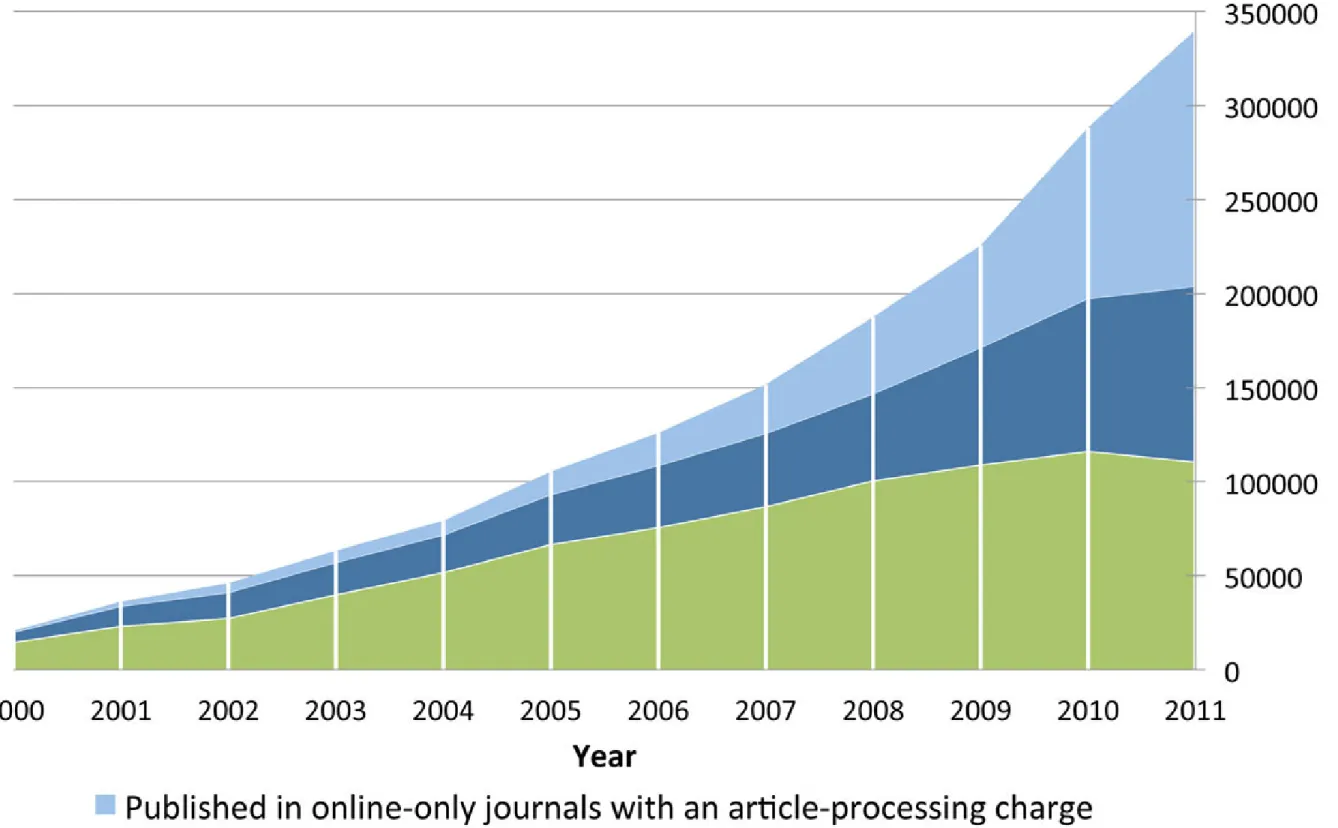
Figure 2 Annual volumes of articles in full immediate open access journals, split by type of open access journal.
Table 1 Estimated annual article and journal counts in full immediate open access journals
Year
2000
2001
2002
2003
2004
2005
2006
2007
2008
2009
2010
2011
Online-only OA journals (APC) Articles
795
2332
4,936
6,247
7,532
12,143
17,256
25,949
40,689
54,296
90,932 136,264
Journals
53
120
167
189
256
344
425
630
950
1,239
1,494
1,824
Online-only OA journals (no
APC)
Articles
5,445 10,690 13,844 17,238 20,106
26,626
33,067
38,991
46,362
62,521
81,421
93,513
Journals
334
484
613
804
1,006
1,272
1,538
1,793
2,048
2,399
2,548
2,495
Subscription-based print
journals with OA content
online
Articles 14,461 23,095 27,234 39,814 51,614
66,494
75,486
86,691 100,393 108,793 116,003 110,353
Journals
357
550
630
847
1,106
1,375
1,539
1,819
2,011
2,149
2,170
2,395
All OA journals
Articles 20,702 36,117 46,013 63,299 79,253 105,262 125,809 151,630 187,444 225,610 288,357 340,130
Journals
744
1,154
1,410
1,841
2,368
2,991
3,502
4,243
5,010
5,788
6,213
6,713
APC: article-processing charge; OA: open access.
Laakso and Björk BMC Medicine 2012, 10
Page 5 of 9
The Inevitability of Open Access 501
Assuming Christensen’s
methodol-ogy is correct and the data produced by
Laakso et al. is a good approximation
of past Gold OA growth, then, based
on the first estimate, using the 2000
to 2009 data, it is likely that Gold OA
journals will publish half of all scholarly
articles by 2017 and will publish 90
per-cent of the articles by 2020. The second
estimate, based on 2005 to 2009, shows
that 50 percent of scholarly articles
would be Gold OA by 2021 and over 90
percent by 2025. At some point the rate
of substitution will slow and the curve
will bend back forming the top of the
S-curve. Even the more conservative
nature of scholarly journal publishing
in the next decade.
This is a bold claim. It is important to
on whether or not open access provides
a citation advantage, or greater author
prestige, or makes knowledge more
ac-though I believe all of these things to be
true. Neither the particulars of how Gold
OA develops nor the motivations of the
players are important to my argument,
though they are interesting. My argument
is simply that Gold OA is a disruptive
innovation and, based on Christensen’s
work, this is the way disruptive
innova-tions behave.
Discussion
Impact on Authors
Authors should find a system
domi-nated by Gold OA journals to be to their
advantage, as their work will be widely
distributed and available to all who have
a need for it. Open systems will also more
easily adapt to systems of postpublication
review and comment, which, though not
yet fully developed, are likely to lead
to productive conversations about and
critiques of work. As open access comes
to dominate the scholarly
communica-tion system, the current concerns about
to promotion and tenure decisions, will
diminish.
FIGURE 3
Pace of Substitution of Direct Gold OA for Subscription Journals (normal scale)
0%
10%
20%
30%
40%
50%
60%
70%
80%
90%
100%
2000
2001
2002
2003
2004
2005
2006
2007
2008
2009
2010
2011
2012
2013
2014
2015
2016
2017
2018
2019
2020
2021
2022
2023
2024
2025
Laakso et al. Estimates
S-curve Extrapolation Based on 2000–2009
S-curve Extrapolation Based on 2005–2009
OAジャーナルの進展
•
ハイブリッドジャーナル
•
課金方式の多様化
•
一律方式,分野別方式,タイトル別方式
•
バンドル方式(MPI,CDLなど)
•
出版者の提供は広がるが,著者の利用は極めて低調
•
Scopus
収録論文の0.5%
•
二重取り問題
Elsevier
等
Sage
等
分野
平均APC価格 APC価格の幅
タイトル数
人文学
$1,425
750-1800
25
生物医学
$2,551
1100-5000
487
商学・経済学
$1,621
750-3300
160
化学
$2,675
1000-3750
131
地球科学
$2,631
1000-3750
232
工学
$2,524
750-3750
424
数学
$2,099
750-3300
81
物理学・天文学
$2,479
1800-3750
117
社会科学
$1,835
750-3750
201
※
エルゼビアの事例:出典: http://dx.doi.org/10.6084/m9.figshare.951966
WEST, BERGSTROM & BERGSTROM: COST EFFECTIVENESS
5
FIGURE 3
Article Influence Score Versus Article
Processing Charges
0
1000
2000
3000
4000
-2.5
-2.0
-1.5
-1.0
-0.5
0.0
0.5
1.0
Price ($ US)
log10 (Article Influence)
Notes:
Only JCR-listed journals are included in this graph.
The Article Influence scores are log transformed. The linear
regression line indicates that more prestigious journals tend
to have higher article processing charges.
FIGURE 4
Article Influence Distributions for Open Access
Journals (top) and Non-Open-Access Journals
(bottom)
open access journals
number of journals
-2.0
-1.5
-1.0
-0.5
0.0
0.5
1.0
0
20
60
100
ISI journals
log10 (Article Influence)
number of journals
-2.0
-1.5
-1.0
-0.5
0.0
0.5
1.0
0
500
1500
Note:
The Article Influence scores are log (base 10)
transformed.
set. Another prominent peak just below $2,000
indicates a common price point for many journals
that require article processing charges.
For some applications it may be desirable to
quantify the cost effectiveness of open access
venues using one single number. We do this
FIGURE 5
Article Processing Charges for Open Access
Journals in 2012
Price ($ US)
number of journals
0
1000
2000
3000
4000
5000
0
100
200
300
400
by looking at the ratio of Article Influence to
article processing charges. We define the cost
effectiveness
of a journal as (1000 * Article
Influ-ence/article processing charges). We provide
cost effectiveness values for the major open
access journals, and within each discipline we
list open access publications ranked from the
most to the least cost effective. We are able to
compute Article Influence scores only for those
journals listed in Thomson-Reuters’ JCR. While
the JCR includes over 10,000 total publications
and more than 1,000 open access publications
in 2011,
4
some newer open access journals and
many lesser-known ones are not included in this
list. We provide partial information for these
journals, including ISSN number and article
pro-cessing charges where possible, at http://www.
eigenfactor.org/openaccess/nonISI.php. Some of
these journals may represent good value as well,
though potential authors should think carefully
about the prestige and readership to be gained
from publishing in journals not included in
the JCR.
Open access journals offer several different
pricing models. In our data set, there were 480
journals that charge a fixed fee per article. Table 4
lists the top 10 of these ranked by cost
effective-ness. An additional 357 journals charge no article
processing charges whatsoever; we refer to these
4. Early on, Wouter Gerritsma compiled a useful list
of the open access journals indexed in the Thomson-Reuters
Journal Citation Reports (Gerritsma 2011).
二重取り問題
(Double Dipping)
•
予約購読費とAPCとの二重取り
•
APC
分に対応する予約購読費の値下げ?
•
ビッグディールとリストプライスの形骸化
•
値下げ分の反映は可能か?(ローカル or グローバル)
科 学 技 術 動 向
2014 年 7・8 月号(145 号)22
図表 4 カスケードモデルにおける購読および OA ジャーナルの関係、ならびに出版者の収益構造
図表 5 研究論文の受発信に関する経費と将来の簡略概念図
APC を利用した論文出版が増大しているが、現在
は個々の研究者が科研費等の公的助成ないしは個人
の研究費で APC を支払っている
6)ため、APC の総
額が把握できない状況にある。図書館でも APC の
支払い実態には現在関与しておらず、他部署での支
払いの実態を把握できていない。本来 OA 出版が増
えることで、購読費にかける経費が削減されること
が理想ではあるが、逆に、先に述べた購読費の増大
に加えて APC が値上がりすることによる
14)OA 出
版費の増大という二重苦の状態に陥る可能性は否定
できない。(図表 5)購読費の増大を抑えつつ、また、
ここで、多くの出版者は、購読費モデルと APC
モデルの OA ジャーナルを組み合わせて、カスケー
ドモデルと呼ばれる体制を整えている。図表 4 に示
されている通り、一度その出版者のトップジャー
ナルに投稿された原稿は、通常却下率の高いトッ
プジャーナルに掲載とならずとも、2 番手、3 番手
ジャーナルに掲載され、それでも通らない論文は
APC モデルの OA ジャーナルで掲載することが可
能となった。こうすることで、図書館からの購読費
と研究者からの APC を獲得し、事業収益性を高め
ている。また、購読費モデルのジャーナルのほとん
どで論文単位の OA 化を行っているので、その個別
の APC も追加の収入となる。
༴ୖ⋙
䝌䝇䝛䜼䝧䞀䝎䝯
2␊ᡥ䚮3␊ᡥ䜼䝧䞀䝎䝯
ᐼᰕ䝿⥽㞗㐛⛤
OA䟺䝥䜰䟻䜼䝧䞀䝎䝯
㉆ㄖ㈕䝦䝋䝯
䟺ᅒ᭡㤃䛑䜏䛴㉆ㄖ㈕䛱䜎䜑ථ䟻APC䝦䝋䝯
䟺ⴥ⩽䛑䜏䛴᥎㍍ᩩ䛱䜎䜑ථ䟻㧏
ୌᗐᢖ✇䛛䜒䛥ཋ✇䜘ర䜏䛑䛴 ᡥṹ䛭ฝ∟䛝䚮ᴏථ䜘ᚋ䜑 ㉆ ㉆ㄖ㈕䝦䝋䝯䛑䜏䛴 䝓䜨䝚䝮䝇䝍䜮䝛䜻䝫䝷 ㉆ㄖ㈕䜘ᚋ䛥䜼䝧䞀䝎䝯䛴ㄵᩝ䛑䜏 䛛䜏䛱APC䜘ථ䛮䛝䛬ᚋ䜑 䟺Double Dipping䟻 ⴥ⩽䛴OA㐽ᢝ 䟺ㄵᩝ༟న䟻 㻭㼒㼘㼕㼑㼄㼏 㻭㼒㼘㼕㼑㼄㼏 㻭㼒㼘㼕㼑㼄㼏 㻭㼒㼘㼕㼑㼄㼏 ༴ୖ䛴ሔྙ ⣺ ༴ୖ䛴ሔྙ ⣺OA
3
APC に関する課題
出典:林和弘. (2014). オープンアクセスを踏まえた研究論文の受発信コストを議論する体制作りに向けて. 科学技術動向. 145, P.19-25.
PredatoryなOAジャーナル
•
Beallリスト
•
600
弱の出版社
•
約400のタイトル
•
基準
•
編集体制
•
運営管理
•
規範
•
その他の基準
•
DOAJ
収録誌,OASPA会員
COPE
会員,国際STM出版
社協会会員か?など
http://scholarlyoa.com
http://scholarlyoa.files.wordpress.com/2012/11/criteria-2012-2.pdf
Butler, D. (2013). Investigating journals: The dark side of publishing. Nature, 495(7442), 433–435.
出版者
•
APCの会員割引例
出版者
会員費用
割引額
BMC
所属研究者・学生数
APC
の15%
Hindawi
固定年会費
※
アウトプットレベルと過去のHidawiでの出版傾向
APC
免除
RSP
固定年会費
APC
の25%
Springer
科学医学系の研究者・院生数
による 固定年会費
APC
の15%
研究者
•
OAジャーナルへの発表経験
著者
発表年
対象国
分野
発表経験
Rowlandsら
2004
全世界
全分野
11.0%
JANUL
2006
日本
全分野
7.0%
Hernandez-Borgesら
2006
スペイン
医学
0.5%
Warlickら
2007
アメリカ
医学
78.0%
Kennan
2007
オーストラリア
全分野
11.9%
Austinら
2008
オーストラリア
全分野
41.0%
Tarragoら
2008
キューバ
医学
7.0%
JISC
2008
イギリス
医学
64%-72%
Morrisら
2009
イギリス
生物医学
25.0%
SOAP
2011
全世界
全分野
52.0%
Wiley
2012
不明
全分野
32.0%
Bjorkら
2012
65カ国
全分野
49%-83%
SPARC Japan
2014
日本
全分野
46.7%
OAメガジャーナルの投稿事情
メガジャーナルに掲載された内容は,序報レベルか
メガジャーナルに掲載された内容は,序報レベルか
メガジャーナルに掲載された内容は,序報レベルか
メガジャーナルに掲載された内容は,序報レベルか
メガジャーナルに掲載された内容は,序報レベルか
メガジャーナルに掲載された内容は,序報レベルか
BMJ Open
PeerJ PLOS ONE SAGE Open
合計
はい
22.3
9.6
29.5
25.7
24.0
いいえ
77.2
90.4
70.5
74.3
76.0
他の学術雑誌に投稿したものの再投稿か
他の学術雑誌に投稿したものの再投稿か
他の学術雑誌に投稿したものの再投稿か
他の学術雑誌に投稿したものの再投稿か
他の学術雑誌に投稿したものの再投稿か
他の学術雑誌に投稿したものの再投稿か
BMJ Open
PeerJ PLOS ONE SAGE Open
合計
はい
67.6
37.2
49.8
46.8
52.6
いいえ
32.4
62.8
50.2
53.2
47.4
OAジャーナルへの投稿要因
Wiley
SPARC Japan
1
雑誌と論文の合致
分野における評価
2
IF
雑誌と論文の合致
3
所属学会の雑誌
IF
4
読者数の多さ
適切な査読
5
論文の編集上の質
読者数の多さ
研究助成機関
•
RCUK
•
研究助成を受けた成果のOA義務化方針
•
Gold OA
への助成→不可能であればIRへ登録
•
2013
年4月以降出版
•
Wellcome Trust
•
助成研究のOAを義務化
•
APC
への助成
RCUK
•
2013年4月以降,ブロックグラントを大学
に付与し,APC支払を支援
•
ブロックグラント
•
5
年間で1億英ポンド超を想定
•
5
年後に,75%をGold,25%をGreenでOAにすること
を目標
1
年目
2
年目
3
年目
4
年目
5
年目
RCUK
による
APC
助成金
1700
万(£) 2000万(£)
未定
未定
未定
ゴールドOAでの
発表論文の期待値
45%
53%
60%
67%
75%
Wellcome Trust
•
オープンアクセス方針
•
助成研究成果のOA義務化(2006-)
•
査読制学術雑誌掲載論文 + 学術図書・図書の章(2013/10-)
•
PMC
等で出版後6ヶ月以内に無料公開
•
セルフアーカイブよりも,OAジャーナルを勧奨
•
APC
助成金の提供
大学・大学図書館
•
APCへの対応状況(次スライド以降)
•
Jisc APCプロジェクト
•
APC
支払システム構築(Jisc APC)の実証実験
•
英国26大学,2研究助成機関,9出版社
•
Jisc monitorプロジェクト
•
Jisc APC
の後継プロジェクト
•
REF2020
のOA方針への対応
英国24大学のAPC
£0
£2,500,000
£5,000,000
£7,500,000
£10,000,000
2010
2011
2012
2013
2014
0
1500
3000
4500
6000
380
468
566
2364
5958
平均APC
1,689
1,747
1,720
1,685
1,658
APC
総額
APC
論文数
件数
2014
年は推定値
£0
£2,000,000
£4,000,000
£6,000,000
£8,000,000
2010
2011
2012
2013
2014
Wiley
Elsevier
PLOS
OUP
Springer
BMJ
Nature
ACS
CUP
T&F
£0
£750
£1,500
£2,250
£3,000
2010
2011
2012
2013
2014
ACS
BMJ
CUP
Elsevier
NPG
OUP
Springer
T&F
Wiley
Wellcome Trust APC支払状況
出典: Kiley, Robert (2014): Wellcome Trust APC spend 2012-13: data file. figshare. http://dx.doi.org/10.6084/m9.figshare.963054 を基に作成
Full OA
Hybrid
論文数
559
1,569
全論文数に
占める割合
25.5%
71.7%
APC平均
(£)
1,247
2,026
APC中央値
1,068
2,040
APC最大
3,996
6,000
APC最小
122
45.9
0
50
100
150
200
0
2000
4000
6000
Cost
cou
nt
type
Hybrid
Pure OA
Full OA
Hybrid
不明(60)
Wellcome Trust APC支払状況
Elsevier
Wiley-Blackwell
PLOS
OUP
NPG
Springer
BMC
BMJ Group
米国生化学・分子生物学
CUP
米国微生物学会
The Company of Biologists
Royal Society
ACS
T&F
APA
Portland Press
Sage
NAS
Society for General Microbiology
£0
£275,000
£550,000
£825,000 £1,100,000
31675
32843
33054
39407
40677
41997
43910
45524
47283
55040
57232
106805
121873
129089
190244
215712
310491
349270
546950
1033410
APA
NPG
Elsevier
T&F
BMJ
Springer
Wiley
英国微生物学会
OUP
The Company of Biologists
CUP
Portland Press
米国微生物学会
Sage
Royal Society
米国生化学・分子生物学会
BMC
ACS
PLOS
NAS
Frontiers
£0
£750
£1,500
£2,250
£3,000
857
864
1141
1255
1345
1387
1570
1574
1668
1713
1734
1751
1848
1980
2011
2024
2066
2210
2449
2696
2905
総額
平均
RCUK APC割当状況
ケンブリッジ
インペリアルカレッジ
UCL
オックスフォード
エディンバラ
マンチェスター
ブリストル
ノッティンガム
サウサンプトン
シェフィールド
リーズ
キングスカレッジ
バーミンガム
グラスゴー
リバプール
ワーウィック
ニューカッスル
カーディフ
ダーハム
クイーンマリー
エクセター
セントアンドリューズ
ストラックライド
アバディーン
ラフバラ
クィーンズ
ヨーク
サセックス
イーストアングリア
ライチェスター
£0
£325,000
£650,000
£975,000
£1,300,000 £1,625,000 £1,950,000 £2,275,000 £2,600,000
£188,234 £190,044 £191,672 £193,408 £205,367 £206,649 £211,355 £235,609 £239,521 £254,038 £276,389 £325,386 £359,148 £410,321 £415,036 £423,032 £479,680 £485,401 £487,891 £521,874 £574,065 £575,131 £630,889 £684,232 £969,952 £977,118 £1,297,116 £1,351,843 £1,353,480 £1,355,073 £159,999 £161,538 £162,921 £164,397 £174,562 £175,652 £179,652 £200,267 £203,593 £215,932 £234,930 £276,578 £305,276 £348,773 £352,781 £359,578 £407,728 £412,591 £414,707 £443,593 £487,955 £488,861 £536,256 £581,597 £824,459 £830,550 £1,102,549 £1,149,066 £1,150,458 £1,151,812出典:http://www.rcuk.ac.uk/RCUK-prod/assets/documents/documents/RCUK_APCfundDistribution.pdf を基に作成
2013
2014
総額(£)
16,853,339 19,827,459
対象大学
107
107
論文数
10,168
11,958
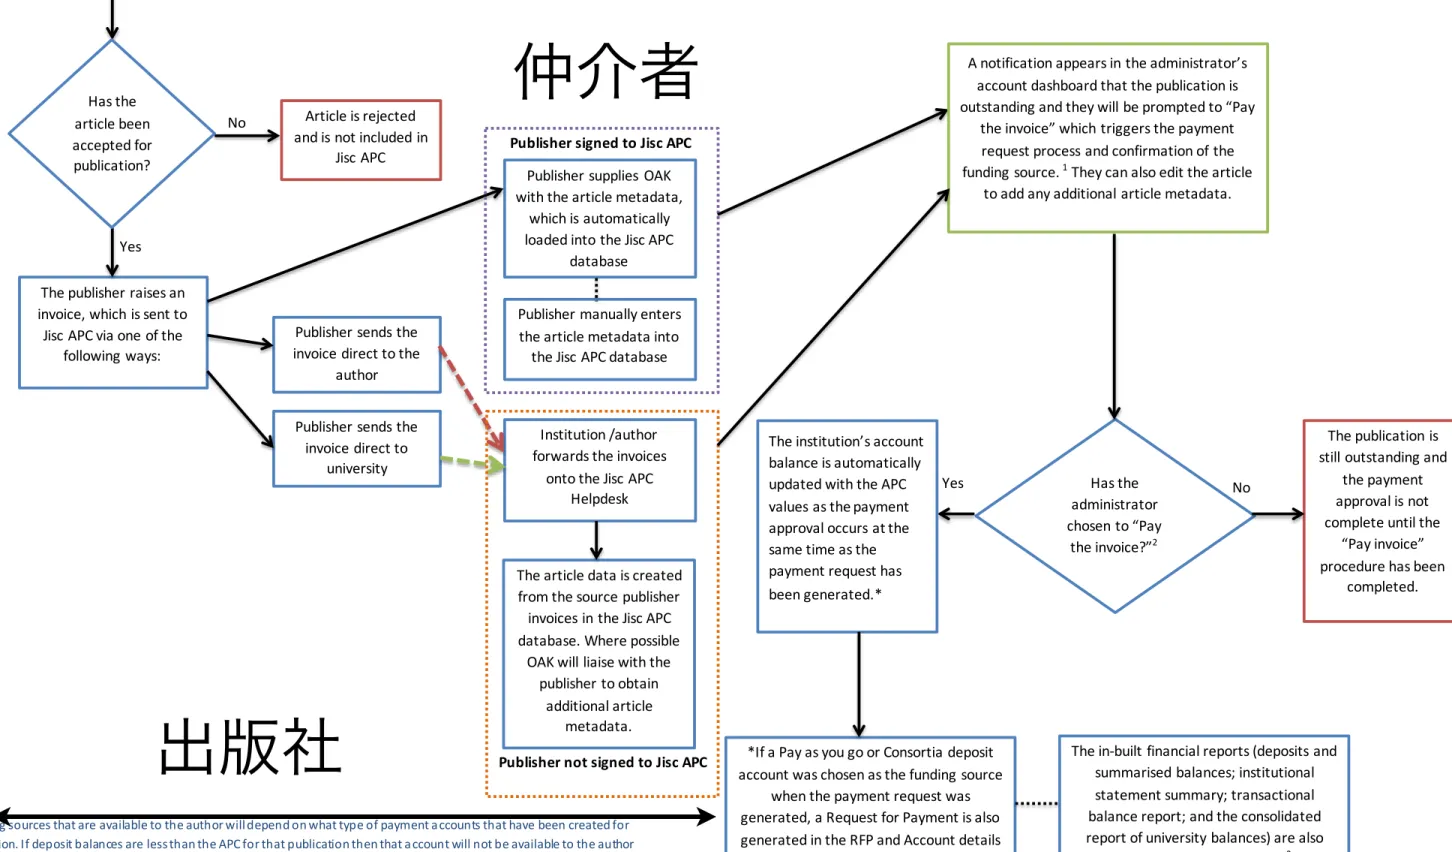
An author submits an article to a journal for Open Access publication
Article is rejected and is not included in
Jisc APC
The publisher raises an invoice, which is sent to Jisc APC via one of the
following ways: Has the article been accepted for publication? No Yes
Publisher supplies OAK with the article metadata,
which is automatically loaded into the Jisc APC
database
Publisher manually enters the article metadata into
the Jisc APC database Publisher sends the
invoice direct to the author Publisher sends the
invoice direct to university
Institution /author forwards the invoices
onto the Jisc APC Helpdesk
Publisher signed to Jisc APC
Publisher not signed to Jisc APC
A notification appears in the administrator’s account dashboard that the publication is outstanding and they will be prompted to “Pay
the invoice” which triggers the payment request process and confirmation of the funding source. 1 They can also edit the article
to add any additional article metadata.
Has the administrator chosen to “Pay the invoice?”2 Yes The publication is still outstanding and
the payment approval is not complete until the
“Pay invoice” procedure has been
completed. No
The institution’s account balance is automatically updated with the APC values as the payment approval occurs at the same time as the payment request has been generated.*
*If a Pay as you go or Consortia deposit account was chosen as the funding source
when the payment request was generated, a Request for Payment is also generated in the RFP and Account details
tabs in the administrator account.
The in-built financial reports (deposits and summarised balances; institutional statement summary; transactional balance report; and the consolidated report of university balances) are also
updated at the same time.3
Jisc APC workflow university administrators who manage the APC’s
on behalf of their authors
1
The funding sources that are available to the author will depend on what type of payment a ccounts that have been created for tha t i nstitution. If deposit balances are less than the APC for that publication then that a ccount will not be available to the author to choose from as a funding s ource.
2
Admi nistrators ca n edit a n article to change the funding source for that publication to resend the payment request before it has been a pproved.
3
The fi nancial reports provide a detailed breakdown of transactions; RFP’s where VAT was charged / not charged; account ba lance movements, payments made to date and any outstanding APC’s that are due for payment for Pa y as you go a ccounts.
The article data is created from the source publisher invoices in the Jisc APC database. Where possible
OAK will liaise with the publisher to obtain additional article metadata.
出版社
大学
仲介者
著者
Wellcome Trust open access process
Is it a peer-reviewed research output?
UCL author submits an article, book chapter or monograph¹ based on research funded in whole or in part by
the Wellcome Trust
Does the journal have a Wellcome-compliant Gold option?⁷
Check [email protected]⁸
The Wellcome Trust policy does not apply to editorials, reviews or conference proceedings. APCs can be paid for Wellcome-funded review articles, at the author’s option. The RCUK process² will apply if
the article is part-RCUK-funded. Otherwise, UCL can fund the article processing charge if the author would like Gold open access³; or
submit the article to UCL Discovery⁴ if the publisher permits
Follow the instructions in the
Wellcome Trust authors’ guide¹¹. Deposit author’s final version in
Europe PMC¹⁰ (unless publisher does so) and UCL Discovery.⁴ The UCL Discovery team will make it
available in UCL Discovery after any embargo period. This fulfils the requirements of UCL’s open access
mandate
Has UCL joined the publisher’s OA
membership scheme? See list⁵
Yes No Yes No No Yes
Order publisher’s paid open access option, supplying UCL’s VAT no.: GB 524 3711 68, or ask the Open Access Team to do so for you When you receive the invoice, send it to the
Open Access Team, who’ll arrange payment.⁹
They will also deposit the publisher PDF in UCL Discovery, in compliance with UCL’s
open access mandate
Does the publisher allow self-deposit (or does it deposit on behalf of
authors) in Europe PMC¹⁰ 6 months
after publication? No
Yes
Select prepaid / UCL pays / institutional payment option when ordering open access.⁶
UCL’s Open Access Team will authorise payment. They will also deposit the publisher PDF in UCL Discovery, in compliance with UCL’s
open access mandate
COPE
Compact for Open‐Access Publishing Equity
•
研究機関によるAPC助成制度提供協定
•
協定機関が所属研究者によるOAジャーナル発表論文
へ助成し, 永続的なAPC助成制度を確立
•
OA
ジャーナルと予約購読型雑誌とを同じ土俵に
•
米国21大学 +世界 33研究機関
•
HOPE Harvard Open-Access Publishing Equity
•
DOAJ
収録誌,OASPA会員
APCが取り得るシナリオ
•
OAジャーナルの文献
レビュー,市場分析
•
研究助成機関が取り
得るAPC方針のシナ
リオ(付録参照)
•
日本語訳有り
Improving School Governance | 3
Open access publishing
Developing an Effective
Market for Open Access
Article Processing Charges
Bo-Christer Björk and David Solomon
March 2014
http://www.wellcome.ac.uk/About-us/Policy/Spotlight-issues/Open-access/Guides/WTP054773.htm http://dx.doi.org/10.6084/m9.figshare.951966
シナリオ1:APC償還型
•
APCがリストプライスで償還され,ハイブリッドは
特定機関の予約購読費の削減が保証される
S
•
完全OAジャーナルの市場は機能
している
•
APC
助成金の確保と予約購読型
雑誌の提供
W
•
APC
の支払プロセス未確立
•
二重支払いの統制条件
•
価格競争の非促進
O
•
助成が増加すれば,完全OA出版
への移行を加速
•
透明性が高く,適切な価格設定
の完全OAジャーナル市場を維持
できる可能性
T
•
伝統的出版者による予約購読費と
APC
とのバンドリング,OA出版者買
収
•
全額助成は著者のコスト意識を低減
させ,APC価格の上昇につながる
•
二重支払いの統制は,難問
•
シナリオ2:
多段階・キャップ型
•
APCが多段階の,価値ベースのプライスキャ
ップに従って助成される(雑誌の質で差別化)
S
•
APC
価格設定に競争と透明性を
もたらす
•
完全OAとハイブリッドOAを一
つのスキームで扱える
W
•
学術雑誌の質を計る単一の指標
の欠如
•
サービスの定量化・測定
•
被引用数の代替利用
O
•
OA
利用の大幅増加
•
出版プロセスの効率化
•
移行コストの制限と完全OAへの
移行手段を提供
T
•
出版者による操作
•
出版者によるキャップ限界まで
の価格設定とインフレの可能性
Scopus索引タイトルへ適用
Full OA
(Scopus)
Full OA
(Scopus)
( Wellcome Trust )
( Wellcome Trust )
Full OA
Full OA
プライスキャップ
平均APC
論文数
平均APC
論文数
1000
ドル
809.92
29,628
1350.00
140
2000
ドル
1,576.08
29,195
1,673.49
628
シナリオ3:分担負担型
•
研究助成機関がAPCの固定割合を負担し,
残りを大学あるいは著者が他の資金源で負担
S
•
著者のコスト意識の高める
•
出版者が競争的にAPCの価格付け
•
助成機関はOA利用を促進
•
透明性と価格競争を伴う市場の促進
W
•研究機関・研究者の間接経費上昇
•他の資金源のない研究者が不利益
を被る(自費支払い)
O
•完全OAの市場を維持し,ハイブリ
ッドの市場も同様に機能させうる
T
•
OA
の利用を促す,価格の閾値設
定,著者負担割合に妥当なバラン
スを設定できるか
報告書の結論
•
APC市場の革新性維持と価格競争を保証
•
無条件に全額補助するAPC資金→価格競争力?
•
予約購読費とAPCをバンドリング→透明性・競争性?
•
大手出版社によるビッグディールとバンドリング?
•
ハイブリッドAPCは市場として機能するか?
•
APC
分の予約購読費減額→把握困難
•
ビッグディールが主流→個別タイトル価格低下の意味?
•
研究大学の支払額増額?
•
各助成者が,シナリオを参考に要件や目標を設定
すべき
最後に
•
日本においてはAPCへの対応が喫緊の課題で
はないが,研究者間にAPCを伴うOAジャー
ナルは普及しつつある
•
APCへの対応
•
国際的動向の把握
•
情報収集と国内外での共有
•
APC
の透明性,競争性を確保
•
仲介者(JUSTICE?)
12シナリオ:
完全OAジャーナル
•
F1:APCをリストプライスで償還
•
F2:研究助成機関がAPCの固定割合を負担し,大学あるいは著者
型が残りを他の資金源で賄う必要がある
•
F3:APCが,多段階の価値ベースのプライスキャップによって助
成される
•
F4:サービス,品質,価格に基づいて,雑誌がハイブリッド契約
の入札を行う。特定数の雑誌に対して,研究助成機関が利用可能
な助成金に基づき,契約を行う。
12シナリオ:
ハイブリッドジャーナル
•
H1:APCをリストプライスで償還
•
H2:APCはリストプライスで償還されるが,限定移行期間(5年)ある
いは出版社による雑誌の完全OA転向が期待されるレベルで,ハイブリッ
ドの利用が世界規模で閾値に達するまで
•
H3:APCがリストプライスで償還され,世界規模で「二重取り」が生じ
ないことを保証する適当なメカニズムを伴う
•
H4:APCがリストプライスで償還され,ローカルレベルで「二重取り」
が生じないことを保証する適当なメカニズムを伴う
•
H5:研究助成機関がAPCの固定割合を負担し,大学あるいは著者型が残
りを他の資金源で賄う必要がある
•
H6:APCが,多段階の価値ベースのプライスキャップによって助成され
る
•
H7:サービス,品質,価格に基づいて,雑誌がハイブリッド契約の入札
を行う。特定数の雑誌に対して,研究助成機関が利用可能な助成金に基づ
き,契約を行う。
•
H8:APCはハイブリッドジャーナルに対しては助成されない
Wellcome Trust APC支払状況
出版者
総額(£)
累計シェア
APC
(平均)(£)
Elsevier 1,033,410 26.6% 2,449
Wiley-Blackwell 546,950 40.6% 2,011
PLOS 349,270 49.6% 1,141
Oxford University Press 310,491 57.6% 1,848
Nature Publishing Group 215,712 63.1% 2,696
Springer 190,244 68.0% 2,024
BioMed Central 129,089 71.4% 1,345
BMJ Group 121,873 74.5% 2,066
American Society for Biochemistry and Molecular
Biology 106,805 77.2% 1,387
Cambridge University Press 57,232 78.7% 1,734
American Society for Microbiology 55,040 80.1% 1,668
The Company of Biologists 47,283 81.3% 1,751
Royal Society 45,524 82.5% 1,570
American Chemical Society 43,910 83.6% 1,255
Taylor and Francis 41,997 84.7% 2,210
American Psychological Association 40,677 85.8% 2,905
Portland Press 39,407 86.8% 1,713
Sage 33,054 87.6% 1,574
National Academy of Sciences 32,843 88.5% 864
Society for General Microbiology 31,675 89.3% 1,980
RCUK APC割当上位30大学
大学 ブロックグラント額(£) 論文数(予測) ブロックグラント額(£) 論文数(予測)University of Cambridge 1,151,812 695 1,355,073 817 Imperial College London 1,150,458 694 1,353,480 816 University College London 1,149,066 693 1,351,843 815 University of Oxford 1,102,549 665 1,297,116 782 University of Edinburgh 830,550 501 977,118 589 The University of Manchester 824,459 497 969,952 585 University of Bristol 581,597 351 684,232 413 University of Nottingham 536,256 323 630,889 381 University of Southampton 488,861 295 575,131 347 University of Sheffield 487,955 294 574,065 346 University of Leeds 443,593 268 521,874 315 King's College London 414,707 250 487,891 294 University of Birmingham 412,591 249 485,401 293 University of Glasgow 407,728 246 479,680 289 University of Liverpool 359,578 217 423,032 255 University of Warwick 352,781 213 415,036 250 Newcastle University 348,773 210 410,321 247 Cardiff University 305,276 184 359,148 217 Durham University 276,578 167 325,386 196 Queen Mary, University of London 234,930 142 276,389 167 University of Exeter 215,932 130 254,038 153 University of St Andrews 203,593 123 239,521 144 University of Strathclyde 200,267 121 235,609 142 University of Aberdeen 179,652 108 211,355 127 Loughborough University 175,652 106 206,649 125 Queen's University of Belfast 174,562 105 205,367 124 University of York 164,397 99 193,408 117 University of Sussex 162,921 98 191,672 116 University of East Anglia 161,538 97 190,044 115 University of Leicester 159,999 97 188,234 114