Contents lists available atScienceDirect
Atmospheric Environment
journal homepage:www.elsevier.com/locate/atmosenv
Statistical analysis of dispersal and deposition patterns of volcanic emissions
from Mt. Sakurajima, Japan
Alexandros P. Poulidis
a,∗, Tetsuya Takemi
a, Atsushi Shimizu
b, Masato Iguchi
c,
Susanna F. Jenkins
daDisaster Prevention Research Institute, Kyoto University, Uji, 611-0011, Japan bNational Institute for Environmental Studies, Tsukuba, 305-8506, Japan
cDisaster Prevention Research Institute, Kyoto University, Kagoshima, 891-1419, Japan dEarth Observatory of Singapore, Nanyang Technological University, Singapore, 639798, Singapore
A R T I C L E I N F O
Keywords:
volcanic emissions Sulphur dioxide Particulate matter Air pollution Volcanic ash Inverse power law Sakurajima Japan
A B S T R A C T
With the eruption of Eyjafjallajökull (Iceland) in 2010, interest in the transport of volcanic ash after moderate to major eruptions has increased with regards to both the physical and the emergency hazard management aspects. However, there remain significant gaps in the understanding of the long-term behaviour of emissions from volcanoes with long periods of activity. Mt. Sakurajima (Japan) provides us with a rare opportunity to study such activity, due to its eruptive behaviour and dense observation network. In the 6-year period from 2009 to 2015, the volcano was erupting at an almost constant rate introducing approximately 500 kt of ash per month to the atmosphere. The long-term characteristics of the transport and deposition of ash and SO2in the area surrounding the volcano are studied here using daily surface observations of suspended particulate matter (SPM) and SO2and monthly ashfall values.
Results reveal different dispersal patterns for SO2and volcanic ash, suggesting volcanic emissions’separation in the long-term. Peak SO2concentrations at different locations on the volcano vary up to 2 orders of magnitude and decrease steeply with distance. Airborne volcanic ash increases SPM concentrations uniformly across the area surrounding the volcano, with distance from the vent having a secondary effect. During the period studied here, the influence of volcanic emissions was identifiable both in SO2and SPM concentrations which were, at times, over the recommended exposure limits defined by the Japanese government, European Union and the World Health Organisation.
Depositional patterns of volcanic ash exhibit elements of seasonality, consistent with previous studies. Climatological and topographic effects are suspected to impact the deposition of volcanic ash away from the vent: for sampling stations located close to complex topographical elements, sharp changes in the deposition patterns were observed, with ash deposits for neighbouring stations as close as 5 km differing as much as an order of magnitude. Despite these effects, deposition was sufficiently approximated by an inverse power law relationship, thefidelity of which depended on the distance from the vent: for proximal to intermediate areas (20 km), errors decrease with longer accumulation periods (tested here for 1–72 months), while the opposite was seen for deposition in distal areas (>20 km).
1. Introduction
Volcanoes are a well-known source of natural pollutants. Large volcanic eruptions can introduce volcanic ash and gases (collectively referred to here as volcanic emissions) near the top of the troposphere or into the stratosphere (> ∼10km), creating a hazard for aviation and causing disruption, cancellations and economic damage (Bonadonna et al., 2012; Langmann et al., 2012), as well as significantly altering the
atmospheric composition and even affecting the climate, as in the case of the 1991 Mt. Pinatubo, Philippines eruption (McCormick et al., 1995). Settled volcanic ash can directly affect life (via accidents), li-velihoods (destroying crops and pastures), and infrastructure, for ex-ample by causing roof and building collapses, damaging and disrupting electricity networks, clogging drainage systems and contaminating water supplies (Ayris and Delmelle, 2012; Wilson et al., 2012; Hampton et al., 2015). Although large eruptions are the subject of numerous
https://doi.org/10.1016/j.atmosenv.2018.02.021
Received 10 November 2017; Received in revised form 7 February 2018; Accepted 9 February 2018 ∗Corresponding author.
E-mail address:[email protected](A.P. Poulidis).
Atmospheric Environment 179 (2018) 305–320
Available online 15 February 2018
1352-2310/ © 2018 The Authors. Published by Elsevier Ltd. This is an open access article under the CC BY license (http://creativecommons.org/licenses/BY/4.0/).
studies, volcanoes with diffused emissions or small but frequent erup-tions have received less attention (Delmelle et al., 2002).
Volcanic emissions from such volcanoes have a direct effect on the atmospheric composition and air quality in the surrounding area (Sellitto et al., 2017). Long-term exposure to particulate matter (PM) is known to correlate with severe health effects such as increased cardi-ovascular, respiratory, and allergic diseases, leading to enhanced mortality rates (Bernstein et al., 2004; Pöschl, 2005; Pope and Dockery, 2006), depending largely on the composition of the aerosol (Pöschl, 2005). Exposure to large amounts of volcanic ash can trigger potentially deadly attacks of bronchitis and asthma (not limited to asthma patients) and long-term exposure to crystalline silica can cause silicosis (fibrotic lung disease), making it the most potentially toxic mineral in volcanic ash (Baxter et al., 1999; Horwell and Baxter, 2006). Volcanic ash is released in a range of sizes (2 mm down toμm scale), varying with each
volcano and even for different eruption styles for a specific volcano. The health impact of volcanic ash critically depends on the size of the ash, and thus the distribution of ash size (typically referred to as the grain size distribution; GSD) for an eruption is crucial for health impact studies (Horwell, 2007). Aside from the physiological effects, long-term exposure to volcanic ash (and increased air pollution in general) can also cause psychological stress and lead to increased absenteeism from school or work (Pope et al., 1995; Jenkins et al., 2015). Finally, ash deposits also impose the economic burden of regular clean-up and maintenance of vulnerable infrastructure (Hayes et al., 2015).
Volcanic gas composition varies with each volcano with the most common gases including water vapour (H2O), carbon dioxide (CO2), sulfur dioxide (SO2), hydrogen sulfide (H2S), carbonile sulfide (COS), carbon disulfide (CS2), hydrogen chloride (HCl), hydrogen bromide (HBr), and hydrogenfluoride (HF) (Textor et al., 2004; von Glasow et al., 2009). Of these, the most important gas pollutants are CO2, SO2, HCl, and HF (Delmelle et al., 2002). Although studied to a lesser degree than volcanic ash, volcanic gases also have the potential to affect the communities around a volcano (Hansell and Oppenheimer, 2004). For example, high concentrations of CO2can cause unconsciousness after a few minutes of exposure, which may result to seizures and death, as evidenced during the Lake Nyos disaster in Cameroon (Kling et al., 1987; Wagner et al., 1988; Baxter et al., 1989).
SO2is a volcanic gas commonly monitored in active volcanoes as it can act as a reliable indicator of the presence of magma during unrest (Oppenheimer et al., 2014) and can be used as a tracer due to its re-lative ease of observation (either directly or by satellite measurements for large eruptions), and abundance in the eruption budget (between 1 and 25% per volume (Textor et al., 2004; von Glasow et al., 2009)). Short-term exposure to high concentrations of SO2(over 500–1300μg/ m3) can lead to irritation of the eyes and in the case of asthma patients respiratory tract and airway constriction (Hansell and Oppenheimer, 2004), while significantly high concentrations (262 mg/m3) can be immediately dangerous (US Department of Health and Human Services, 1993). Long-term exposure to SO2has been implicated in increased mortality ratios for bronchitis and pneumonia as well as neonatal mortality in the case of Mt. Sakurajima in Japan, but large uncertainties remain (Shinkura et al., 1999; Hansell and Oppenheimer, 2004; Hillman et al., 2012). Finally, increased emissions of SO2and HCl can lead to increased occurrence of acid rain (Johnson and Parnell, 1986; Granieri et al., 2017).
The health impact of high concentrations of PM and pollutants (including volcanic emissions) has prompted the World Health Organisation (WHO) as well as governing bodies (for example the Japanese government and the European Union; JP and EU respectively) to establish exposure limits on the hourly, daily or annual concentra-tions (Table 1). Note that SO2concentrations are commonly measured in parts per billion. Here we opted to convert the values to micrograms per cubic meter to have a common unit for all emissions (for SO2 1 ppb = 2.62μg/m3at 25°C temperature and 1013 mb pressure).
In this study we focus on Mt. Sakurajima in southern Japan and
examine the typical patterns of transport and deposition of volcanic emissions (volcanic ash and SO2) for a 6-year period between June 2009 to May 2015. Initially, we will introduce Sakurajima and the observational network around it (Section2). Next, we will examine the impact of volcanic emissions on the air quality of the surrounding area and its seasonal changes (Section3). After that, we will check the ap-plicability, limits and seasonal trends of an inverse power lawfitting for monthly to yearly accumulations of ashfall (Section4). Finally we will discuss the main points drawn from and the broader implications of the results (Section5), before summarising the findings in a concluding section (Section6).
2. Location and methodology
2.1. Mt. Sakurajima location, eruptive history and surroundings
Mt. Sakurajima (peak height 1117 m) is located on the island of Kyushu in southern Japan (31.58 N, 130.65E;Fig. 1a and b). The vol-cano started forming approximately 26,000 years ago on the southern rim of the Aira Caldera, a complex system with rich eruptive history over the last 100,000 years (Kobayashi et al., 2013). Sakurajima has two edifices, a dormant edifice on the northern side (Kitadake) and Minamidake, which is the current edifice in the south (Fig. 1c). Since its formation, deposits from seventeen sub-Plinian and Plinian eruptions (i.e. eruptions with total eruptive mass between 1011–1013kg (Cioni et al., 2000)) have been identified (Todde et al., 2017). Four of these have occurred during historic times (i.e. since the early sixth century) and three have occurred within the last six centuries: the Bunmei (1471–1476), Anei (1779–1782), and Taisho (1914–1915) eruptions, with the last being the largest eruption in Japan during the twentieth century (Biass et al., 2017).
Despite its potential for larger eruptions, the volcano has been erupting since 1955 with a series of ash-rich vulcanian eruptions (small to moderate-sized, short-lived eruptive bursts; (Morrissey and Mastin, 2000);). The latest eruptive phase started in 2006 with the newly formed Showa crater in the south side of the volcano (Fig. 1c). Volcanic activity started increasing towards the end of 2008 and since the middle of 2009 the volcano was erupting at an almost constant rate: approxi-mately 80 eruptions per month leading to approxiapproxi-mately 500 kt of ash ejected per month (A1–6 inFig. 2a and b). Note that the ash emission values here were estimated from summing up interpolated monthly ashfall data and is mainly used for qualitative purposes (see Section4.2 for details). During this period, the maximum volcanic plume height recorded by the Japan Meteorological Agency (JMA) was 5 km above ground level (agl) during an eruption that occurred on 18 August 2013 (JMA, 2013; Poulidis et al., 2017); other than that, maximum plume heights range between 1.5 and 4 km (Fig. 2c). Despite a trend towards increased plume heights in the latter years of the study period, the median (and average) values range between 1 and 2 km agl, with large eruptions (plume height over 3 km agl) comprising less than 2%of the eruptions. Volcanic activity was significantly reduced after June 2015, Table 1
Pollutant limits set by the Japanese government (JP), European Union (EU), and the World Health Organisation (WHO) relevant to the study. Values originally presented in parts per billion were changed to micrograms per cubic meter: for SO2, 1 ppb = 2.62μg/ m3.
Value (μg/m3) Conditions Issuer
SO2 105 24-h average JP
125 24-h average EU
52 1-y average WHO
SPM 100 24-h average JP
PM10 50 24-h average WHO
20 1-y average WHO
40 1-y average EU
leading to a monthly average of approximately 50 kt of ash emitted from the volcano (Q1–2 inFig. 2).
According to the 2015 census data, the volcano is home to 3336 permanent residents (Statistics Bureau, 2016). The closest cities are Kagoshima to the west with 596,478 residents (excluding those living on the volcano), Tarumizu and Kanoya to the south with 15,520 and 103,608 residents respectively, Aira to the northwest (76,909 residents) and Kirishima to the northeast with 125,867 residents (Fig. 1d).
Due to the volcano's frequent activity and the high population density of the surrounding area, a large number of studies related to the health impacts of volcanic emissions have focused on Sakurajima (for example Wakisaka et al. (1978); Yano et al. (1985, 1990); Shinkura et al. (1999); Uda et al. (1999); Samukawa et al. (2003)). Findings from these reports have been summarised in recent studies byHansell and Oppenheimer (2004), focusing on volcanic gases for a number of
volcanoes, andHillman et al. (2012), focusing on the effects of volcanic ash from Sakurajima. Both reports question some of the conclusions drawn from the previous studies due to uncertainties in the metho-dology, but conclude that the impact of high concentrations is still not completely understood and that emissions should be monitored (Hansell and Oppenheimer, 2004; Hillman et al., 2012). Notably, all these studies were carried out before the period of increased volcanic activity studied here. It is hoped that the addition of the recent data studied here can be used in future analyses on the links between vol-canic emissions and health impacts.
2.2. Observational network
We use here observational data from two networks around the volcano for volcanic emissions and ashfall as well as wind speed and Fig. 1.(a) Location of Mt. Sakurajima in Japan. (b) Hillshade map of the Kagoshima prefecture showing tephrameters (orange), Atmospheric Environmental Regional Observation System (AEROS) stations (blue) and the meteorological station in Kagoshima (purple). Coastline (black line) is shown using the global, self-consistent, hierarchical, high-resolution shoreline (GSHHS) data (Wessel and Smith, 1996) and topography data are based on the Geospatial Information Authority of Japan (GSI) 50 m digital elevation model (DEM). (c) Google Earth satellite image of Sakurajima with the Kitadake and Minamidake edifices, Showa crater, and the four AEROS stations on the volcano. (d) Municipal map of the Kagoshima prefecture with city boundaries. The full names of the cities can be seen inTable 2. (For interpretation of the references to colour in thisfigure legend, the reader is referred to the Web version of this article.)
direction data from the meteorological station in the city of Kagoshima (31.55°N/130.55°E, World Meteorological Organisation (WMO) code: 47827). Rawinsondes are launched twice daily at 0900 and 2100 Japan Standard Time (JST = UTC+9). Information on the date and plume height of eruptions from the volcano were provided by the JMA.
Volcanic emissions are recorded indirectly via the Ministry of
Environment's (MoE) Atmospheric Environmental Regional
Observation System (AEROS or Soramame in Japanese). The network covers the entire region of Japan: tentative data are collected by each prefecture and are sent to the MoE to be displayed in near real-time. Data are then validated and archived by the National Institute for Environmental Studies (NIES). Here we used 24-h averages based on archived data between 2009 and 2015 and tentative data for 2016–2017.
In the Kagoshima prefecture there are 17 AEROS stations (Fig. 1b,d). SO2, Suspended Particulate Matter (SPM; particulate matter which passes through a size-selective inlet with a 100%efficiency cut-offat 10μm aerodynamic diameter), and PM2.5 (effectively PM smaller
than 2.5μm) are monitored amongst a number of pollutants. Only SPM
concentrations are used here, as PM2.5 observations do not cover the whole study period and the number of stations observing PM2.5 is too small to allow for a meaningful analysis. Note that SPM (used only in Japan) differs from PM10 in that a 100% efficiency cut-offis used, unlike the 50%cut-offused for PM10 and PM2.5 (McMurry, 2000). This makes SPM similar to PM8 (Kashima et al., 2009); however, here we will be using SPM as a proxy for PM10. AEROS stations are relatively sparse, covering only 7 out of the 22 municipalities (Fig. 1d).
Ashfall data are gathered and archived by the Kagoshima pre-fectural government since 1978 (Iguchi, 2016). Tephrameters (0.57 m-diameter drum-type samplers) are used to measure ashfall at 62
locations around the volcano (Fig. 1b,d). As the majority of these tions measure ashfall monthly we will use monthly values for all sta-tions here. Tephrameter station spacing (defined here as the average distance between a station and its two nearest stations) is increased away from the volcano, starting at 1.2 km on the volcano and increasing almost linearly up to 16.4 km at 49.4 km from the vent (seeFig. 6a). Although the majority of tephrameters are located on the volcano or in the city of Kagoshima, most of the municipalities in the prefecture (21 out of 22) are covered by at least one tephrameter (Fig. 1d).
Due to the monthly nature of the measurements, when analysing tephrameter data it is important to keep in mind that the effect of ash resuspension might influence the observations and that resuspension of light ash from within the equipment cannot be ruled out (although the two effects can act to partially cancel each other out). Finally, due to the long-term nature of the observations only the ashfall load is mea-sured, i.e. no GSD data are collected.
The study focuses on the 6-year period between June 2009 to May 2015 (referred to as“active”period here and marked as A1–6 inFig. 2). Unlike ashfall, SPM and SO2concentrations cannot be attributed solely to the volcano. Hence, when studying the emissions, AEROS data will also be used for the two years that followed, from June 2015 to May 2017 (“quiescent”period; Q1–2 inFig. 2), in order to establish back-ground values of low-level volcanic activity to compare to the 6-year period that preceded it.
3. Suspended volcanic ash and gases
Pollutant concentrations measured are the result of mixed anthro-pogenic, volcanogenic and other natural emissions. Natural sources can include other volcanoes in the region (for examples Mt. Shinmoedake Fig. 2.Volcanic activity from Sakurajima between May 2009 and April 2017. (a) Number of eruption per month. Bar shading shows the proportion of different eruption heights. (b) Estimates of ash emitted per month. (c) Box-and-whiskers plot of volcanic plume heights (agl) based on minimum,first quartile, median, third quartile and maximum reported values. The dashed line separates the“active”period (A1–6) and the“quiescent”period (Q1–2).
and Mt. Aso to the north and northeast respectively), as well as Asian dust (yellow sand or kosa) that originates from the interior of Eurasia (i.e. inner and outer Mongolia and the Takla Makan desert;Shimizu et al. (2004); Mikami et al. (2006)) and can reach Japan, the United States or even circumnavigate the globe (Uno et al., 2009). Shinmoe-dake (part of the Kirishima volcano) erupted in 2011; however, ash was transported to the southeast, leaving the Kagoshima prefecture largely unaffected (Miyabuchi et al., 2013; Maeno et al., 2014). Initially, the stations were categorised based on their distance from the vent: prox-imal (up to 5 km from the vent), intermediate (between 5 and 20 km from the vent), and distal (farther than 20 km).
The concentration of SO2 shows a drastic decrease with distance from source (Fig. 3a). Close to the volcano, average concentrations for the active period range between 5 and 80μg m−3 depending on the station bearing from the vent, while for the intermediate and distal stations the range is decreased to 5–10μg m−3 and 3
–11μg m−3 re-spectively. During the quiescent period SO2concentrations are reduced to background values. This reduction is most notable for stations on the southern side of the volcano (thefirst and fourth points from the left in Fig. 3a) where concentrations were decreased by a factor of 8–19 compared to the active period. For intermediate and distal stations, SO2 values during the quiescent period were reduced by 29–47%compared to the active period. Note that during the active period the average for the closest station (located at Arimura, southeast of the Showa crater) has an average SO2value of 80μg m−3, which is consistently over the
yearly recommended WHO limit and that in previous studies on the health effects of SO2 (1978–1988; Shinkura et al. (1999)) average concentrations near Sakurajima were lower than those during this period (even compared to the overall average over the volcano).
Unlike SO2, SPM concentrations are similar at all distances from the volcano (Fig. 3a). SPM values during the quiescent period reveal a baseline value of approximately 20μg m−3. Across all distances, com-paring the emissions during the two periods shows that suspended volcanic ash increases average SPM values between 22 and 30%(for the distal to proximal groups respectively). Unlike SO2 emissions, volca-nogenic SPM push the yearly average of SPM concentration over the yearly PM10 limit suggested by WHO, but it remains within the limits
proposed by the EU (Table 1). During the quiescent period most of the stations are close to or below the 20μg m−3WHO limit.
SO2emissions vary considerably on a daily basis, ranging between zero up to the maximum values. This is reflected in the interquartile range of the concentrations which is comparable to the average values, with a similar decrease both with distance from the vent and between the active and quiescent periods (Fig. 3b). On the other hand, SPM concentrations show less variability, with the interquartile range for all stations and for both periods ranging between 7 and 13μg m−3
(Fig. 3c). Due to the inherent variability of SO2emissions it is pertinent to study the impact of the daily variabilty by examining the percentage of days over the proposed exposure limits.
When average 24-h values are checked against the daily re-commended JP and EU thresholds, results vary significantly based on the locations of the stations (Fig. 4a and b). Average values for the active period for the two stations on the southern side of the volcano are 16.9–19.4%(Arimura; SE,Fig. 1c) and 7.6–8.6%(Akamizu; SW) of the days are over the limits suggested by EU (lower percentage) and the Japanese government (higher percentage) respectively. The majority of these days are during the winter period for Arimura and during the autumn period for Akamizu. On the northern side of the volcano per-centages are significantly lower: 1.8–2.1% (Kurokami; E) and 0.4% (Fujinosaki; NW). All values are decreased to below 1% during the quiescent period. The city of Kagoshima is generally unaffected by SO2, with the maximum percentage of days over the limit in the city 0.9% during the active period dropping down to 0% during the quiescent period. To the southeast of the volcano, data from the westernmost station in the municipality of Kanoya show that concentrations are over the threshold 0.9–1.2% of the active period (down to 0% during the active). These points towards the fact that the city of Tarumizu (located between Arimura and Kanoya) might also be affected by high con-centrations of SO2.
Regarding SPM concentrations, both stations on the southern part of the volcano are over the suggested limit during the active period for 10%of the days, which drops down to 2.5%during the quiescent period (Fig. 4d). Over the northern side, percentages are lower with an average of 2.9%dropping to 1.2%. Over Kagoshima, the maximum percentage at Fig. 3.(a) Average concentration for SO2(black markers) and SPM (white markers) against distance from the vent for A1–6 (downwards triangle marker) and Q1–2 (upwards triangle marker). (b),(c) Interquartile range for: (b) SO2, (c) SPM. Note that logarithmic scales is used for both axes in Panels (a),(c) and only for the x-axis in Panel (b).
the northern part of the city is 10%, which is reduced to 1.1%and at the other points in the prefecture the average of 3.6%drops down to 0.9% during the quiescent period. Note that calculations presented here were carried out for the limit suggest by WHO; for the limit suggested by the Japanese government most of the percentages are between 0 and 1% even during the active period (Fig. 4c).
In order to study the seasonal changes in the concentrations of the volcanic emissions, the AEROS stations where separated into four groups, based mainly on the bearing and distance from the volcano (Fig. 5). Average monthly concentrations of SO2and SPM show mark-edly different characteristics. Consistent to research carried out for other volcanoes (Dingwell et al., 2016), SO2concentrations show sea-sonal changes. Proximal to the vent, SO2concentrations exhibit strong seasonality which is heavily dependent on the bearing from the vol-cano. The most notable range in SO2concentrations is noted for the Arimura station (Fig. 5e), southeast of the vent: during December the peak value of 205.2μg m−3is reduced to 6.5
μg m−3 in August. Al-though the maximum winter values decrease with distance, elevated values are noted for the rest of the stations in the group, even at a distance of more than 40 km from the vent (Fig. 5i,m).
Over the western side of the volcano, maximum values were noted during the late spring and late summer and autumn months (Fig. 5f). Over the northern side, seasonal peaks occur in early spring and the summer months (Fig. 5g,k), correlating well with the average wind directions for the respective seasons (Poulidis and Takemi, 2017). Compared to the concentrations noted over the southern side of the volcano, the station in Kurokami (east of the crater) shows a sig-nificantly decreased range (5–13μg m−3), while the station in
Fujinosaki (northwest) is almost indistinguishable from stations 40–50 km away from the volcano (Fig. 5h,l,p). The range of SO2 con-centration for stations in the city of Kagoshima is also reduced to almost background levels, with a small degree of seasonality (Fig. 5j,n). During the quiescent period, concentrations of SO2 are greatly reduced and signs of seasonal changes are practically negligible.
Unlike SO2, SPM concentrations show strong seasonality for all stations: during both the active and quiescent periods, average values across the prefecture are at their lowest during the winter and have two separate peaks, in April–May and July–September. Thefirst peak can be attributed to Asian dust events that occur mainly during spring (Kurosaki and Mikami, 2003; Shimizu et al., 2004). The summer peak is likely to be partially caused by the influence of increased humidity and the hygroscopic effect on the measurement equipment (McMurry, 2000). Despite the strong seasonality there is little change with respect to the location of the stations. The only exceptions are for some of the stations close to the volcano: to the west, SPM concentrations are slightly increased during late summer/early autumn (Fig. 5f), while southeast of the volcano concentrations remain high over the winter period (Fig. 5e). During the quiescent period concentrations are in general decreased uniformly.
4. Volcanic ash deposition
4.1. Accumulated ashfall characteristics
Accumulated ashfall around Sakurajima is steeply decreased with distance from the vent (Fig. 6). Of the total accumulated ashfall at the Fig. 4.Percentage of days over the recommended exposure limits in cities with AEROS stations based on 24-h averages for: (a) SO2- JP limit, (b) SO2- EU limit, (c) SPM - JP limit and (d) PM10 - WHO limit. Full city names are shown inTable 2.
end of the active period, 50%was deposited within thefirst 4.2 km from the vent, while 99%was deposited within thefirst 23.3 km (Fig. 6a). Accumulated ashfall values are higher to the east of the volcano, with a maximum value of 219.2 kg m−2(4.15 km E of the crater) almost twice than the maximum value of 123.2 kg m−2recorded on the west side (2.26 km NW of the crater). This follows dominant low-altitude (0–2 km height) wind patterns seen inFig. 6c: northwesterly winds are the most common during the study period, covering 23%of the time. The trend of higher ashfall values east of the volcano has been noticed by a pre-vious study on the topic (Biass et al., 2017) and agrees with a prepre-vious climatological study in the area (Poulidis and Takemi, 2017).
Biass et al. (2017)carried out an exposure analysis for a Taisho-like sub-Plinian eruption and found that, in terms of the ashfall hazard and impact, after Kagoshima (the largest city and the one nearest to the volcano), all high ranking municipalities were to the east of the volcano (Kanoya, Tarumizu, and Soo). Aside from Soo these results are also reflected in the accumulated averaged ashfall values per municipality (Table 2). Unlike the case of a single large eruption, Soo is relatively unaffected from long-term accumulation of ash due to the typically low plume height of the eruptions and the distance from the vent and (Fig. 2c). As noted by Poulidis and Takemi (2017), prevalent winds show strong seasonal variability and thus the dispersal direction heavily depends on the timing of the eruption. Overall, low-altitude windfields indicate that a component of dispersal towards the southeast is most
common, with a combined probability of 32.5% for
north-westerly–northerly winds. As the majority of the eruptions feature plume heights less than 3 km agl, and the maximum reported plume height was 5 km, low-altitude winds are assumed to assert afirst-order
control over the long-term accumulated deposition of volcanic ash near Sakurajima.
There is a large degree of inhomogeneity in the dispersal of ash even amongst stations situated relatively close to each other (Fig. 6b). Vol-canic ash deposition heavily depends on the size:‘coarse’ash (>1 mm in diameter) is deposited close to the vent, while lighter ash has increas-ingly longerflight times and can thus be subject to complex interactions with the local airflow (Carey and Sparks, 1986; Bonadonna et al., 1998; Beckett et al., 2015; Watt et al., 2015). Proximal to the vent, ash fallout is also heavily affected by volcanological effects such as changes in the eruption dynamics and sedimentation regime (Bonadonna and Costa, 2013), ash aggregation (i.e. the joining of airborne ash particles) within the volcanic plume that affects the total GSD of the ash (Cornell et al., 1983; Bonadonna and Houghton, 2005; Sulpizio et al., 2012) and can both enhance the sedimentation of light ash (Brown et al., 2012) and impede the sedimentation of heavier ash via rafting (Bagheri et al., 2016), as well as downwards propagating instabilities that arise from local differences in ash concentration (Manzella et al., 2015; Scollo et al., 2017). These effects act in tandem with the meteorologicalfields and topography, with the final ash fallout patterns decided by the complex interplay of all these factors. At greater distances from the vent the impact of volcanological effects is decreased due to lower con-centrations of ash (Gilbert and Lane, 1994; Scollo et al., 2017) and deposition patterns can be assumed to be more readily affected by preferential dispersal and the effects of the topography. Topographic heights located along the dispersal path have been implicated in en-hancing deposition of ash in their lee side (Watt et al., 2015; Eychenne et al., 2017). While this effect was also confirmed for Sakurajima Fig. 5.Seasonal changes in SO2and SPM concentrations for different AEROS station groups to the: east (first column), west (second column), north (third column), northwest (fourth column) of the volcano. The locations of the stations in each group are shown in Panels (a)–(d), while Panels (e)–(p) show the seasonal distribution for specific stations (shown with a black marker in the inset of each panel), at progressively larger distances from the volcano for each group. Note that clipped maximum values are 189.7 and 205.2 (January and December respectively) for (e) and 66.8 (October) for (f) and that average values between two similar stations are shown in (h),(j),(m), and (n). The legend for each line can be found at the bottom of thefigure.
(Poulidis et al., 2017), it was seen that orographic effects can both enhance and inhibit deposition.
Discontinuities in the ash deposition patterns at distal locations (>20km) can be seen despite the 6-year period of accumulation (Fig. 6d–g). Typical examples found in the data include an increase of ash load with distance (2 right-most points in Fig. 6d and e), a step change in the distribution (3 right-most points inFig. 6f) and an up to two orders of magnitude decrease within 5 km (2 right-most points in Fig. 6g).
In general, ashfall distribution away from Sakurajima is approxi-mated using an inverse power law relationship (Iguchi et al., 2013; Iguchi, 2016), specifically:
= −
wa wMD k (1)
wherewa(in kg m−2) is the volcanic ash load,Dis the distance in km (a reference distance of 1 km is assumed for the non-dimensionalization),
wM(in kg m−2) is the intercept andkis the slope of the logarithm. The intercept coefficient, wM, describes the theoretical ashfall load at a distance of 1 km from the vent, while the slope parameter shows how drastic the decrease is away from the volcano. Both parameters depend on the number of eruptions, eruptive conditions and atmospheric con-ditions (such as the windfields and rainfall) during the accumulation period, such as the wind speed and rainfall (Bonadonna et al., 2002).
Along the cross-section shown inFig. 6d–g two inverse power law curves were calculated, using all stations shown and a subset. The points excluded in the subset curve calculations were selected as points that were over 20 km away from the vents and showed the largest de-viation from the initial inverse power law curve. All calculations pro-vide appropriatefitting curves with the coefficient of determination (R2) values that range between 0.9–0.98 and 0.91–0.99 for the “all stations” and “subset” cases respectively. The most significant im-provement in the curvefitting occurred to the east of the vent (Fig. 6f). Fig. 6.(a) Accumulated ashfall (left hand-side axis) to the west and east of the vent (left- and right-pointing triangles respectively) and tephrameter station spacing (right hand-side axis) against distance from the vent at the end of the active period (June 2009 to May 2015). (b) Horizontal distribution of accumulated ashfall for the same period. Distance contours shown at 10, 20, and 40 km. Stations used in (d)–(g) are marked with coloured borders. (c) Wind rose showing low-altitude wind speed and direction during the active period. (d)–(g) Accumulated ashfall along different angles from the vent. Curved lines are plotted using the inverse power law approximation (Eq.(1)). Points excluded in“subset”curves are shown with large markers. Diamond markers show results for a limited period (A3–6). Note that the y-axis is shown using a logarithmic scale (with the topography in linear scale for reference) and that the x-axis limits vary between the plots.
Although there is little difference in excluding the point with the most significant deviation (a 0.01 difference between the“all station”and
“subset”calculations), there is significant improvement when analysing the deposition for the points between 0 and 20 km and over 20 km separately (shown with dotted lines). This is due to a step change in the intercept parameter, seen by the order of magnitude change between the two curves.
We will now examine the impact of such local-scale effects infitting of ashfall deposition for different accumulation periods, starting with the 6-year accumulation. Eq.(1)can be used to estimate theoretical limits for the decrease of ash weight between any two nearby te-phrameter stations: for example stationN(near), located at a distance DNfrom the vent and stationF(far) located at a distanceDFfrom the vent. Using Eq.(1)for the two station and dividing we get:
= −− w w w w D D ( ) ( ) a F a N M F M N F k N k , , , , F N (2)
For simplicity, we assume that the two stations have similarwMand kbecause of their proximity (i.e. assume that the stations are affected by the same eruptions). For stations aligned in the same direction from the vent, their relative distanced=DF−DN. Thus, we can replaceDF withDN+d, simplify the fraction and refer to the fraction on the left hand-side as the ashfall quotient:
⎜ ⎟ ≡ = ⎛ ⎝ + ⎞ ⎠ − Q w w d D 1 a a F
a N N
k ,
,
N
(3) The ashfall quotient is a measure of the expected decrease in ashfall values recorded in stationFcompared to stationN(i.e. ashfall decrease with increased distance from the vent) and depends on the distance of stationNfrom the vent, the relative distance between the two stations, and the slope parameter. For two stations adhering to the inverse power law modelQashould be∼1for stations located close to each other and decrease as the station distance increases.
We will now apply Eq.(3)for tephrameter station pairs using the
following criteria:(i)StationFis the closest station to StationNlocated at a greater distance from the vent, and(ii)StationFis located within
±15 of Station N (angle relative to the vent), so that assumptions aboutwMandkhold andd≃DF−DN. Note that the mapping of the stations pairs is shown in the Supplementary Material (Fig. S2).
Previous studies have found that monthly values of the slope parameterkare generally constrained between 2 and 3 (Iguchi, 2016). This was also seen to be true in the case of monthly–yearly accumula-tion periods with 62–83%ofkvalues being between 2 and 3 depending on the accumulation period (Fig. S1). Here we used these values to provide a rough theoretical estimate for the decrease. These estimates are shown as shaded areas inFig. 7, connected with a dotted line with their respective calculatedQa values and are plotted against the dis-tance from the vent (Fig. 7a) and the disdis-tance between the station pairs (Fig. 7b).
Points that are plotted below their respective shaded areas show that the ashfall in the far station (F) is overestimated in the theoretical calculations, while points above the shaded areas (downwards triangle markers) show underestimation. Values ofQaover 1 (diamond markers) show an increase of ashfall with distance. The range between the two theoretical limits is narrow for stations situated close to each other and increases with distance. The opposite applies for the distance from the vent (for example compare the dark and light gray shaded areas for similar values ofdinFig. 7b).
Observed values for the quotient generally compare favourably to the theoretically expected values (Fig. 7c and d). The difference be-tween the logarithm of the observed and the expected values (i.e. the absolute error of the logarithm) is used to show the order of magnitude difference between the two values. Close to the volcano, absolute error values have a median of 0.18, which is further to 0.08 for stations be-tween 5 and 20 km. This small increase infidelity with distance can be expected as modelling ashfall proximal to the vent is challenging due to the possible impact of localised effects (for example as seen inPoulidis et al. (2016)) and the large influence of volcanological effects discussed previously. At a distance from the volcano (more than 20 km), the es-timates provided by the inverse power law model are increasingly in-accurate, with an median absolute error of 0.34 with the maximum error up to 1.65, showing an almost 2 orders of magnitude difference (Fig. 7c). Absolute error values are generally decreased with increasing distance between the two stations (Fig. 7d).
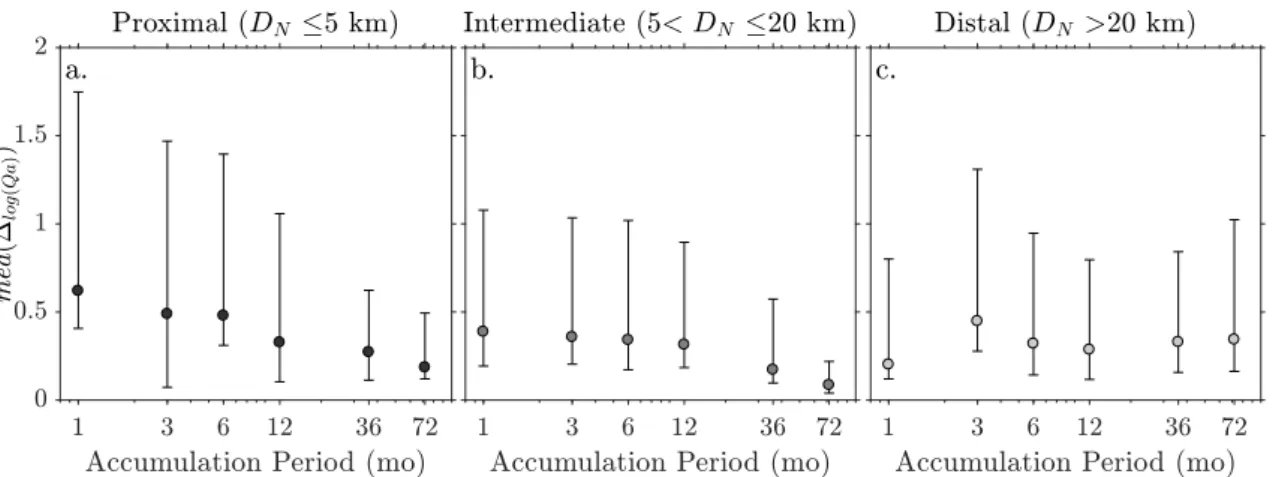
Thus far only 6-year (i.e. 72-months) accumulation data were used. Repeating the calculations using different accumulation periods (1, 3, 6, 12, and 36 months) shows that the median errors for each area, i.e. proximal (DN≤5km), intermediate (5<DN≤20km), and distal (DN>20km) vary considerably (Fig. 8). At the proximal (Fig. 8a) and intermediate (Fig. 8b) distances, both the median and the interquartile range are significantly reduced with an increase in accumulation period, with median values of 0.61 and 0.38 for 1-month accumulation reduced to 0.18 and 0.08 for 72-month accumulation respectively. The opposite is true for the distal stations that have a minimum error for 0.2 for 1-month accumulations that is increased to 0.34 for the 72-month accumulation (Fig. 8c). Note that although a decrease in the inter-quartile range can be expected with increased accumulation periods (due to the smaller sample size) this is not the case with the distal group, showing that station variability can be larger than inter-monthly or interannual variability.
4.2. Seasonality in ashfall patterns
As discussed previously local wind patterns have a strong seasonal behaviour (Poulidis and Takemi, 2017). This results in different sea-sonal distribution patterns for the ashfall in the winter (i.e. December, January, February; DJF), spring (March, April, May; MAM), summer (June, July, August; JJA), and autumn (September, October, November; SON) seasons (Fig. 9).Poulidis and Takemi (2017)showed that low-altitude (0–1.5 km) winds over Kagoshima typically follows three Table 2
Information on municipalities in the Kagoshima prefecture with tephrameters: population (NPin thousands), average tephrameter distance from the volcano (DTin km), number of
tephrameters (NT), accumulated ashfall (Atotin kg m−2), and average ashfall (A˙av in
g m−2mo−1) between June 2009 and May 2015. Population data are based on the 2015 Census. Total ashfall values in italics are estimates for accumulated (in kt) and monthly average (in kt mo−1) ash emissions from the volcano. The locations of the cities are shown inFig. 1(using abbreviations shown here).
Name NP DT NT Aacc A˙av
Aira (AI) 74.6 14.9 3 3.46 48.0
Hioki (HI) 49.2 29.4 1 2.28 31.7
Ibusuki (IB) 40.6 36.8 1 0.16 2.2
Ichikikushikino (IC) 29.3 38.2 1 0.69 9.7
Isa (IS) 26.8 39.7 1 0.02 0.2
Kagoshima (KG) 599.8 8.6 25 33.39 463.7
N. Kagoshima 585.2 13.1 11 8.23 114.3
S. Kagoshima 11.3 22.9 1 0.48 6.7
Sakurajima (SK) 3.3 4.1 13 91.45 1270.2
Kanoya (KA) 103.6 23.1 2 6.64 92.2
Kimotsuki (KM) 15.6 42.9 2 1.95 27.1
Kinko (KN) 7.9 35.5 1 0.85 11.8
Kirishima (KR) 125.9 23.1 7 1.95 17.9
Makurazaki (MA) 22.0 45.5 1 0.26 3.6
Minamikyushu (MK) 36.3 29.2 1 0.21 3.0
Minamiisumi (MI) 7.5 47.3 1 0.41 5.8
Minamisatsuma (MS) 35.4 40.0 2 0.25 3.5
Osaki (OS) 13.2 36.4 1 0.83 11.6
Satsuma (SA) 22.4 35.7 1 0.18 2.5
Satsumasendai (SS) 96.1 39.7 1 0.25 3.5
Shibushi (SH) 31.5 43.2 1 0.7 9.8
Soo (SO) 36.6 28.7 2 0.99 13.8
Tarumizu (TA) 15.5 10.00 6 34.71 482.0
Yusui (YU) 10.3 34.4 1 0.16 2.2
Total 1400.1 - 62 35,662 495
Fig. 7.(a),(b) Neighbouring station ashfall quotient (Qa) calculated for accumulated ashfall data over the active period (June 2009 to May 2015) against: (a) distance of thefirst stations from the vent (DN), (b) relative distance between the two stations (d). Shaded areas indicate theoretically expected values based on the inverse power law model for slope values (k)
between 2 and 3. (c),(d) Absolute error based on the logarithms of the middle of the theoretical range and observations of the ashfall quotient against: (c) distance of thefirst stations from the vent, (d) relative distance between the two stations. See main text for a detailed explanation of the legend found at the bottom of thefigure.
Fig. 8.Median values of absolute error (as inFig. 7c and d) against accumulation period (in months) for: (a) proximal, (b) intermediate, and (c) distal stations. Error bars are based in the
first and third quartiles.
patterns: mainly easterly–northeasterly from late autumn to early spring, a stronger westerly component in spring and early autumn, and a southerly–southwesterly component during the summer. Higher alti-tude wind direction (>1.5 km) was seen to be less affected by this seasonal change. This is confirmed by the results for low-altitude and higher-altitude horizontal winds during eruptions in the study period
(left-hand and right-hand side wind roses respectively shown inFig. 9). Low-altitude winds largely follow the previously described seasonality, while higher altitude winds remain largely unchanged except for the summer months (Fig. 9c).
Ash deposition patterns show a degree of seasonality, with partial similarities to the seasonal changes in the low-level windfields. During Fig. 9.Seasonal variation of median ashfall in: (a) Winter (DJF), (b) Spring (MAM), (c) Summer (JJA), and (d) Autumn (SON). The wind rose inserts shows the wind direction and surface wind strength for all eruption during each season averaged over 0–1.5 km (left-hand side), 1.5–4 km (right-hand side). The inner and outer circles indicate 20%and 40%probability. Topography contours are shown every 300 m between 100 and 1600 m.
the winter months deposition patterns are shifted away from the west, both on the volcano as well as stations farther away, with values over 10 g m−2mo−1reaching some of the easternmost stations (Fig. 9a). On the contrary, during the summer months ash deposition towards the south and southeast is limited and deposition mainly occurs uniformly along the other directions (Fig. 9c). The spring and autumn months show mixed results, featuring deposition both towards the west as well as the east–southeast (Fig. 9b,d). Despite changes in the areas of in-creased ashfall (>10 g m−2 mo−1) results reveal that there is a
∼1–10 g m−2mo−1background level of ashfall observed throughout the year and in the majority of the study area. Note that the contours here were calculated using MATLAB's“natural neighbour interpolation”
algorithm, based on Delaunay triangulation (Sibson, 1981). Using dif-ferent interpolation methods does not qualitatively change the ashfall patterns (nor quantitatively change the total estimated ashfall) and the analysis here is carried out primarily using the station values –the interpolation is mainly used to illustrate the results. As discussed in Section2, the volcano typically erupts with low-level plumes, with al-most 98%of the observed plume heights below 3 km agl. This explains the correlation between the long-term seasonal deposition studied here to the low-altitude winds. Note that qualitatively the deposition pat-terns were seen to be similar for the whole interquartile range of the ashfall values (Figs. S3–S5) and when limiting the study to months of small (or large) eruptions (seeFigs. S6–S7).
We will now check how these seasonal changes are reflected on the inverse power lawfitting (Eq.(1)). In order to use the approximation, the tephrameter stations were divided into 8 groups depending on their bearing from the volcano (south, southwest, west, etc., seeFig. 10a), in a similar way to Iguchi (2016)andPoulidis et al. (2017). This is to ensure that the stations in each group can be assumed to be affected by the same eruptions, thus the values ofwM andkare similar for each station in the group. Each group includes at least 6 stations to avoid having too small sample sizes. For the majority of the groupsR2is over 0.8, with 3 groups varying close to 1 (S, N, SW:Fig. 10b). Aside from the eastern (E) and northwestern (NW) group, there is little variability in the values. However, for E and NW values drop to 0.75 and 0.4 during the winter months.
The intercept coefficient (wM) describes the theoretical ashfall value at a distance of 1 km from the vent seen from a particular direction and here it ranges between 1 and∼100 kg m−2(Fig. 10c). When examining stations across all directions, the largest changes (two orders of mag-nitude) can be seen for the winter and summer months. During the winter (blue markers), the maximum value is seen for the group S (∼100 kg m−2
) and while values are high between the SE counter-clockwise to N groups, this is followed by a drastic decrease down to
∼2 kg m−2for the NW counterclockwise to SW groups. On the contrary, during the summer (yellow markers) the minimum values are noted for the SW, S, and SE stations. As seen previously, values during the spring and autumn season remain similar for all directions (between 10 and 100 kg m−2).
The slope parameter (k) shows a loose correlation withwM, with R2= 0.5 (Fig. 10d). Similar tow
M, across the 8 directional groups, the lowest overall values (i.e. a more drastic decrease of ashfall with dis-tance) are seen for the SE and clockwise to the W direction, while the highest values are noted for the E, NE and N directions. The most no-table seasonal changes occur for the S and SW groups, closely following the seasonality ofwM.
5. Discussion
Over extended time periods, volcanic emissions were seen to have complex dispersal and depositional behaviours. SO2and monthly ash deposits over 10 g m−2mo−1(possibly caused by easily consolidated medium–heavy volcanic ash) showed similarities, with a seasonality partially influenced by the low-altitude wind patterns. On the other hand, airborne volcanic ash was distributed evenly across the area
surrounding the volcano, seen as an average increase in the SPM con-centrations. Considering thatfine volcanic ash can stay airborne for extended periods and that unconsolidated light ash can be recirculated (Folch et al., 2014), this would indicate that once released from the volcano,fine ash emissions are caught within localised circulations and diffused across the surrounding area, increasing the associated health hazards (Lähde et al., 2013). This is also reflected in the ashfall de-position values, as a background value of∼1–10 g m−2mo−1was also seen independently of the season and dominant wind patterns.
Separation of SO2and volcanic ash is known to occur depending on the volcanological and meteorological conditions during an eruption (Prata et al., 2017). Even though previous studies focusing on volcanic emissions from Sakurajima have noted a high correlation between the concentrations of SO2and SPM after large eruptions (Shinkura et al., 1999; Hillman et al., 2012; Sakamoto and Kinoshita, 2015), evidence shown here suggest that this correlation is weaker for long-term dis-persal and holds true mainly for stations close to the volcano.
In the following sections we will discuss about factors that were seen to affect the deposition of volcanic ash and their effect on deposit approximation techniques such as the inverse power law method.
5.1. Impact of the topography
Results for the deposition of ash have shown that away from the vent considerable points of discontinuity can be found (Fig. 6d–g). As all of the points shown are situated near points of complex topography and at a distance from the vent is can be assumed that ash deposition at these points is affected by localised topographic effects. In the examples seen here, there are several orographic effects that could be used to offer explanations.
West of the volcano (Fig. 6d), the station with the largest deviation was located at approximately 20 km from the vent, showing a large decrease compared to the previous point, and followed by a point of increased ashfall with distance in the lee of the topographic maximum at 30 km. In a previous study,Poulidis et al. (2017)noted that for a single eruption a localised minimum was created 10–30 km, due to gravity wave activity. Although weaker in the case of long accumula-tion periods, results here suggest that this might be a persistent effect over the area.
To the south of the volcano a single point situated on the Satsuma peninsula (west side) stands at a localised minimum having received 0.16 kg m−2, compared the stations on the Osumi peninsula (east side) that received 0.85 and 0.41 kg m−2(Fig. 6e). The distance from the vent and the abruptness of the decrease would suggest a very localised influence, for example due to channelling through the tips of the two peninsulas.
To the east of the volcano a significant step change was noticed at approximately 20 km from the vent (Fig. 6f). This occurs after a rela-tively tall ridge situated just to the east of the volcano, approximately 3 by 10 km with an average height of 630 m.Watt et al. (2015)suggested that even if ash is not directly deposited due to downslope winds, the trajectory is the remaining low-altitude ash is affected. As ridges are associated with more vigorous downslope winds than mountains (Durran, 1990) it is possible that the step decrease is created due to the presence of the ridge at this distance from the vent.
Finally, to the north of the volcano there is a drastic decrease in ashfall values for stations situated in the vicinity of the relatively tall Kirishima mountain (peak height 1700 m), with a recorded ashfall of 0.68 kg m−2being reduced to 0.03 and 0.01 kg m−2for the two stations on the mountain (Fig. 6g). This could be partially caused by flow splitting around the mountain (Smith, 1980), for example as seen in Poulidis et al. (2017).
Due to the location of the stations and the distance from the vent, localised orographic phenomena can be used to offer explanations for the abrupt discontinuities in the ashfall depositional data. The impact of these localised circulations could possibly be overly emphasised in the
monthly data used here as they would include the resuspension of volcanic ash that is then dispersed in the boundary layer and is more susceptible to these effects (Folch et al., 2014). Although not examined here directly, orographic effects can also affect the rainfall patterns (Houze, 2012), which can in turn affect deposition (Kawaratani and Fujita, 1990; Witham et al., 2005).
Overall, it is most likely that the resulting deposition patterns were the results of mixed volcanological and meteorological processes. For example, downslope winds and lee mountain waves are often accom-panied by increased turbulence that could enhance aggregation (Watt et al., 2015). Other than that mountain waves and points of flow stagnation (i.e. points of flow splitting) could introduce localised maxima in the concentration of airborne ash, and enhancing both ag-gregation (Gilbert and Lane, 1994) and deposition via gravitational instabilities (Manzella et al., 2015; Scollo et al., 2017). Despite an in-crease of research in thefield in recent years (Watt et al., 2015; Poulidis et al., 2017; Eychenne et al., 2017), the interactions between volcanic ash and local orographic phenomena have currently not been com-prehensively studied and analysed, mainly due to the lack of concrete
observational data.
Despite the deviations discussed above and even with one or two stations with 1–2 order of magnitude difference there was only a small effect on the overall inverse power law calculations (i.e. a change be-tween 0.01 and 0.03 inR2 values). In the case of Sakurajima this is possibly due to the large number of sampling stations used (Fierstein and Nathenson, 1992), however, these effects would have to be kept in mind when choosing sampling locations in other cases with complex topography.
5.2. Impact of accumulation period and seasonality
Despite its largely qualitative nature, the ashfall quotient check carried out in Section4.1, it allows us to put some limits on the us-ability of the inverse power law model with respect to accumulated ash deposition. It was seen that, for Sakurajima, a distance of approxi-mately 20 km from the vent marked a change in the deposition regime; for stations closer than that (i.e. referred to as proximal and inter-mediate distances here) an increase in the accumulation period led to Fig. 10.Inverse power law characteristics depending on bearing from the vent. (a) Tephrameter directional groups. Different colours here are used only to help differentiate the groups. (b)–(d) Seasonal variation of power law model parameters per direction: (b) coefficient of determination (R2), (c) intercept coefficient (w
M), (d) slope parameter (k). Median values with
error bars based on thefirst and third quartiles. (For interpretation of the references to colour in thisfigure legend, the reader is referred to the Web version of this article.)
an increase infidelity, with the opposite being true for distal stations. The inability of a single set of inverse power law parameters to cover the whole range between proximal and distal data is well known, both for single eruptions (Pyle, 1989; Fierstein and Nathenson, 1992), as well as accumulated ashfall from multiple eruptions (Bonadonna et al., 2002). Results here show that over long accumulation periods processes that lead to inhomogeneous distribution of ash near the volcano tend to be averaged out, while processes at a distance tend to be emphasised. Concerning the seasonal variation, the inverse power law method provided good approximations for most seasons and directions around the vent. The majority of the groupsR2is over 0.8, with 3 groups very close to 1 (S, N, SW:Fig. 10b). Aside from the eastern (E) and north-western (NW) group, there is little variability in the values. However, for E and NW values drop to 0.75 and 0.4 during the winter months. In the case of group E this is possibly due to the inclusion of the te-phrameter station east of the ridge to the east of the volcano (Fig. 6f). As the dominant dispersal direction during the winter is to the SE, this station could be affected by ashfall to a larger degree than the other stations in the group lowering thefidelity of the model. For group NW this is possibly due to the very low amount of depositable ash reaching the furthest stations towards that direction during the winter months.
The specific values of the inverse power law parameters (intercept and slope) were found to partially reflect the seasonality of dominant low-altitude horizontal winds, with the most notable changes seen for the two extreme cases, i.e. winter (with little westwards deposition) and summer (with little southwards deposition). Both parameters are in-fluenced by the volcanological and meteorological conditions during the eruptions and were seen to be loosely correlated: estimates of large ashfall values close to the vent tended to show a steep decrease with distance, while low ashfall values followed a more gradual decrease.
6. Conclusions
The dense observations network around Mt. Sakurajima in Japan, coupled with the consistent volcanic activity since 1955 presents a rare opportunity for the detailed study on the long-term dispersal and de-position patterns of volcanic emissions. Monthly ashfall data were studied along with daily surface observations of SO2and particulate matter (PM) concentrations, focusing on a 6-year period between 2009 and 2015 in order to provide new insight on the seasonal dispersal and deposition patterns of volcanic emissions.
Volcanogenic SO2and airborne ash were seen to have markedly different long-term dispersal patterns. Concentrations of SO2show a steep decrease away from the volcano. On the other hand, airborne ash contributes to an increase in PM concentration almost uniformly in the area surrounding the volcano, possibly due to the recirculation offine volcanic ash in the atmospheric boundary layer.
Results for both SO2and SPM suggest that during the 6-year period studied here, locations to southeast and west of the volcano had po-tentially unsafe concentrations of pollutants. No health-related studies have been carried out for this period and the drastic changes in volcanic activity before 2009 and after 2015 allow for further research on the impact of emissions from Sakurajima on the surrounding communities. As with single eruptions, the inverse power law model was seen to be a good approximation for monthly and yearly distributions of ash-fall; however, the use of the method for long accumulation periods was seen to be appropriate for short to moderate distances from the volcano (up to 20 km). Long-term ashfall distribution was seen to be highly non-uniform, influenced in part by preferential dispersal due to seasonal winds and topographic effects. Stations in the vicinity of steep topo-graphic features differing up to two orders of magnitude for distances between stations as short as 4 km.
Even though the study focused specifically on Sakurajima, qualita-tive results can be applied for other volcanoes with similar activity of long-term volcanic emissions and small but frequent eruptions that lack extensive observations networks.
Acknowledgements
This work was supported by the Integrated Program for the Next Generation Volcano Research and Human Resource Management pro-ject, the Future Development Funding Program of Kyoto University Research Coordination Alliance, and by the Japan Society for the Promotion of Sciences (JSPS) KAKENHI grants 26282107 and 16H01846. Data used in thefigures are stored in the Kyoto University archive and are available upon request. Tephrameter data were pro-vided by the Osumi Office of River and National Highway, Ministry of Land, Infrastructure, Transport and Tourism (MLIT), Japan. Hourly data on atmospheric environment were retrieved from the National Institute for Environmental Studies (NIES) Numerical Environmental Database. The authors would like to thank two anonymous reviewers for their helpful comments.
Appendix A. Supplementary data
Supplementary data related to this article can be found athttp://dx. doi.org/10.1016/j.atmosenv.2018.02.021.
References
Ayris, P., Delmelle, P., 2012. The immediate environmental effects of tephra emission. Bull. Volcanol. 74, 1905–1936.https://dx.doi.org/10.1007/s00445-012-0654-5. Bagheri, G., Rossi, E., Biass, S., Bonadonna, C., 2016. Timing and nature of volcanic particle clusters based onfield and numerical investigations. J. Volcanol. Geother. Res. 327, 520–530.https://dx.doi.org/10.1016/j.jvolgeores.2016.09.009. Baxter, P.J., Kapila, M., Mfonfu, D., 1989. Lake Nyos disaster, Cameroon, 1986: the
medical effects of large scale emission of carbon dioxide? BMJ 298, 1437–1441.
https://dx.doi.org/10.1136/bmj.298.6685.1437.
Baxter, P.J., Bonadonna, C., Dupree, R., Hards, V., Kohn, S.C., Murphy, M.D., et al., 1999. Cristobalite in volcanic ash of the Soufrière Hills volcano, Montserrat, British West Indies. Science 283, 1142–1145.https://dx.doi.org/10.1126/science.283.5405. 1142.
Beckett, F.M., Witham, C.S., Hort, M.C., Stevenson, J.A., Bonadonna, C., Millington, S.C., 2015. The sensitivity of NAME forecasts of the transport of volcanic ash clouds to the physical characteristics assigned to the particles. J. Geophys. Res. 120, 11636–11652.
https://dx.doi.org/10.1002/2015JD023609.
Bernstein, J.A., Alexis, N., Barnes, C., Bernstein, I.L., Nel, A., Peden, D., et al., 2004. Health effects of air pollution. J. Allergy Clin. Immunol. 114, 1116–1123.https://dx. doi.org/10.1016/j.jaci.2004.08.030.
Biass, S., Todde, A., Cioni, R., Pistolesi, M., Geshi, N., Bonadonna, C., 2017. Potential impacts of tephra fallout from a large-scale explosive eruption at Sakurajima volcano. Japan. Bull. Volcanol. 79 (73). https://dx.doi.org/10.1007/s00445-017-1153-5. Bonadonna, C., Ernst, G., Sparks, R.S.J., 1998. Thickness variations and volume estimates
of tephra fall deposits: the importance of particle Reynolds number. J. Volcanol. Geother. Res. 81, 173–187.https://dx.doi.org/10.1016/S0377-0273(98)00007-9. Bonadonna, C., Mayberry, G.C., Calder, E.S., Sparks, R.S.J., Choux, C., Jackson, P., et al.,
2002. Tephra fallout in the eruption of Soufrière Hills volcano. Montserrat. Geol. Soc. London Mem. 21, 483–516.https://dx.doi.org/10.1144/GSL.MEM.2002.021.01.22. Bonadonna, C., Houghton, B., 2005. Total grain-size distribution and volume of tephra-fall deposits. Bull. Volcanol. 67, 441–456. https://dx.doi.org/10.1007/s00445-004-0386-2.
Bonadonna, C., Folch, A., Loughlin, S., Puempel, H., 2012. Future developments in modelling and monitoring of volcanic ash clouds: outcomes from thefirst IAVCEI-WMO workshop on Ash Dispersal Forecast and Civil Aviation. Bull. Volcanol. 74, 1–10.https://dx.doi.org/10.1007/s00445-011-0508-6.
Bonadonna, C., Costa, A., 2013. Modeling of ash sedimentation from volcanic plumes. In: Fagents, S.A., Gregg, T.K.P., Lopes, R.M.C. (Eds.), Modeling Volcanic Processes: the Physics and Mathematics of Volcanism. Cambridge Academic Press, Cambridge, pp. 173–202.https://doi.org/10.1017/CBO9781139021562.009.
Brown, R.J., Bonadonna, C., Durant, A.J., 2012. A review of volcanic ash aggregation. Phys. Chem. Earth 45–46, 65–78.https://dx.doi.org/10.1016/j.pce.2011.11.001. Carey, S., Sparks, R.S.J., 1986. Quantitative models of the fallout and dispersal of tephra
from volcanic eruption columns. Bull. Volcanol. 48, 109–125.https://dx.doi.org/10. 1007/BF01046546.
Cioni, R., Marianelli, P., Santacroce, R., Sbrana, A., 2000. Plinian and subplinian erup-tions. In: Sigurdsson, H. (Ed.), Encyclopedia of Volcanoes. Academic, San Diego, California, pp. 477–494.https://dx.doi.org/10.1016/B978-0-12-385938-9.00029-8. Cornell, W., Carey, S., Sigurdsson, H., 1983. Computer simulation of transport and
de-position of the campanian Y-5 ash. J. Volcanol. Geother. Res. 17, 89–109.https://dx. doi.org/10.1016/0377-0273(83)90063-X.
Delmelle, P., Stix, J., Baxter, P.J., Garcia-Alvarez, J., Barquero, J., 2002. Atmospheric dispersion, environmental effects and potential health hazard associated with the low-altitude gas plume of Masaya volcano, Nicaragua. Bull. Volcanol. 64, 423–434.
https://dx.doi.org/10.1007/s00445-002-0221-6.
Dingwell, A., Rutgersson, A., Claremar, B., Arellano, S., Yalire, M.M., Galle, B., 2016. Seasonal and diurnal patterns in the dispersion of SO2from Mt. Nyiragongo. Atmos.