早稲田大学審査学位論文 博士(スポーツ科学)
Associations of circulating vitamin D concentration with physical fitness and cardiometabolic risk factors
血中ビタミン
D
濃度と心肺体力および心血管代謝リスクと の関係2016
年1
月早稲田大学大学院 スポーツ科学研究科
孫 暁敏
SUN XIAOMIN
研究指導教員:樋口 満 教授
1
Table of Contents
Chapter 1 Background and Purpose……….………..…….5
1-1. Background...5
1-2. Purpose...6
1-3. Figures...7
Chapter 2 Association between 25(OH)D concentration and lipid profiles: a cross sectional study ……...8
2-1. Introduction...8
2-2. Methods...9
2-3. Results...13
2-4. Discussion………...14
2-5. Figures and Tables...19
Chapter 3 Effects of the interaction between 25(OH)D concentration, cardiorespiratory fitness on glucose profiles: a cross sectional study...23
3-1. Introduction...23
3-2. Methods...23
2
3-3. Results...27
3-4. Discussion...28
3-5. Figures and Tables...33
Chapter 4 Effects of 1-year vitamin D supplementation on insulin resistance in Japanese adults: a double-blind, randomized, placebo-controlled trial ……...37
4-1. Introduction...37
4-2. Methods...38
4-3. Results...43
4-4. Discussion...45
4-5. Figures and Tables...50
Chapter 5 Conclusions and Suggestions for Future Research...56
Acknowledgement...58
References...60
Appendix...72
3
List of abbreviations
T2DM Type 2 diabetes mellitus BMI Body mass index
VFA Visceral fat area SFA Subcutaneous fat area WC Waist circumference CRF Cardiorespiratory fitness
MVPA Moderate- and vigorous-intensity physical activity V.
O2max Maximal oxygen uptake SBP Systolic blood pressure DBP Diastolic blood pressures TG Triglyceride
LDL-C Low-density lipoprotein cholesterol HDL-C High-density lipoprotein cholesterol OxLDL Oxidized low-density lipoprotein Total-C Total cholesterol
ApoB Apolipoprotein B
ApoA-I Apolipoprotein A-I
HOMA-IR Homeostasis model assessment of insulin resistance HbA1c Glycated hemoglobin
4
25(OH)D 25-hydroxyvitamin D 1,25(OH)2D 1,25-dihydroxyvitamin D iPTH Intact parathyroid hormone CRP C-reactive protein
IL-6 Interleukin-6 IL-17 Interleukin-17
5
Chapter 1 Background and Purpose 1-1. Background
Cardiometabolic diseases such as type 2 diabetes mellitus (T2DM), coronary artery disease, heart failure, and metabolic syndrome account for the majority of premature morbidity and mortality cases in the developed world, including in Japan (1, 2). The prevalence of and rate of mortality due to cardiometabolic diseases have been rapidly increasing in Japan owing to population aging, physical inactivity, and obesity. Hence, effective preventive strategies against cardiometabolic diseases are needed.
Vitamin D is known to play an important role in bone and mineral homeostasis. High vitamin D status, as assessed by circulating 25-hydroxyvitamin D (25(OH)D) concentration, has been recently associated with improved cardiovascular outcomes, improved immune function, and low risk of developing T2DM, metabolic syndrome, or cardiovascular diseases (3-5), suggesting that vitamin D may help to reduce the risk of cardiometabolic diseases. However, the causal relationship between vitamin D and cardiometabolic risk reported by randomized controlled intervention studies was unclear in general healthy adults, owing to the marked differences in duration, participant population, and dosing regimen (6-11).
Increasing evidence indicates that a high level of physical activity or regular exercise is associated with a reduced risk of various cardiometabolic diseases (12-15). In fact, to promote a healthier lifestyle, many countries, including Japan, have recognized the importance of physical exercise in the
6
prevention of cardiometabolic diseases and have established recommendations and guidelines for physical activity (16, 17). On the other hand, recent studies indicate that higher levels of physical activity and regular exercise are related to higher concentration of serum 25(OH)D in winter, in which vitamin D synthesis from sunlight is absent, or even after adjustment for sun exposure (18-21).
Therefore, clarification is needed regarding whether a direct relationship exists between serum 25(OH)D concentration and cardiometabolic disease.
Moreover, obesity, an independent predictor of cardiometabolic disease, was associated with lower serum 25(OH)D concentration, and the relationship appeared to vary by race due to differences in body fat distribution (22-24). Compared with European populations, Asians are more prone to obesity-related morbidity and mortality at lower body mass index (BMI), but at high percent body fat or visceral fat area (VFA) levels (25). Thus, clarification is needed regarding whether body fat is related to circulating 25(OH)D concentration and whether the relationship between serum 25(OH)D concentration and risk of cardiometabolic disease is influenced by body fat accumulation in Asians.
1-2. Purpose
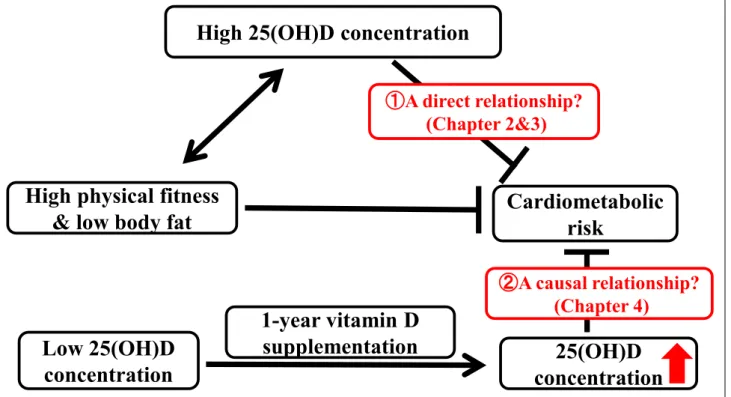
Therefore, the purpose of the present study was to investigate the relationship between serum 25(OH)D and cardiometabolic risk with consideration of physical fitness and body fat levels in general healthy Japanese adults (Figure 1-1).
7
1-3. Figures
Figure 1-1. Summary of the research plan in doctoral course
High physical fitness
& low body fat Cardiometabolic
risk High 25(OH)D concentration
25(OH)D concentration
①A direct relationship?
(Chapter 2&3)
②A causal relationship?
(Chapter 4)
Low 25(OH)D
concentration
1-year vitamin D
supplementation
8
Chapter 2 Associations between 25(OH)D concentration and lipid profiles: a cross sectional study
2-1. Introduction
A disorder of lipid metabolism, such as increased levels of triglyceride (TG), low-density lipoprotein cholesterol (LDL-C), apolipoprotein (Apo)B and decreased levels of high-density lipoprotein cholesterol (HDL-C) or apolipoprotein (Apo)A-1, have been identified as contributing factors to the pathogenesis of cardiometabolic diseases (26-29). Recent studies on humans have suggested that high circulating 25(OH)D concentration has beneficial effects on blood lipids (30, 31).
However, data on the relationship between 25(OH)D and the lipid profile in healthy adults are limited and results are inconsistent (32-36). Some studies have reported that 25(OH)D concentration is positively correlated with the HDL-C or ApoA-1 levels (34-36), whereas others have found that 25(OH)D concentration is not correlated with HDL-C and ApoA-1 (33), but rather be inversely correlated with the LDL-C, ApoB or TG levels (32, 33).
Although previous studies have considered the confounding effect of total or abdominal fat by simple anthropometric measures such as body mass index (BMI) or waist circumference (WC), recent studies have revealed that reductions in visceral fat area (VFA) may occur in the absence of changes in WC or BMI (37, 38). Magnetic resonance imaging (MRI) permits reliable, non-invasive characterization of VFA, which appears to be more strongly related to dyslipidemia and other cardiovascular risk factors than WC or BMI (39-41). Thus, the insensitivity of anthropometric indexes
9
to reflect actual amounts of VFA may affect the relationship of circulating 25(OH) concentration and lipids. Furthermore, previous studies have not evaluated the potential confounding effect of cardiorespiratory fitness (CRF) in the context of the relationship between 25(OH)D and the lipid profile. A number of studies have shown that higher CRF is related to higher circulating 25(OH)D concentration, and reduces the risk of developing cardiometabolic disease in part by improving the blood lipid profiles (15, 42, 43).
The purpose of this study was to evaluate the association between serum 25(OH)D and lipid profiles in Japanese men. We also sought to investigate whether these associations are independent of visceral fat accumulation and cardiorespiratory fitness.
2-2. Methods
2-2-1. Subjects
A total of 136 healthy Japanese men aged 20–79 years participated in the present study. All procedures were conducted in T Campus, W University (35° N latitude). The health status of subjects was confirmed using medical questionnaires and blood pressure by accredited nurses or doctors. None of the subjects had been diagnosed with cardiac disease, diabetes, or chronic renal failure. We excluded the subjects on lipid lowering medications or drugs that could affect the study variables (i.e., vitamin D supplements, vitamin D analogues, calcium, or any drugs that could affect bone and mineral metabolism, including bisphosphonates). The purpose, procedures, and risks of the study were explained to each subject prior to inclusion, and all subjects were enrolled with written informed
10
consent. All procedures were reviewed and approved by the Ethical Committee of Waseda University (2012-G002).
2-2-2. Anthropometric measurement
Height (without shoes) was measured to the nearest millimeter using a stadiometer (YL-65, Yagami Inc., Nagoya, Japan). Body mass was measured using an electronic scale with the subjects wearing light clothing and no shoes, and was determined to the nearest 0.1 kg (Inner Scan BC-600, Tanita Co., Tokyo, Japan). BMI was calculated by dividing the body mass in kilograms by the square of height in meters (kg/m2). WC was measured at the umbilical region with an inelastic measuring tape at the end of normal expiration to the nearest 0.1 cm. VFA area was measured by MRI (Signa 1.5T, General Electric Co., Milwaukee, Wisconsin, USA). MRI was performed by two coauthors, who are qualified to operate the equipment. The imaging conditions included a T-1 weighted spin-echo and axial-plane sequence with a slice thickness of 10 mm, a repetition time (TR) of 140 ms, and an echo time of 12.3 ms. Cross-sectional images were scanned at the umbilical region (44). The magnetic resonance images were transferred to a personal computer in the Digital Imaging and Communications in Medicine (DICOM) file format, and the cross-sectional area of the VFA at the umbilical region was determined using image-analysis software (Slice-o-matic 4.3 for Windows, Tomovision, Montreal, Canada). To minimize inter-observer variation, all scans and analyses were performed by the same investigators, and the coefficient of variation for the cross-sectional area at the umbilical level was 0.4%.
2-2-3.Brachial arterial blood pressure
11
Resting systolic and diastolic blood pressure (SBP and DBP) were measured using a semi-automated device (VaSera VS-1500) over the brachial and dorsalis pedis arteries using the oscillometric method (45). Recordings were made in duplicate with participants in supine position.
2-2-4. Measurement of cardiorespiratory fitness
CRF was assessed by a maximal graded exercise test using a cycle ergometer (Ergomedic 828E;
Monark, Varberg, Sweden) and was quantified as V.
O2 peak. The graded cycle exercise began at a workload of 45–90 W, and was increased by 15 W/min until the subject could no longer maintain the required pedaling frequency of 60 rpm. Heart rate and ratings of perceived exertion were monitored each minute during exercise. During the incremental portion of the exercise test, expired gas was collected from the subjects. O2 and CO2 concentrations were measured and averaged over 30-s intervals using an automated gas analyzer (Aeromonitor AE-300; Minato Medical Science, Tokyo, Japan). The highest value of V.
O2 recorded during the exercise test was considered the V.
O2 peak (mL/kg/min).
2-2-5. Blood sample analysis
Blood samples were collected between 08:30 and 10:00 AM by accredited nurses or doctors after a 12-h overnight fast, and centrifuged at 3,000 ×g for 15 min at 4°C. Blood glucose, glycated hemoglobin (HbA1c), total-C, HDL-C, LDL-C, TG, ApoA-1, ApoB, and free fatty acid (FFA) levels were directly measured from fresh blood samples by BML Inc. (Tokyo, Japan). The remaining serum and plasma samples were transferred to separate tubes and immediately stored at −80°C. No repeatedly
12
freeze-thawed samples were used for oxLDL and 25(OH)D quantification. Serum 25(OH)D and plasma oxLDL concentrations were measured in duplicate using commercially available enzyme-linked immunosorbent assay (ELISA) kits (25(OH)D: Immunodiagnostic AG, Bensheim, Germany; oxLDL: Mercodia AB, Uppsala, Sweden) according to the manufacturer’s instructions. The intra- and inter-assay coefficients of variation were 8.9% and 10.6% for 25(OH)D, and 2.8% and 6.4%
for oxLDL.
2-2-6. Lifestyle variables
Information about vitamin D intake, calcium intake, and alcohol consumption were obtained by a brief self-administered diet history questionnaire (BDHQ) (46, 47). Smoking status and medication use were also obtained using questionnaires. Smoking status was classified as never or former/current smoker, and medication use was classified as users or non-users.
2-2-7. Statistical analysis
All statistical analyses were performed with SPSS software version 21.0 (SPSS, Inc., Chicago, IL, USA). Kolmogorov-Smirnov test was performed to assess the normality of data distribution; 25(OH)D values were square root transformed; HDL-C values were reciprocal of the square root transformed;
SBP, TG, FFA, ApoA-1, cardiorespiratory fitness, calcium and vitamin D intake values were log transformed to obtain their normal distributions prior to analysis. Student’s t-test (for normally distributed variables), Mann-Whitney U-test (for non-normally distributed variables), or chi-square test (for categorical variables) was used to evaluate the differences in these parameters according to the
13
25(OH)D concentrations (25(OH)D<50 nmol/L vs 25(OH)D≧50 nmol/L). Partial Pearson’s correlation coefficients were computed between serum 25(OH)D and subject characteristics and were controlled for age. Multiple linear regression analyses were performed to assess the association of serum 25(OH)D (independent variable) with the lipid profiles (dependent variables), adjusted for age, seasons, smoking status, alcohol consumption, medication use, vitamin D and calcium intake, VFA, and further adjusted for CRF. All measurements and calculated values are presented as mean (SD) (for normally distributed variables) or median (interquartile range; IQR) (for non-normally distributed variables). The statistical significance level was set at P < 0.05.
2-3. Results
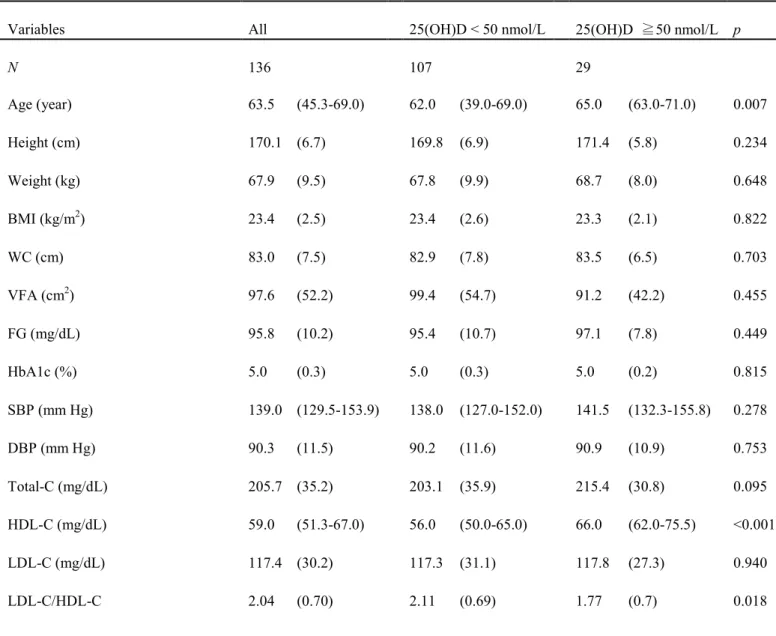
Subject characteristics and blood parameters according to the 25(OH)D concentration are presented in Table 2-1. The median 25 (OH)D concentration was 35.6 (26.0-48.2) nmol/L. In addition, 78.7%
subjects were 25 (OH)D-deficient (<50 nmol/L), and 14.0% participants had insufficient 25(OH)D concentration (50-75 nmol/L). The 25(OH)D-deficient participants had significantly (P < 0.05) lower HDL-C, ApoA-1, and calcium and vitamin D intake levels, and significantly (P < 0.05) higher ratios of LDL-C/HDL-C and ApoB/ApoA-1, and TG levels than participants with insufficient and sufficient levels.
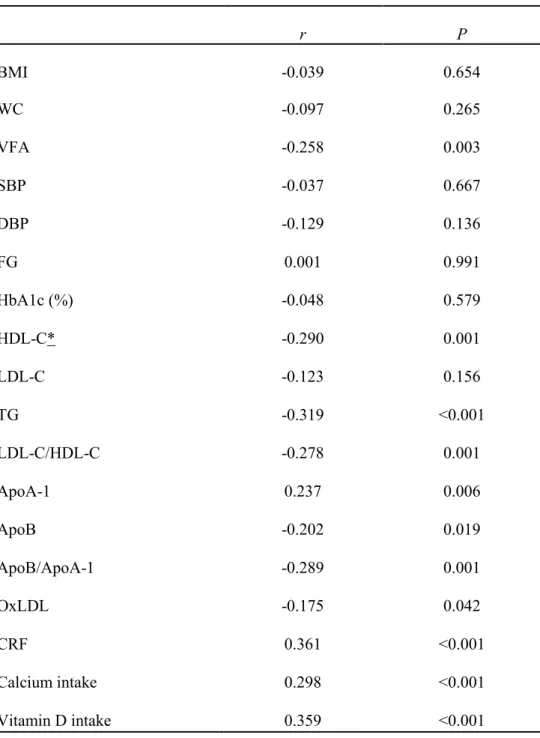
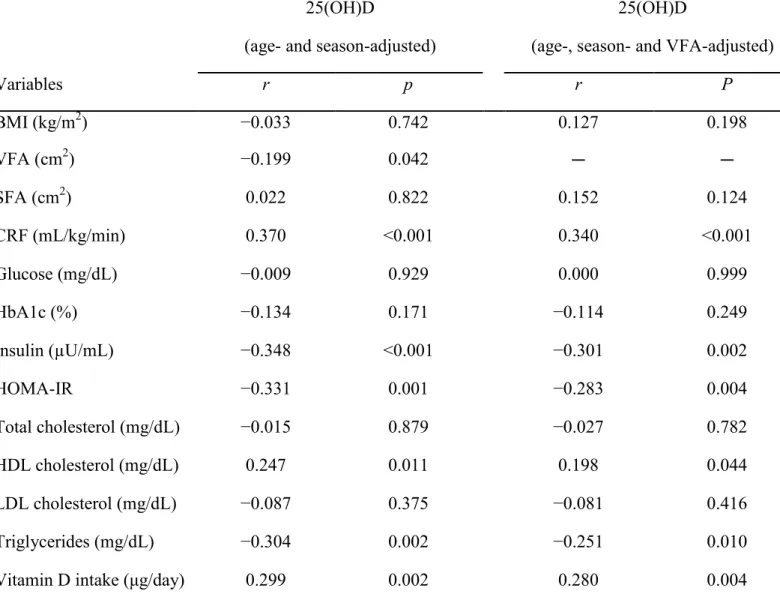
The age-adjusted relationship between serum 25(OH)D concentration and subjects’ characteristics are shown in Table 2-2. Serum 25(OH)D concentration is negatively correlated with TG, LDL-C/HDL-C, VFA, ApoB/ApoA-1, ApoB, and oxLDL concentrations (P < 0.05). In addition,
14
serum 25(OH)D concentration was positively associated with HDL-C, ApoA-1, CRF, calcium intake, and vitamin D intake ( P < 0.05).
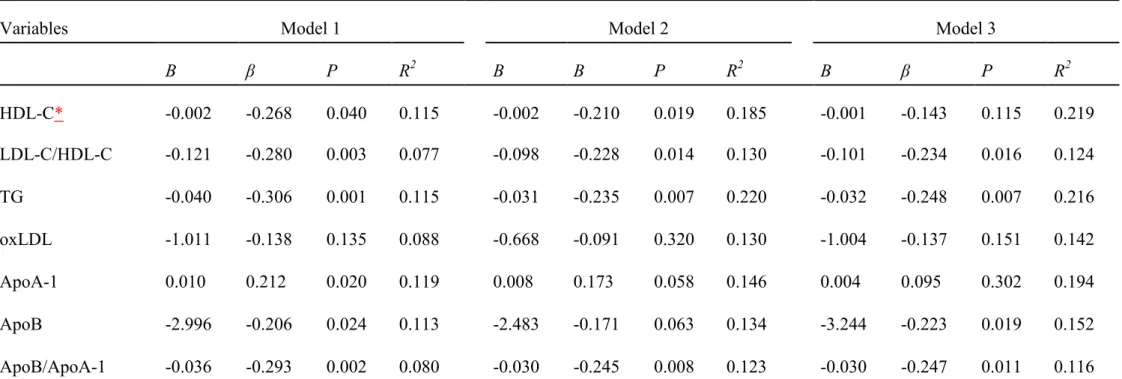
To investigate whether serum 25(OH)D concentration was independently related to blood lipid profiles, multivariate linear regression analyses using blood lipids as the dependent variable were performed (Table 2-3). As shown in Model 1, 25(OH)D concentration was positively correlated with HDL-C and ApoA-1 levels (P < 0.05), and negatively correlated with LDL-C/HDL-C (P < 0.01), ApoB/ApoA-1 (P < 0.01), TG (P < 0.01) and ApoB (P < 0.05) after adjustment for age, seasons, smoking status, alcohol consumption, medication use, and vitamin D and calcium intake. However, the association of serum 25(OH)D with ApoA-1 (P = 0.06) and ApoB (P = 0.06) were of borderline statistical significance when further adjusted by VFA, with limited effect on the other lipid profiles.
With further adjustment for CRF, similar results for the relationship of serum 25(OH)D with TG, LDL-C/HDL-C, and ApoB/ApoA-1 were observed. However, the association of 25(OH)D concentration with HDL-C and ApoA-1 levels were no longer significant, whereas the relationship between serum 25(OH)D concentration and ApoB levels achieved statistical significance (P < 0.05).
2-4. Discussion
This cross-sectional study was performed to examine whether serum 25(OH)D concentration is associated with circulating lipid profiles in Japanese men aged 20–79 years. Our results showed that serum 25(OH)D concentration is inversely correlated with LDL-C/HDL-C, TG, ApoB, and ApoB/ApoA-1 levels even after controlling for potential confounding factors such as age, seasons,
15
smoking status, alcohol consumption, medication use, vitamin D intake, calcium intake, VFA, and CRF.
There have been limited studies examining the influence of vitamin D on levels of blood lipids in healthy adults, and the findings are inconsistent. Auwerx et al. (35) and Carbone et al. (36) reported that serum 25(OH)D concentration was positively correlated with HDL-C and ApoA-1, and were not associated with TG, LDL-C, ApoB, and ApoB/ApoA-1 without considering any obesity factors in middle-aged men and women. Moreover, John et al. (34) reported that serum 25(OH)D concentration was positively correlated with ApoA-1, but not HDL-C after adjustment for BMI in 170 adults aged 35–65 years. Conversely, Jorde et al. (32) and Karhapaa et al. (33) found that serum 25(OH)D concentration was negatively correlated with TG, LDL-C, LDL-C/HDL-C, and ApoB, but were not correlated with HDL-C and ApoA-1 in adults when BMI and WC were taken into account (33).
Additionally, all previous studies were conducted on American and European adults. The present study seems to be firstly investigated the relationship between 25(OH)D and blood lipids in Japanese men (20 to 79 years). The partial Pearson’s correlation analyses clearly showed that serum 25(OH)D concentration was robustly associated with VFA (P < 0.01) but not other measures of adiposity such as BMI and WC. Thus, a better obesity indicator VFA was controlled in the present study. Our observation supports the finding of the previous studies that high serum 25(OH)D concentration was associated with a desirable lipid profiles, with low TG, LDL-C/HDL-C, ApoB/ApoA-1, and high HDL-C even after adjustment for VFA in Japanese men. Meanwhile, we observed significant
16
associations of 25(OH)D with ApoA-1 and ApoB after controlling for BMI or WC (data not shown), which were consistent with previous studies (33, 34). However, when the potential confounding factors and obesity indicators BMI or WC were replaced by VFA, the positive relationship between serum 25(OH)D and ApoA-1 or ApoB achieved borderline significance in our study.
Previous studies have found that high levels of cardiorespiratory fitness are linked to a beneficial blood lipid profiles and high circulating 25(OH)D concentration (15, 42). However, none of these previous studies considered the importance of the potentially confounding effect of cardiorespiratory fitness in the context of the relationship between serum 25(OH)D and lipid profiles. In the present study, with further adjustment for cardiorespiratory fitness, the inverse relationships between 25(OH)D and TG, ApoB, ApoB/ApoA-1, and LDL-C/HDL-C remained statistically significant, while the positive associations of 25(OH)D with HDL-C and ApoA-1 were no longer seen. In Japanese men, we found the associations of 25(OH)D with ApoA-1 and HDL-C were significantly influenced by cardiorespiratory fitness levels rather than the body fat distribution, and serum 25(OH)D concentration was observed to be inversely associated with levels of ApoB, TG, and LDL-C/HDL-C and ApoB/ApoA-1 regardless of fat distribution and cardiorespiratory fitness levels. Moreover, although vitamin D metabolism is closely correlated with cholesterol, multiple regression analysis indicated that serum 25(OH)D concentration was negatively correlated with the LDL-C/HDL-C ratio, ApoB levels, the key structural component of LDL-C, and TG levels, with similar regression coefficients. Therefore, these data suggest that higher serum 25(OH)D concentration have beneficial effects on both TG and
17
cholesterol metabolism, independently of the visceral fat area and cardiorespiratory fitness in Japanese men.
It is known that oxLDL is involved in the critical, early stages of atherogenesis, as well as in foam cell and thrombus formation (48-50). Recent studies have revealed that, in addition to LDL-C and HDL-C, oxLDL levels are a strong, independent predictor for CVD in healthy participants (51).
Recently, Gradinaru et al. (52) found 25(OH)D to be inversely correlated with oxLDL in elderly subjects with impaired fasting glucose and diabetes. However, the relationship between serum 25(OH)D and oxLDL has not yet been determined in healthy adults. In the present study, we observed a negative relationship between serum 25(OH)D and oxLDL after adjusting for age, but this relationship was lost following further adjustment. Due to the limited data, no definite conclusion can be made and further study is warranted.
The present study has several limitations. First, this study used a cross-sectional design, and therefore cannot provide causal evidence on the association between serum 25(OH)D and lipid profiles.
Second, this study included only Japanese men. It is still unknown whether the same associations exist in people of other ethnicities, because vitamin D metabolism and circulating 25(OH)D concentration vary substantially by race (53). An understanding of this issue in other populations is needed. Third, because we only investigated men in the present study, our results should be interpreted with caution and confirmed in further cohorts of women. Despite these limitations, the present study has some strengths including the reliable characterization of abdominal fat and the precise and objective measure
18
of fitness used. Most importantly, this is the first study to focus on the relationship between 25(OH)D and lipid profiles in an Asian population.
In conclusion, the present study revealed that serum 25(OH)D is inversely associated with TG, ApoB, as well as the ratio of LDL-C/HDL-C and ApoB/ApoA-1, independent of abdominal fat and cardiorespiratory fitness levels in Japanese men.
19
2-5. Figures and Tables
Table 2-1. Subject characteristics
Variables All 25(OH)D < 50 nmol/L 25(OH)D ≧50 nmol/L p
N 136 107 29
Age (year) 63.5 (45.3-69.0) 62.0 (39.0-69.0) 65.0 (63.0-71.0) 0.007
Height (cm) 170.1 (6.7) 169.8 (6.9) 171.4 (5.8) 0.234
Weight (kg) 67.9 (9.5) 67.8 (9.9) 68.7 (8.0) 0.648
BMI (kg/m2) 23.4 (2.5) 23.4 (2.6) 23.3 (2.1) 0.822
WC (cm) 83.0 (7.5) 82.9 (7.8) 83.5 (6.5) 0.703
VFA (cm2) 97.6 (52.2) 99.4 (54.7) 91.2 (42.2) 0.455
FG (mg/dL) 95.8 (10.2) 95.4 (10.7) 97.1 (7.8) 0.449
HbA1c (%) 5.0 (0.3) 5.0 (0.3) 5.0 (0.2) 0.815
SBP (mm Hg) 139.0 (129.5-153.9) 138.0 (127.0-152.0) 141.5 (132.3-155.8) 0.278
DBP (mm Hg) 90.3 (11.5) 90.2 (11.6) 90.9 (10.9) 0.753
Total-C (mg/dL) 205.7 (35.2) 203.1 (35.9) 215.4 (30.8) 0.095
HDL-C (mg/dL) 59.0 (51.3-67.0) 56.0 (50.0-65.0) 66.0 (62.0-75.5) <0.001
LDL-C (mg/dL) 117.4 (30.2) 117.3 (31.1) 117.8 (27.3) 0.940
LDL-C/HDL-C 2.04 (0.70) 2.11 (0.69) 1.77 (0.7) 0.018
20
TG (mg/dL) 85.0 (62.0-117.0) 92.0 (65.0-118.0) 66.0 (53.5-92.5) 0.021
FFA (mEq/L) 0.51 (0.40-0.71) 0.51 (0.40-0.73) 0.51 (0.40-0.70) 0.841
oxLDL (U/mL) 43.2 (11.9) 43.4 (12.5) 42.1 (9.3) 0.596
ApoA-1 (mg/dL) 147.0 (132.0-162.0) 142.0 (131.0-158.0) 159.0 (150.0-178.0) <0.001
ApoB (mg/dL) 95.1 (23.5) 95.8 (24.4) 92.5 (20.2) 0.517
ApoB/ApoA-1 0.66 (0.20) 0.68 (0.20) 0.57 (0.18) 0.010
25(OH)D (nmol/L) 35.6 (26.0-48.2) 30.4 (23.0-37.8) 68.6 (58.0-78.4) <0.001 CRF (mL/kg/min) 33.3 (28.3-39.7) 33.0 (27.7-40.2) 33.8 (32.6-39.6) 0.295 Calcium intake (mg/day) 647.2 (428.1-820.5) 619.6 (410.1-759.2) 681.9 (507.7-954.1) 0.048 Vitamin D intake (μg/day) 13.5 (8.9-23.0) 12.3 (8.8-18.9) 18.8 (12.5-28.3) 0.003 Alcohol consumption (g/day) 17.1 (1.2-40.8) 15.7 (1.0-38.6) 23.0 (7.4-49.4) 0.348
Current or former smoking status (%) 43.4% 43.9 41.4 0.806
Medication use (%) 23.5% 20.6 34.5 0.129
Data are expressed as mean (SD) or median (IQR). 25(OH)D, 25-hydroxyvitamin D; BMI, body mass index; WC, waist circumference; VFA, visceral fat area; FG, fasting glucose; HbA1c, glycated hemoglobin; SBP, systolic blood pressure; DBP, diastolic blood pressure; Total-C, total cholesterol; HDL-C, high-density lipoprotein cholesterol;
LDL-C. low-density lipoprotein cholesterol; TG, triglyceride; FFA, free fatty acid; Apo, apolipoprotein; oxLDL, oxidized low-density lipoprotein; CRF, cardiorespiratory fitness. Boldface indicates statistical significance at p < 0.05.
21
r P
BMI -0.039 0.654
WC -0.097 0.265
VFA -0.258 0.003
SBP -0.037 0.667
DBP -0.129 0.136
FG 0.001 0.991
HbA1c (%) -0.048 0.579
HDL-C* -0.290 0.001
LDL-C -0.123 0.156
TG -0.319 <0.001
LDL-C/HDL-C -0.278 0.001
ApoA-1 0.237 0.006
ApoB -0.202 0.019
ApoB/ApoA-1 -0.289 0.001
OxLDL -0.175 0.042
CRF 0.361 <0.001
Calcium intake 0.298 <0.001
Vitamin D intake 0.359 <0.001
Data are partial Pearson's correlation coefficients. 25(OH)D, 25-hydroxyvitamin D; BMI:
body mass index; WC, waist circumference; VFA, visceral fat area; FG, fasting glucose;
HbA1c, glycated hemoglobin; SBP, systolic blood pressure; DBP, diastolic blood pressure; HDL-C, high-density lipoprotein cholesterol; LDL-C, low-density lipoprotein cholesterol; TG, triglyceride; Apo, apolipoprotein; oxLDL, oxidized low-density lipoprotein; CRF, cardiorespiratory fitness. 25(OH)D was square root transformed;
HDL-C* was reciprocal of square root transformed; SBP, TG, ApoA-1, CRF, calcium and vitamin D intake were log transformed for analysis. Boldface indicates statistical significance at p < 0.05.
Table 2-2. Age adjusted relations of serum 25(OH)D and subjects characteristics (n = 136)
22
Table 2-3. Multiple regression analysis of the association of serum 25(OH)D concentrations with lipid profiles (n = 136)
Variables Model 1 Model 2 Model 3
B β P R2 B Β P R2 B β P R2
HDL-C* -0.002 -0.268 0.040 0.115 -0.002 -0.210 0.019 0.185 -0.001 -0.143 0.115 0.219
LDL-C/HDL-C -0.121 -0.280 0.003 0.077 -0.098 -0.228 0.014 0.130 -0.101 -0.234 0.016 0.124 TG -0.040 -0.306 0.001 0.115 -0.031 -0.235 0.007 0.220 -0.032 -0.248 0.007 0.216 oxLDL -1.011 -0.138 0.135 0.088 -0.668 -0.091 0.320 0.130 -1.004 -0.137 0.151 0.142 ApoA-1 0.010 0.212 0.020 0.119 0.008 0.173 0.058 0.146 0.004 0.095 0.302 0.194 ApoB -2.996 -0.206 0.024 0.113 -2.483 -0.171 0.063 0.134 -3.244 -0.223 0.019 0.152 ApoB/ApoA-1 -0.036 -0.293 0.002 0.080 -0.030 -0.245 0.008 0.123 -0.030 -0.247 0.011 0.116 25(OH)D, 25-hydroxyvitamin D; HDL-C, high-density lipoprotein cholesterol; LDL-C: low-density lipoprotein cholesterol; TG: triglyceride; oxLDL, oxidized low-density lipoprotein; Apo, apolipoprotein; CRF, cardiorespiratory fitness. B, unstandardized regression coefficients; β, standardized regression coefficients. 25(OH)D was square root transformed; HDL-C* was reciprocal of square root transformed; TG, ApoA-1, and were log transformed for analysis. Model 1: adjusted for age, seasons, smoking status, alcohol consumption, medication use, vitamin D and calcium intake; Model 2: As model 1 plus VFA; Model 3: As model 2 plus CRF. Boldface indicates statistical significance at p < 0.05.
23
Chapter 3 Effects of the interaction between 25(OH)D concentration, cardiorespiratory fitness on glucose profiles: a cross sectional study
3-1. Introduction
Obesity and overweight are the most important risk factors for insulin resistance and type 2 diabetes mellitus (T2DM) (54, 55). In contrast to Caucasians with T2DM who always have high body mass indices (BMI), the Japanese population tends to develop T2DM with low BMI (25, 56). Therefore, besides obesity, other lifestyle factors, such as regular physical activity or ensuring sufficient micronutrient intake, may play an important role in the prevention of insulin resistance or T2DM in Japan.
Recent evidence showed that high circulating 25-hydroxyvitamin D (25(OH)D) was associated with low prevalence of increased homeostasis model assessment of insulin resistance (HOMA-IR) and T2DM not only in individuals with impaired glucose tolerance or T2DM (57, 58), but also in healthy individuals (59-62); these associations were independent of BMI. In addition, several studies documented an association between high cardiorespiratory fitness (CRF) and low prevalence of insulin resistance and T2DM in adults, even after adjustment for BMI (14, 63-68). However, the possible interaction between circulating 25(OH)D and CRF with regard to insulin resistance has not been studied.
Therefore, the purpose of this study was to investigate the independent and combined associations of serum 25(OH)D and CRF levels with insulin resistance in middle-aged and elderly Japanese men.
3-2. Methods
24
3-2-1. Subjects
Data from chapter 2 involving 107 men aged 40–79 years were reanalyzed in the present study.
None of the participants had been diagnosed with cardiac disease, diabetes, or chronic renal failure. We excluded participants who were on lipid and glucose lowering medications, or medications that could affect the study variables (i.e., vitamin D supplements, vitamin D analogues, calcium, or any drugs that could affect bone and mineral metabolism, including bisphosphonates). We also recorded medication use including antihypertensive drugs that potentially affect glucose metabolism; 21 participants (19.6%) were treated with antihypertensive drugs. Current/former smoking status was assessed by a questionnaire. Daily alcohol and vitamin D intake were assessed using a brief-type self-administered diet history questionnaire (46). All participants provided written informed consent before enrollment in the study, which was approved by the Ethical Committee of Waseda University (2012-G002). The study was conducted in accordance with the Declaration of Helsinki.
3-2-2. Anthropometric Characteristics
Body weight was measured by an electronic scale (Inner Scan BC-600, Tanita Inc., Tokyo, Japan), whereas height was measured by a stadiometer (YL-65, Yagami Inc., Nagoya, Japan). BMI was calculated from measurements of body weight and height. Visceral fat area (VFA) and subcutaneous fat area (SFA) were measured by magnetic resonance imaging (Signa 1.5T, General Electric Inc., Milwaukee, WI, USA). Additional details have been described in chapter 2.
3-2-3. Cardiorespiratory Fitness
25
CRF was assessed by a maximal graded exercise test using a cycle ergometer (Ergomedic 828E;
Monark, Varberg, Sweden) and quantified as maximal oxygen uptake (V.
O2max). The graded cycle exercise began at a workload of 45–90 W, which was increased by 15 W/min until the subject could no longer maintain the required pedaling frequency of 60 rpm. Heart rate and ratings of perceived exertion were monitored each minute during exercise. During the incremental portion of the exercise test, expired gas was collected from the participants. O2 and CO2 concentrations were measured and averaged over 30 s intervals by an automated gas analyzer (Aeromonitor AE-300; Minato Medical Science, Tokyo, Japan). The maximum V.
O2 recorded during the exercise test was considered the V.
O2max (mL/kg/min), and the achievement of V.
O2max was accepted if at least 3 of the following 4 criteria were met: the V.
O2 curve showed a plateau despite increasing the work rate, maximal heart rate was 95% of the age-predicted maximal heart rate (220-age (in years)), respiratory exchange ratio >1.1, and perceived exertion ≥18. Participants were subsequently divided into the low and high CRF groups according to the median V.
O2max value of each age group (mL/kg/min): 37.1 for 40–49 years, 38.8 for 50–
59 years, 31.3 for 60–69 years, and 27.7 for 70–79 years.
3-2-4. Blood Sample Collection and Analysis
Blood samples were collected between 08:30 and 11:00 AM by accredited nurses or doctors after a 12-h overnight fast, and centrifuged at 3000× g for 15 min at 4 °C. Glucose, insulin, glycated hemoglobin (HbA1c), total cholesterol, high-density lipoprotein (HDL) cholesterol, low-density lipoprotein (LDL) cholesterol, and triglyceride concentrations were directly determined from fresh
26
blood samples by BML Inc. (Tokyo, Japan). The HOMA-IR value was used as an index of insulin resistance; it was calculated from the fasting concentrations of plasma glucose and serum insulin as follows: HOMA-IR = [fasting glucose (mg/dL)] × [fasting insulin (μU/mL)]/405. Serum 25(OH)D concentration was measured in duplicate using commercially available enzyme-linked immunosorbent assay kits (25(OH)D: Immundiagnostik AG, Bensheim, Germany) according to the manufacturer’s instructions. The intra- and interassay coefficients of variation were 8.9% and 10.6% for 25(OH)D. We divided participants into low and high 25(OH)D groups according to the median values of 25(OH)D concentration (36.3 nmol/L).
3-2-5. Statistical Analysis
All statistical analyses were performed using SPSS version 22.0 (SPSS, Inc., Chicago, IL, USA).
Kolmogorov-Smirnov test was performed to assess the normality of data distribution, and several variables were log-transformed or square root transformed to obtain a normal distribution prior to analysis. Student’s t-test (for normal distributed variables), Mann-Whitney U-test (for non-normally distributed variables), or chi-square test (for categorical variables) was used to evaluate the significance of differences between the low and high CRF groups. Partial correlation analysis adjusted for age, season or VFA was performed to determine the associations between 25(OH)D concentration and subject characteristics. The influence of CRF levels and 25(OH)D concentration on blood parameters was evaluated by two-way analysis of covariance (ANCOVA) adjusted for the appropriate covariates. A post hoc test with Bonferroni correction was used to identify significant differences if a
27
significant main effect or interaction was identified. Fisher’s exact test was used for comparing proportions of participants with high risk of insulin resistance (HOMA-IR ≥ 1.6) between combination groups. For this analysis, we created 4 subgroups for combinations of 25(OH)D and CRF on the basis of dichotomizing groups with low and high levels of each variable (HH, High CRF and 25(OH)D subgroup; HL, High CRF and Low 25(OH)D subgroup; LH, Low CRF and High 25(OH)D subgroup;
LL, Low CRF and 25(OH)D subgroup). All measurements and calculated values are presented as mean (SD) (for normally distributed variables) or median (interquartile ratio; IQR) (for non-normally distributed variables) unless otherwise indicated. The level of significance was set at p < 0.05.
3-3. Results
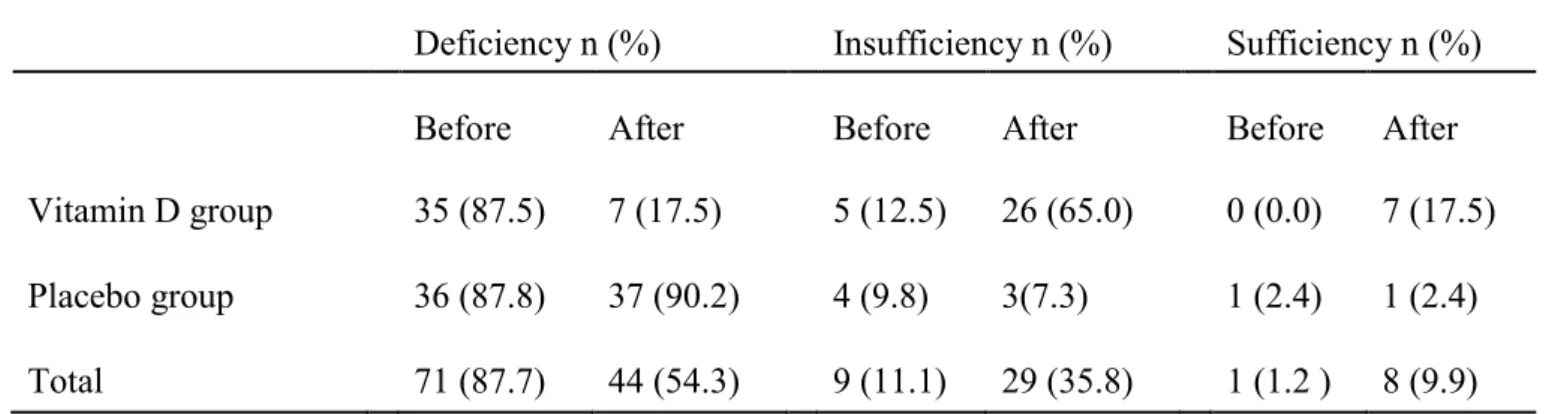
The characteristics of study participants are shown in Table 2-1. The median 25(OH)D concentration was 36.3 (IQR: 26.4–50.2) nmol/L, 74.8% of participants were 25(OH)D deficient (< 50 nmol/L), and 13.1% of participants had insufficient 25(OH)D (50 – 75 nmol/L). The median age of participants was 67.0 years for the low CRF group and 65.0 years for the high CRF group. The low CRF group had lower CRF, HDL cholesterol, 25(OH)D concentration, and vitamin D intake values and higher VFA, HbA1c, insulin and HOMA-IR values (p < 0.05) than the high CRF group. In addition, the low CRF group had slightly higher triglyceride levels than the high CRF group but was not statistically significant (p = 0.052).
Table 2-2 shows the correlation between 25(OH)D concentration and other variables. Results showed that 25(OH)D concentration was positively correlated with HDL cholesterol, vitamin D intake
28
and CRF, and negatively correlated with insulin, HOMA-IR, triglycerides, and VFA (p < 0.05), after adjusting for age and season. Moreover, the relationships persisted after further adjustment for VFA.
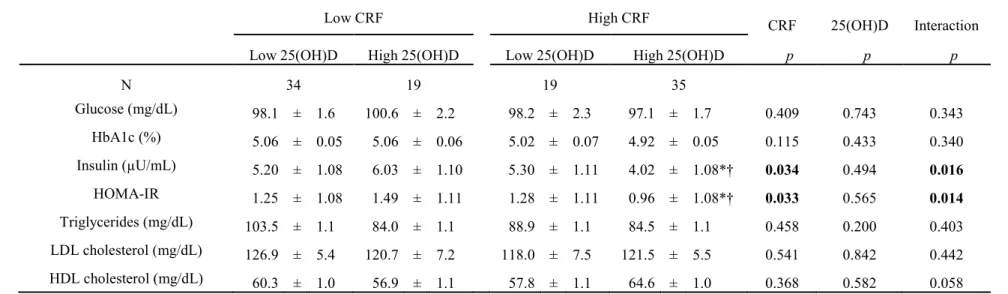
To evaluate interaction effects between 25(OH)D and CRF on the blood parameters, two-way ANCOVA was performed after adjustment for potential confounders, including VFA (Table 2-3 and Figure 2-1). Significant interactions between 25(OH)D and CRF on insulin and HOMA-IR values were found (p < 0.05). No significant interactions were observed on glucose, HbA1c, triglycerides, and LDL cholesterol levels. We found significant main effects on insulin and HOMA-IR values for CRF (p
= 0.034 and 0.033, respectively), but not for 25(OH)D. In the high CRF group (more than the median values of each age group), participants with high 25(OH)D concentration (≥ 36.3 nmol/L) had lower insulin (p = 0.038) and HOMA-IR (p = 0.043) values than participants with low 25(OH)D concentration (< 36.3 nmol/L). In the high 25(OH)D group, participants with high CRF had lower insulin (p = 0.002) and HOMA-IR (p = 0.001) values than participants with low CRF. In addition, participants simultaneously in the high CRF and 25(OH)D subgroup (HH) had the lowest prevalence of insulin resistance (HOMA-IR ≥ 1.6) among all combination subgroups (8.6% for HH, 31.6% for HL, 47.4% for LH, 32.4% for LL, p < 0.05).
3-4. Discussion
To our knowledge, this study was the first to examine the combined associations of 25(OH)D and CRF with glucose metabolism in middle-aged and elderly Japanese men. Our results indicate that higher 25(OH)D concentration and CRF levels were associated with low risk of insulin resistance,
29
independent of VFA levels. Furthermore, among participants with high CRF levels, higher serum 25(OH)D concentration largely strengthened the effect of CRF on reducing insulin resistance.
Several studies have shown that high levels of CRF are associated with low insulin resistance or incidence of T2DM in healthy adults including Japanese (44, 66-69). Usui et al. (44) revealed that fasting insulin concentrations and HOMA-IR were significantly lower among the high CRF group than the low CRF group in healthy Japanese women and men. Moreover, data from the Tokyo Gas Company in Japan showed that high CRF groups have significantly lower risk of developing T2DM compared with other fitness groups, even after controlling for BMI in healthy Japanese men (68, 69).
Although previous studies have considered obesity levels using BMI, recent studies have revealed that reductions in the VFA may occur in the absence of changes in BMI (37). The present study clearly showed that participants with higher CRF had significantly lower HOMA-IR and insulin values, independent of VFA levels, which is a more robust measure of obesity than the simple anthropometric measurement BMI. It indicates that high levels of CRF are critical for attenuating insulin resistance in middle-aged and elderly Japanese men, regardless of visceral obesity.
It has been reported that higher 25(OH)D concentration is strongly associated with low insulin and insulin resistance in adults (61, 62). However, those previous studies have been mostly limited to non-Asian populations. Furthermore, in place of directly measured CRF, self-reported physical activity determined by simple questionnaires was used as a controlled factor to determine the relationship between 25(OH)D concentration and HOMA-IR in those previous studies (70). Although self-reported
30
physical activity is related to CRF, prior evidence has demonstrated that CRF is much more strongly related with various health outcomes than self-reported physical activity, which often inevitably produces greater misclassification than the directly measured CRF (71-73). In addition, the combined associations of serum 25(OH)D and CRF with glucose metabolism has not been examined. Consistent with the previous study (44, 61, 68), the present study revealed that higher 25(OH)D concentration and CRF levels were related to lower levels of fasting insulin and insulin resistance, independent of obesity status (VFA levels), in middle-aged and elderly Japanese men. Additionally, the present study is the first to demonstrate an interaction effect of serum 25(OH)D and CRF on glucose metabolism in Japanese middle-aged and elderly men. We found the relationship between 25(OH)D concentration and HOMA-IR was significantly affected by CRF levels. This was not surprising since 25(OH)D was more closely related with CRF than VFA levels (r = 0.370 vs. r = 0.199). The positive association between 25(OH)D and CRF could be explained partly by the variations in daily physical activity, sunlight exposure time, and cardiac morphology (18, 74). Moreover, we found that the values of HOMA-IR and the number of participants with high risk of insulin resistance were lower in the combined higher 25(OH)D and CRF group than in the other groups (p < 0.05). These observations suggest that the combination of higher CRF and 25(OH)D levels are probably more effective to reduce the risk of insulin resistance than either alone.
Although the clear mechanism is not well understood, several explanations can be given for this finding. Human and animal studies have reported that both higher levels of 25(OH)D and regular
31
physical activity increased insulin secretion and enhanced insulin sensitivity in pancreatic and peripheral tissues (14, 60, 75); thus, a combined effect of higher levels of 25(OH)D and CRF on glycemic control may be stronger than either alone. Additionally, it has been demonstrated that altered cholesterol metabolism (for example, low HDL cholesterol or high total cholesterol levels) may contribute to prevalence of insulin resistance (76), and regular physical activity and higher 25(OH)D concentration may improve lipid metabolism, resulting in low risk of insulin resistance (14, 70, 77).
Consistent with previous studies, the present study found that 25(OH)D and CRF are positively related to HDL cholesterol (p < 0.05 and p < 0.01, respectively), independent of age, season and VFA levels.
Additionally, the two-way ANCOVA showed that participants simultaneously in the higher CRF and 25(OH)D group had higher HDL cholesterol levels than other groups, though not statistically significant (p = 0.06). Thus, it seems reasonable to infer that the combined effect of higher levels of 25(OH)D and CRF on glucose control is more effective than either alone, at least in our study population.
The present study has several limitations. First, because this was a cross-sectional study, it is difficult to make causal inferences between exposures and outcomes. A prospective study would provide more accurate associations of 25(OH)D concentration and CRF levels with insulin resistance.
Second, the present study evaluated insulin resistance on the basis of HOMA-IR, which uses fasting values for estimation and mainly reflects insulin resistance in the liver (78). Although HOMA-IR has been shown to have a good relationship with the hyperinsulinemic euglycemic clamp technique (79), a
32
more accurate method for assessing insulin resistance, such as the oral glucose tolerance test or the glycemic insulin clamp test, should be used in future studies. Third, despite individuals had a higher daily vitamin D intake (12.6 μg/day) than Dietary Reference Intake (5.5 μg/day) for Japanese in the present study, the prevalence of 25(OH)D deficiency (74.8%) is still high; therefore, whether the findings can be extrapolated to reflect serum 25(OH)D sufficiency needs to be investigated. Finally, because we only examined men in the present study, our results should be interpreted with caution and confirmed in further cohorts of women. Despite these limitations, our study was the first to evaluate the combined associations of serum 25(OH)D concentration and CRF levels with insulin resistance, controlling for potential confounding factors including a precise obesity indicator in middle-aged and elderly Japanese men.
In conclusion, the present study revealed that higher 25(OH)D concentration and CRF levels were negatively correlated with levels of fasting insulin and insulin resistance in middle-aged and elderly Japanese men. These associations were observed independent of abdominal fat, while associations between serum 25(OH)D and insulin resistance were largely influenced by CRF levels. Among middle-aged and elderly Japanese men with high levels of CRF, higher 25(OH)D concentration largely enhanced the effect of CRF on reducing insulin resistance. These results suggest that the combination of increasing both CRF and circulating 25(OH)D may be more effective for improving glycemic control than either alone.
1 2
33
3-5. Figures and tables
Table 3-1. Subject characteristics
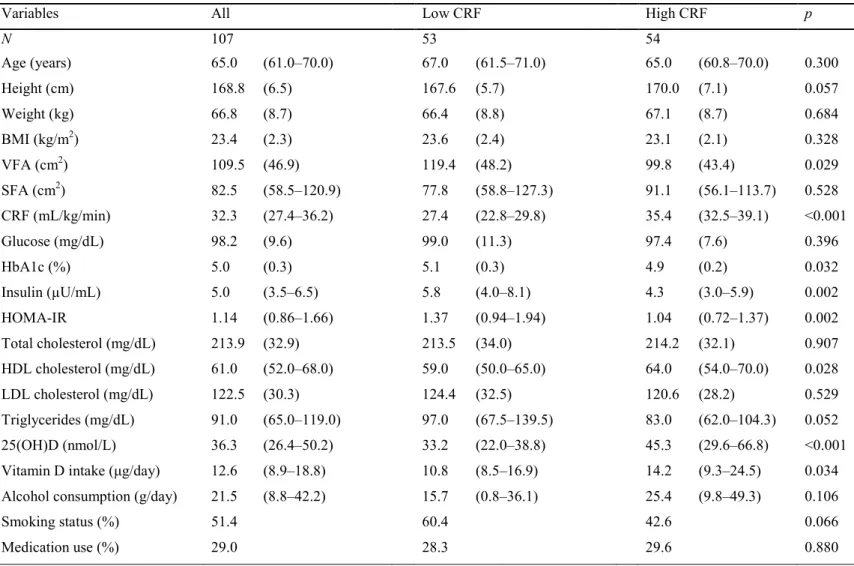
Variables All Low CRF High CRF p
N 107 53 54
Age (years) 65.0 (61.0–70.0) 67.0 (61.5–71.0) 65.0 (60.8–70.0) 0.300
Height (cm) 168.8 (6.5) 167.6 (5.7) 170.0 (7.1) 0.057
Weight (kg) 66.8 (8.7) 66.4 (8.8) 67.1 (8.7) 0.684
BMI (kg/m2) 23.4 (2.3) 23.6 (2.4) 23.1 (2.1) 0.328
VFA (cm2) 109.5 (46.9) 119.4 (48.2) 99.8 (43.4) 0.029
SFA (cm2) 82.5 (58.5–120.9) 77.8 (58.8–127.3) 91.1 (56.1–113.7) 0.528
CRF (mL/kg/min) 32.3 (27.4–36.2) 27.4 (22.8–29.8) 35.4 (32.5–39.1) <0.001
Glucose (mg/dL) 98.2 (9.6) 99.0 (11.3) 97.4 (7.6) 0.396
HbA1c (%) 5.0 (0.3) 5.1 (0.3) 4.9 (0.2) 0.032
Insulin (µU/mL) 5.0 (3.5–6.5) 5.8 (4.0–8.1) 4.3 (3.0–5.9) 0.002
HOMA-IR 1.14 (0.86–1.66) 1.37 (0.94–1.94) 1.04 (0.72–1.37) 0.002
Total cholesterol (mg/dL) 213.9 (32.9) 213.5 (34.0) 214.2 (32.1) 0.907
HDL cholesterol (mg/dL) 61.0 (52.0–68.0) 59.0 (50.0–65.0) 64.0 (54.0–70.0) 0.028
LDL cholesterol (mg/dL) 122.5 (30.3) 124.4 (32.5) 120.6 (28.2) 0.529
Triglycerides (mg/dL) 91.0 (65.0–119.0) 97.0 (67.5–139.5) 83.0 (62.0–104.3) 0.052
25(OH)D (nmol/L) 36.3 (26.4–50.2) 33.2 (22.0–38.8) 45.3 (29.6–66.8) <0.001
Vitamin D intake (μg/day) 12.6 (8.9–18.8) 10.8 (8.5–16.9) 14.2 (9.3–24.5) 0.034
Alcohol consumption (g/day) 21.5 (8.8–42.2) 15.7 (0.8–36.1) 25.4 (9.8–49.3) 0.106
Smoking status (%) 51.4 60.4 42.6 0.066
Medication use (%) 29.0 28.3 29.6 0.880
Data are mean (SD) or median (IQR) values. BMI: body mass index; VFA: visceral fat area; SFA: subcutaneous fat area; CRF: cardiorespiratory fitness quantified as V.
O2max; HbA1c: glycated hemoglobin; HOMA-IR: homeostasis model assessment of insulin resistance; HDL:
high-density lipoprotein; LDL: low-density lipoprotein; 25(OH)D: 25-hydroxyvitamin D. Boldface indicates significance (p < 0.05).
34
Table 3-2. Correlations of serum 25(OH)D with subject characteristics in middle-aged and elderly adults
25(OH)D 25(OH)D
(age- and season-adjusted) (age-, season- and VFA-adjusted)
Variables r p r P
BMI (kg/m2) −0.033 0.742 0.127 0.198
VFA (cm2) −0.199 0.042 - -
SFA (cm2) 0.022 0.822 0.152 0.124
CRF (mL/kg/min) 0.370 <0.001 0.340 <0.001
Glucose (mg/dL) −0.009 0.929 0.000 0.999
HbA1c (%) −0.134 0.171 −0.114 0.249
Insulin (µU/mL) −0.348 <0.001 −0.301 0.002
HOMA-IR −0.331 0.001 −0.283 0.004
Total cholesterol (mg/dL) −0.015 0.879 −0.027 0.782
HDL cholesterol (mg/dL) 0.247 0.011 0.198 0.044
LDL cholesterol (mg/dL) −0.087 0.375 −0.081 0.416
Triglycerides (mg/dL) −0.304 0.002 −0.251 0.010
Vitamin D intake (μg/day) 0.299 0.002 0.280 0.004
BMI: body mass index; VFA: visceral fat area; SFA: subcutaneous fat area; CRF: cardiorespiratory fitness quantified as V.
O2max; HbA1c: glycated hemoglobin; HOMA-IR: homeostasis model assessment of insulin resistance; HDL:
high-density lipoprotein; LDL: low-density lipoprotein; 25(OH)D: 25-hydroxyvitamin D. Partial Pearson's correlation coefficients were calculated. SFA, insulin, HOMA-IR, HDL cholesterol, triglycerides, and vitamin D intake were log-transformed; 25(OH)D was square root transformed for analysis. Boldface indicates significance (p < 0.05).
35
Table 3-3. Joint association of 25(OH)D and CRF with parameters related to insulin resistance
Low CRF High CRF CRF 25(OH)D Interaction
Low 25(OH)D High 25(OH)D Low 25(OH)D High 25(OH)D p p p
N 34 19 19 35
Glucose (mg/dL) 98.1 ± 1.6 100.6 ± 2.2 98.2 ± 2.3 97.1 ± 1.7 0.409 0.743 0.343
HbA1c (%) 5.06 ± 0.05 5.06 ± 0.06 5.02 ± 0.07 4.92 ± 0.05 0.115 0.433 0.340
Insulin (µU/mL) 5.20 ± 1.08 6.03 ± 1.10 5.30 ± 1.11 4.02 ± 1.08*† 0.034 0.494 0.016
HOMA-IR 1.25 ± 1.08 1.49 ± 1.11 1.28 ± 1.11 0.96 ± 1.08*† 0.033 0.565 0.014
Triglycerides (mg/dL) 103.5 ± 1.1 84.0 ± 1.1 88.9 ± 1.1 84.5 ± 1.1 0.458 0.200 0.403
LDL cholesterol (mg/dL) 126.9 ± 5.4 120.7 ± 7.2 118.0 ± 7.5 121.5 ± 5.5 0.541 0.842 0.442
HDL cholesterol (mg/dL) 60.3 ± 1.0 56.9 ± 1.1 57.8 ± 1.1 64.6 ± 1.0 0.368 0.582 0.058
CRF: cardiorespiratory fitness quantified as V.
O2max; HbA1c: glycated hemoglobin; HOMA-IR: homeostasis model assessment of insulin resistance;
HDL: high-density lipoprotein; LDL: low-density lipoprotein; 25(OH)D: 25-hydroxyvitamin D. Data are presented as the adjusted mean ± SE.
Insulin, HOMA-IR, triglycerides and HDL cholesterol were log transformed (data are shown as adjusted geometric mean ± SE). Data were analyzed using two-way analysis of covariance (ANCOVA) adjusted for age, season, VFA, smoking status, medication use, vitamin D intake, and alcohol consumption. *p < 0.05 vs. low CRF within the same 25(OH)D group. †p < 0.05 vs. low 25(OH)D within the same CRF group. Boldface indicates significance (p < 0.05). In the present study, 25(OH)D groups were divided according to the median serum 25(OH)D concentration (36.3 nmol/L) and CRF groups were divided according to the median V.
O2max value of each age group (mL/kg/min): 37.1 for 40–49 years, 38.8 for 50–59 years, 31.3 for 60–69 years, and 27.7 for 70–79 years.
36
Figure 3-1. Associations of 25(OH)D and CRF with HOMA-IR. HOMA-IR was log transformed for two-way analysis of covariance with adjustment for age, season, visceral fat area, smoking status, medication use, vitamin D intake, and alcohol consumption. Data are shown as adjusted geometric mean ± SE. CRF: cardiorespiratory fitness; HOMA-IR:
homeostasis model assessment of insulin resistance; 25(OH)D: 25-hydroxyvitamin D. *p <
0.05 vs. low CRF within the same 25(OH)D group. †p < 0.05 vs. low 25(OH)D within the same CRF group. In the present study, 25(OH)D groups were divided according to the median serum 25(OH)D concentration (36.3 nmol/L), and CRF groups were divided according to the median V.
O2max value of each age group (mL/kg/min): 37.1 for 40–49 years, 38.8 for 50–59 years, 31.3 for 60–69 years, and 27.7 for 70–79 years.
37
Chapter 4 Effects of 1-year vitamin D supplementation on insulin resistance in Japanese adults:
a double-blind, randomized, placebo-controlled trial 4-1. Introduction
Mounting evidence suggests that altered vitamin D homeostasis may play a role in the development of dyslipidemia, insulin resistance and T2DM (5). According to observational studies higher circulating 25(OH)D concentration had relatively lower glucose, triglyceride, low-density lipoprotein cholesterol (LDL-C), HOMA-IR or risk of incident T2DM (60, 61, 75, 80, 81). This suggests that increasing circulating 25(OH)D concentration may have beneficial effects on glucose and lipid metabolism. However, according to randomized controlled intervention studies, the causal relationship between 25(OH)D concentration and glucose and lipid profiles in generally healthy adults remain unclear because of the marked differences in duration, participant population, and dosing regimen (6-11).
Considerable evidence suggests that high daily physical activity or regular exercise can improve HOMA-IR, dyslipidemia, and lower risk of incident cardiometabolic disease (13, 67, 82), and related with higher circulating 25(OH)D in adults even after adjustment for sun exposure time (18, 20, 21).
Furthermore, visceral fat accumulation has been convincingly shown to be an independent predictor of cardiometabolic disease (25), and robustly related with circulating 25(OH)D concentration than BMI in Asian (77). Therefore, the confounding effects of physical activity and visceral fat
38
accumulation need to be considered when investigating the effect of vitamin D supplementation on cardiometabolic risk.
Therefore, the purpose of the present study was to investigate the effect of a 1-year double-blind, randomized, placebo-controlled trial with vitamin D supplementation on cardiometabolic risk in general healthy Japanese adults.
4-2. Methods
4-2-1. Subjects
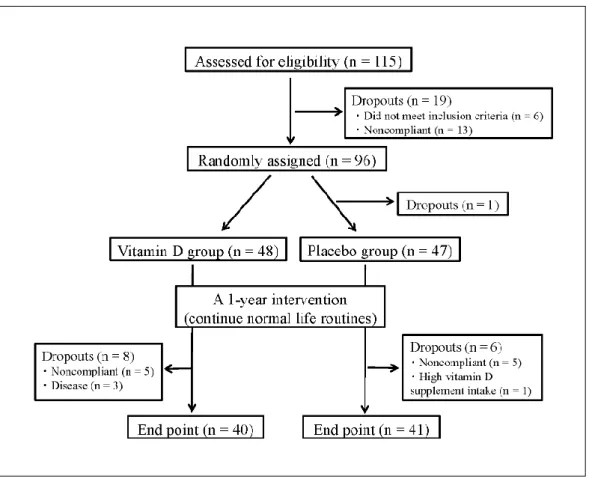
The subjects were recruited through the Internet, posters, and local newspaper insert in Saitama, Japan (35°N latitude). These subjects were aged 20-69 years and had no history of cardiac disease, type 1 or 2 diabetes, hepatic disease, and chronic renal failure. We excluded the subjects who were taking vitamin D supplements, or medications that could affect the study variables (i.e., calcium or any drugs that could affect bone and mineral metabolism, including bisphosphonates). The purpose, procedures, and risks of the study were explained to each subject prior to inclusion, and all of the subjects were enrolled with written informed consent. All of the procedures were reviewed and approved by the ethics committee of Waseda University (2011-045). The study was registered at UMIN-CTR Clinical Trial (no. UMIN000007853).
4-2-2. Study design
This study was designed as a double-blind, randomized, placebo-controlled trial with
39
supplementation of 420 IU (three tablets) of vitamin D (Nature Made, Otsuka Pharmaceutical Co., Ltd., Tokyo, Japan) or three placebo tablets per day for 1 year. The participants were stratified according to age and sex, and randomly allocated to the vitamin D or placebo group by using a computer-generated random number sequence. In addition, they were advised to maintain their normal diets and physical activities during the intervention. As a result, 48 participants were assigned to the vitamin D group (17 men); and 47 participants, to the placebo group (17 men). All supplements were prepared in the same bottles and sent to the homes of the participants every 3 months. Moreover, the participants were asked to make a record after taking the supplements daily. All investigations at baseline were repeated at 1-year follow-up.
4-2-3. Anthropometric measurement
Height and body mass were measured with the participants in light clothing and barefoot. BMI was calculated by dividing the body mass in kilograms by the square of height in meters (kg/m2). Waist circumference (WC) was measured to the nearest 0.1 cm, at the umbilical region by using an inelastic measuring tape at the end of normal expiration. Dual-energy X-ray absorptiometry was used to measure percent body fat (Hologic QDT-4500, DXA Scanner, Hologic Inc., Whaltham, MA, USA) by a radiology technologist. Resting systolic blood pressure (SBP) and diastolic blood pressures (DBP) were measured by using an automated device (HEM-7430, Omron, Kyoto, Japan) over the brachial arteries. Recordings were made in duplicate, with the participants in the seated position. The
40
average values were used in the analysis. The health status of the subjects was confirmed by using a medical questionnaire and measuring blood pressure by accredited nurses or physicians. The visceral fat area (VFA) and subcutaneous fat area (SFA) were measured by using magnetic resonance imaging (MRI; Signa 1.5 T, General Electric, Inc., Milwaukee, WI, US). The imaging conditions included a T1 weighted spin-echo and axial-plane sequence, with a slice thickness of 10 mm, a repetition time of 140 ms, and an echo time of 12.3 ms. Cross-sectional images were obtained at the level of the umbilicus. During the scan, the participants were asked to hold their breath for approximately 30 s after inhalation to prevent artifacts caused by respiratory motion. The magnetic resonance images were transferred to a personal computer in the Digital Imaging and Communications in Medicine file format. The cross-sectional area of the visceral fat at the umbilical level was determined by using image-analysis software (Slice-o-matic 4.3 for Windows, Tomovision, Montreal, Canada). To minimize interobserver variation, all analyses were performed by the same investigator. The coefficient of variation for the cross-sectional area at the umbilical level was 0.4%.
4-2-4. Lifestyle variables
Physical activity was measured by using a uniaxial accelerometer (Kenz Lifecorder PLUS, SUZUKEN Co Ltd., Nagoya, Japan). The participants were instructed to continuously wear the monitor on their belt or waistband for 10 days, except when sleeping or bathing. Participants with fewer than 7 days (5 weekdays and 2 weekend days) of activity recorded were eliminated from the