九州大学学術情報リポジトリ
Kyushu University Institutional Repository
細胞接着ナノ界面の観察のための局在プラズモン蛍 光イメージング法の確立
増田, 志穂美
https://doi.org/10.15017/4059993
出版情報:Kyushu University, 2019, 博士(理学), 課程博士 バージョン:
権利関係:
Establishment of LSPR-mediated fluorescence imaging for cell-attached nanointerface
細胞接着ナノ界面の観察のための
局在プラズモン蛍光イメージング法の確立
Department of Chemistry Graduate School of Science
Kyushu University
Shihomi Masuda
2019
1
2
Contents
Chapter 1. General introduction ... 6
Chapter 2. Fundamental principles ... 10
2-1. Diffraction limit ... 10
2-2. Super-Resolution Microscopy ... 11
2-3. Total Internal Reflection Fluorescence Microscopy ... 13
2-4. Localized Surface Plasmon Resonance ... 17
2-5. Cell adhesion ... 20
2-6. Research goal ... 21
Chapter 3. Biocompatibility of metal nanoparticle sheet ... 26
3-1. Introduction ... 26
3-1-1. Biocompatibility of plasmonic materials ... 26
3-2. Experiment ... 28
3-2-1. Synthesis and purification of myristic acid-capped silver nanoparticles ... 28
3-2-2. Synthesis and purification of oleylamine-capped gold nanoparticles ... 29
3-2-3. Fabrication of self-assembled monolayers ... 31
3-2-4. The silver nanoparticle and gold nanoparticle mixed sheet ... 32
3-2-5. Preparation of biological samples ... 35
3-3. Results and Discussion... 36
3
3-3-1. Characteristics of metal NP solution and metal NP sheet ... 36
3-3-2. Optical microscope image of cells on metal NP sheet ... 39
3-4. Summary ... 41
Chapter 4. Theoretical Simulation of enhanced optical field by LSPR using the Finite-Difference Time-Domain (FDTD) method ... 45
4-1. Introduction ... 45
4-1-1. Finite-Difference Time-Domain (FDTD) simulation ... 45
4-1-2. LSPR enhancement on silver nanoparticle sheet ... 49
4-1-3. Energy transfer... 48
4-2. Results and Discussion ... 51
4-2-1. TEM image of AuOA sheet ... 51
4-2-2. FDTD simulation of AuOA sheet ... 53
4-2-3. The energy transfer to AuOA sheet ... 57
4-2-4. Estimation of effective optical field excited on AuOA sheet ... 58
4-2-5. The comparison of the LSPR field and evanescent field... 60
4-3. Summary ... 62
Chapter 5. Improvement of axial resolution on AuOA sheet ... 65
5-1. Introduction ... 65
5-1-1. Light sheet microscopy ... 65
4
5-1-2. Surface plasmon-mediated imaging techniques ... 69
5-2. Experiment ... 73
5-2-1. The equipment configuration of the customized TIRF system ... 73
5-2-2. Fabrication of AuOA sheet for fluorescence imaging ... 75
5-2-3. The sample preparation: immobilized cells ... 75
5-3. Results and Discussion ... 79
5-3-1. High-resolution imaging of a cell-attached nanointerface ... 79
5-3-2. Time-dependent morphological changes ... 84
5-3-3. Fluorescence beads images on AuOA sheet ... 85
5-3-4. Angular-dependent fluorescence images ... 88
5-4. Summary ... 90
Chapter 6. Cell dynamics imaging on the gold nanoparticle sheet ... 93
6-1. Introduction ... 93
6-1-1. Imaging of cell dynamics... 93
6-1-2. Cell migration ... 94
6-2. Experiment ... 96
6-2-1. Preparation of living cell samples ... 96
6-2-2. Chemical substances ... 96
6-3. Results and Discussion ... 97
6-3-1. Imaging of slow cell dynamics under confocal laser microscope ... 97
5
6-3-2. Imaging of fast cell dynamics under TIRF microscope ... 100
6-3-3. Chemical stimulation by FGF to cells ... 103
6-3-4. Dynamics of focal adhesion ... 106
6-3-5. Discussion Lateral resolution of the image on AuOA sheet ... 112
6-4. Summary ... 120
Chapter 7. Concluding remarks ... 123
7-1. Cytotoxicity of metal nanoparticle sheet ... 123
7-2. Theoretical Simulation of the effective optical field of AuOA sheet ... 124
7-3. Observation of cell-attached interface with AuOA sheet ... 125
7-4. Cell dynamics imaging with AuOA sheet ... 126
7-5. Prospects for the future... 127
Acknowledgement ... 129
List of Publications ... 130
6
Chapter 1. General Introduction
Optical microscopy is a method developed to observe small substances that cannot be detected by the human eye. There are two representative optical microscopes; One is a bright-field microscope, and another is a fluorescent microscope. For the observation using bright-field microscope, the light transmitted or reflected from a sample is directly detected as the two-dimensional image. For fluorescence microscopy, the two-dimensional image is constructed by detecting fluorescence from fluorescence molecules adhered or expressed in observation objects. These optical microscopes in general use visible light as a light source, and their spatial resolution is restricted by the diffraction limits determined by light wavelength (so called "Abbe diffraction limit").
𝑑 = 𝜆
2𝑛 𝑠𝑖𝑛 𝜃 = 𝜆
2𝑁𝐴
(1-1)
Here 𝜆 is a light wavelength, 𝑛 is refractive index, and 𝜃 is a spot with half-angle under microscope. The value of "𝑛 𝑠𝑖𝑛 𝜃" is called the numerical aperture (NA), which is the value determined by the imaging lens. For example, the spot size under a 100x objective lens with a numerical aperture of 1.0 is approximately 250 nm.
Although various other high-resolution microscopy has been developed such as electron microscopy using electron beam as a light source, the optical microscope is still major instruments in the field of biochemistry in spite of the resolution problem because of the compatibility with biological samples in an aqueous environment. Although the cryo- electron microscopy has been developed for imaging of biological samples under high vacuum, still the damage caused by unphysiological environment is concerned. Especially, the imaging of molecular dynamics in living tissues or living cells are only possible in
7
physiological environment, that is the research field growing together with the history of optical microscopy. Biological samples are almost transparent against visible light, which makes the imaging of fine structures difficult under the bright field microscope. To solve this problem and obtain high contrast image, the fluorescence microscopy detecting the emitted fluorescence in a dark background has been developed.
The remaining challenge for fluorescent microscopy is to achieve resolution that exceeds the diffraction limit. These high-resolution microscopes are called super-resolution microscope (SRM). There are two types of resolution to be considered; One is lateral, and another is axial resolution. Stimulated emission depletion (STED) microscope and Photoactivated localization microscopy (PALM), which were awarded the Nobel Prize in Chemistry in 2014, are high resolution microscope in the lateral direction [1-3]. These SRMs acquire a high-resolution fluorescent image by creating a reconstructed image from a plurality of images. SRM is not suitable for high-speed real-time observation, because it takes tens of seconds to minutes to reconstruct one image. Total internal reflection fluorescence (TIRF) microscope is a microscope specialized in high axial resolution. By using evanescent light for excitation, TIRF microscope can observe only fluorescence in the range of about 100 nm from the cover glass surface, and the real-time observation is also possible. However, it is difficult to obtain a resolution of 100 nm or less in the axial direction even with TIRF microscope.
In this doctoral dissertation research, I propose a new methodology to realize higher axial resolution than TIRF microscope using metal nanoparticle sheet, which excites a strong localized electric field by Localized Surface Plasmon Resonance (LSPR). Observation of the adhered surface of cells is performed using the cover slip to which the metal nanoparticle sheet is transferred. This doctoral thesis is composed of the following chapters. Chapter 2 introduces the basic principles of various fluorescent microscopy and cell adhesion, which
8
are the main topics of my thesis. In Chapter 3, I tried to determine the metal nanoparticle suitable for cell observation. I present the result of cytotoxicity test against metal nanoparticle sheet in Chapter 3. I found a metal nanoparticle sheet composed of oleylamine-capped gold nanoparticle (AuOA) was not cytotoxic unlike myristate-capped silver nanoparticles, which has been used in the previous study, and decide to use the AuOA sheet for the imaging of cell-attached interface. In Chapter 4, I showed the superiority of AuOA sheet as observation substrate by comparing the observation area on the AuOA sheet and evanescent light. The electric field excited on the AuOA sheet is calculated by the Finite-difference time-domain (FDTD) method and presented. At the same time, the energy transfer from fluorescent molecules to AuOA sheet is necessary to be considered. The intensity of effective electric field estimated by multiplying the enhanced electric field of LSPR and the quenching effect by energy transfer is shown as the data to be compared with the experimental images. In Chapter 5, the fluorescence images of cell attached nanointerface (immobilized cells) observed by using AuOA sheet are presented and discussed fluorescence enhancement factors quantitatively together with the data taken with fluorescence beads. By comparing with a TIRF microscope, the axial resolution is certainly improved on the AuOA sheet. In Chapter 6, finally I present the images of living cells and discuss the obtained spatio-temporal resolution. I challenge to determine the migration rate of the protein by tracking the position of emitting spots in image sequences. Here the improvement of lateral resolution owing to the axially confined near-field light is also discussed. The last chapter, Chapter 7, is the summary of this research and its future prospect.
9
References
[1] Schermelleh, L., et al. (2010). "A guide to super-resolution fluorescence microscopy."
Journal of Cell Biology 190(2): 165-175.
[2] Sydor, A. M., et al. (2015). "Super-Resolution Microscopy: From Single Molecules to Supramolecular Assemblies." Trends in Cell Biology 25(12): 730-748.
[3] The Nobel Prize in Chemistry 2014 - Press Release.
http://www.nobelprize.org/nobel_prizes/chemistry/laureates/2014/press.html, Nobel Media AB 2014.
10
Chapter 2. Fundamental principles
2-1. Diffraction limit
Optical resolution is defined as a minimum distance between two points distinguished under an optical microscope system including a recording camera. The optical resolution is restricted by the diffraction limits, which is theoretically defined by the following equation.
There are two calculation formulas for the diffraction limit: Abbe and Rayleigh [1]. Abbe's resolution is defined as follows.
𝛿 =0.5𝜆𝑁𝐴 = 𝑛 𝑠𝑖𝑛𝜃0.5𝜆 (2-1) On the other hand, Rayleigh resolution is defined as follows.
𝛿 =0.61𝜆
𝑁𝐴 = 0.61𝜆
𝑛 𝑠𝑖𝑛𝜃 (2-2) Here, 𝛿 is calculated resolution, 𝜆 is the wavelength of the irradiating light, and 𝑁𝐴 is the numerical aperture of the objective lens. 𝑛 is the refractive index of the medium between the objective lens and the sample. The numerical aperture 𝑁𝐴 is given by 𝑁𝐴 = 𝑛 𝑠𝑖𝑛𝜃, where 𝜃 is the maximum angle with respect to the optical axis of light incident on the objective lens from one point. By these theorems, the resolution of the fluorescent microscope is limited to about 200 nm in the lateral direction and about 500 nm in the axial direction, which is worse than the lateral direction.
There are many substances in the living body smaller than the diffraction limit, such as nucleic acids, proteins, and polysaccharides that constitute cells. In order to elucidate biological information and molecular reactions from their dynamics, it is important to develop a new microscope observation techniques having a resolution beyond the diffraction limit.
11
2-2. Super-Resolution Microscopy
Super-resolution microscope (SRM) is defined as an optical microscope which has a resolution beyond the diffraction limit. Several SRMs have been developed over the years (Figure 2-1) [2]. A confocal laser scanning microscopy (CLSM) is the first microscope beyond the diffraction limits. The CLSM detects fluorescence only at the focal plane by placing a pinhole with a circular aperture at a conjugate position with the focal point of the objective lens. The spatial resolution of CLSM is determined by the laser wavelength, the objective lens, and the size of the confocal pinhole. This fluorescence microscopy achieves resolutions of 180-250 nm in the lateral direction and 500-700 nm in the axial direction by using a sufficiently small pinhole [2].
The Stimulated Emission Depletion (STED) is a microscope, which achieves high resolution using a stimulated emission. Fluorescent molecules are excited with an excitation laser, and then STED laser having a donut-shaped intensity profile is irradiated. Excitons at the peripheral part move to the ground state without emitting due to a stimulated emission, and only the exciton at the center position emits light by a spontaneous emission. The high- resolution image can be reconstructed from the emission of these localized positions. The STED microscope has succeeded in obtaining the resolution of 50 nm in the lateral direction [3]. Furthermore, the 3D images with the resolution of 80 nm for XY and Z directions were obtained by the combination with the optical technique to improve the axial resolution [4,5].
Stochastic Optical Reconstruction Microscopy (STORM) and Photoactivated Localization Microscopy (PALM) are categorized as a localization microscope. In a normal fluorescent microscope, all fluorescence molecules are excited and detected at the same time. Thus, the point images obtained are overlapped and cannot be distinguished in space. In a localized microscope, emitting fluorescence is detected alternatively at different times. The emission centers obtained are recorded one by one on the coordinate and the high-resolution image
12
is reconstructed [6]. STORM uses weak excitation light to obtain the information of emission center positions by exciting only a few fluorescent molecules that are further separated than the diffraction limit. A high-resolution image is then reconstructed from a large number of repeatedly acquired images [7]. In 2006, Betzig et al. invented PALM technology based on the localization of light-switching fluorescent proteins and fluorescence quenching [8].
However, these localization microscopes have a weak point for their temporal resolution because of the procedure to reconstruct one image from multiple images.
In recent years, a light sheet microscope has been developed. The light sheet microscope is paid attention as a technology aiming at super-resolution while preventing phototoxicity to cells. The light sheet microscope obtains an image with high vertical resolution by applying excitation light formed into a thin sheet from the side of the sample.
For confocal microscopes and two-photon microscopes, excitation light irradiates not only the focal plane but also the entire specimen and give damages to the sample. On the other hand, the light sheet microscope can suppress light damage by preventing light irradiation to the outside the focal plane [9]. In the current light sheet microscope, the lateral resolution is still determined by the diffraction limit and the axial resolution is in the order of µm. However, further development is expected, especially for live-cell imaging (more information is available in Chapter 5).
13
Figure 2-1. Resolution of commercial super-resolution microscope (SRM). The lateral and axial resolutions are shown respectively. In PALM and STORM, the axial resolution is improved in combination with TIRF microscope. These resolution values depend on fluorescence dyes, local refractive index, quality of camera and optical system, etc. [2].
2-3. Total Internal Reflection Fluorescence Microscopy
Total Internal Reflection Fluorescence (TIRF) microscope is a microscope widely used for interfacial imaging. When light is irradiated from a high refractive index 𝑛1 toward a medium having a low refractive index 𝑛2 at an angle larger than the critical angle, the light undergoes total reflection at the interface. Under the internal total reflection, evanescent light is excited at the interface in the low refractive index medium. The critical angle 𝜃𝐶 is expressed by the following formula based on Snell’s law.
𝜃𝐶= 𝑠𝑖𝑛−1(𝑛2
𝑛1) (2-3)
14
The critical angle at the boundary between the cover glass (𝑛1 = 1.52) and the aqueous solution (𝑛2 = 1.33) is about 61 °. The intensity and the depth of evanescent light are expressed by the following equations [10,11].
𝐼(𝑧) = 𝐼0𝑒−𝑧/𝑑 (2-4) 𝐼0 is the intensity of the evanescent wave at 𝑧 = 0. The depth of the evanescent wave 𝑑 refers to the distance over which 𝐼0 decays to 1/e, and d is defined by the following equation (2-5).
𝑑 = 4𝜋𝜆 (𝑛12𝑠𝑖𝑛2𝜃 − 𝑛22)−1/2 (2-5) 𝜆 is the wavelength of light. Since the intensity of evanescent light decays exponentially, the TIRF microscope can acquire fluorescence in the range of about 100 nm from the cover slip surface by using evanescent light as excitation light (Figure 2-2). Thus, the axial resolution of TIRF microscope is better than the diffraction limit (Figure 2-3).
The TIRF microscope is a relatively simple instrument and has already widely used in the field of cell biology. It has been used for research dealing with surface morphology and molecular dynamics such as exocytosis and endocytosis in the cell membrane and cytoskeleton.
As a method of STORM, axial resolution of about 20 nm is obtained by combining a low- intensity CW laser, optical switching dye, and TIRF microscope optical system (Figure 2-1).
15
Figure 2-2. Comparison of epifluorescence and TIRF illumination. (A) In epifluorescence, all fluorescent molecules in the cells are excited. (B) In TIRF illumination, only fluorescent molecules within the range where evanescent light penetrates from the cover glass to the sample side are excited. In order to obtain TIRF illumination, the refractive index 𝑛1 of the sample side needs to be smaller than the refractive index 𝑛2 of the cover glass. [10]
16
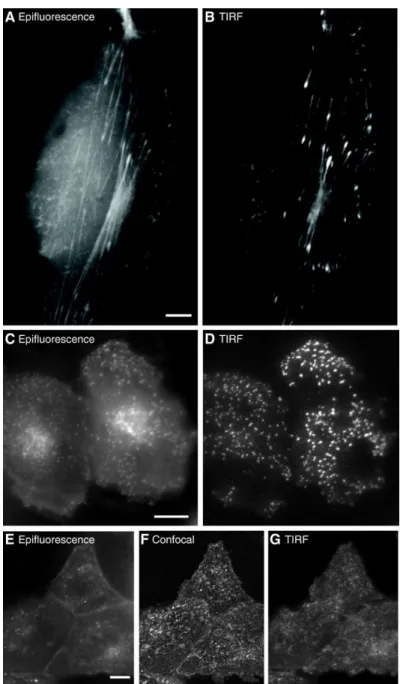
Figure 2-3. Comparison of epifluorescence image and TIRF image; Epifluorescence image (A) and TIRF fluorescence image (B) of actin in MDCK cells. (C) and (D) are those of clathrin- GFP in HeLa cells. (E), (F) and (F) are epifluorescence image, confocal fluorescence microscope image and TIRF fluorescence image of caveolin-1-EGFP in MDCK cells. Scale bars are 10 µm. [10]
17
2-4. Localized Surface Plasmon Resonance
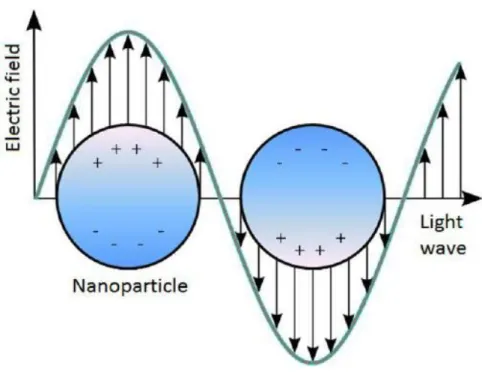
Localized surface plasmon resonance (LSPR) is a phenomenon that collective oscillations of free electrons on the metal surface interact with light of a specific wavelength when light is irradiated onto small metal nanoparticle (Figure 2-4) [13]. The LSPR resonance wavelength can be adjusted by the size, shape and chemical properties of the nanoparticles.
LSPR is also greatly influenced by the surrounding physicochemical environment where nanoparticles exist. LSPR has an electric field confinement effect and can generate a strong localized electric field in the range of the particle diameter from the metal / dielectric interface [14]. Sensing and diagnosis are performed as applications of LSPR in biomedical field.
Figure 2-4. Schematic of LSPR. The conduction electrons in the metal fine particles resonate with the incident light to generate LSPR. [13]
18
We call two-dimensionally self-assembled monolayer composed of metal nanoparticles
“metal nanoparticle sheet”. In previous studies, myristate-coated silver nanoparticle (AgMy) sheets were fabricated from AgMy dispersed in toluene by self-assembly at the air-water interface and various optical properties were investigated [15]. The LSPR coupling between adjacent particles in the AgMy sheet excites a stronger enhanced electric field compared with a single nanoparticle and also a single pair (two particles). Since the nanoparticles are arranged at high density in a two-dimensional plane at an infinite size (~ cm2), uniform and very strong plasmon electric field can be excited in the AgMy sheet (Figure 2-5). When AgMy forms a two-dimensional sheet, the plasmon resonance wavelength is greatly shifted to the longer wavelength and the LSPR band is sharpened (the band width is narrowed) compared to that of a single nanoparticle or a single pair (Figure 2-6). Furthermore, the plasmon characteristics of AgMy sheets vary depending on the distance between adjacent nanoparticles [15,16]. Figure 2-7 shows the change in resonance wavelength when myristic acid, a capping molecule of AgMy, is substituted with thiol molecules having various chain lengths. Figure 2-7 shows that the shorter capping molecules resulted in the shorter interparticle distance and larger red-shift of LSPR peak.
19
Figure 2-5. A SEM image of AgMy sheet, in which the region marked by #1-3 are enlarged and converted FFT images. AgMy nanoparticles were hexagonally arranged with an interparticle distance of 6.7 ± 0.1 nm. [15]
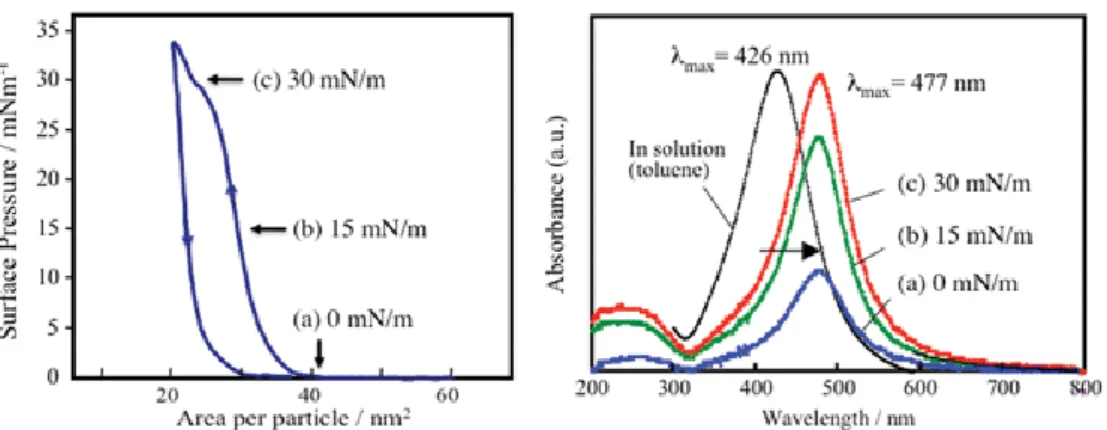
Figure 2-6. π-A curve of AgMy sheet at the air-water interface (left) and UV-vis spectra of AgMy toluene dispersion and AgMy sheet transferred to hydrophobic glass substrate under various surface pressures (right). [15]
20
Figure 2-7. Relationship between LSPR peak position and interparticle distance between nanoparticles. [15]
2-5. Cell adhesion
Cell-cell adhesion creates tissues, and cell-matrix adhesion connects different tissues and builds up higher-order organs. Cell adhesion is an indispensable function for forming and maintaining a living body. There are various protein complexes playing a key role in cell binding. Regarding cell adhesion, observation using an electron microscope first reported that the basal cell membrane of fibroblasts was in close contact with the substrate [17]. In addition, the detailed positional information of the proteins constructing focal adhesion is revealed by using super resolution microscope (Figure 2-8) [18].
The cytoskeleton plays an important role in maintaining cell morphology, cell movement, intracellular mass transport, cell division, etc. Three types of filaments, actin filaments, microtubules and intermediate filaments, form the cytoskeleton. In particular, actin filaments
21
play a central role in dynamic process in cells, and it has been confirmed that actin dynamics induces cell differentiation [19]. To manage cell proliferation and differentiation by controlling of the dynamics of the actin skeleton by mechanical stimulation has been reported. It is an important scaffold involved in cell adhesion and spreading, and cells cannot maintain their shape or proliferate without focal adhesion. In recent years, it has been revealed that mechanical stimuli (hard / soft) transmitted from focal adhesions to actin filaments influences in stem cell differentiation. [20]
Figure 2-8. Nanoscale structure of focal adhesion. A model of protein positions is depicted from observations using a super-resolution microscope. [18]
2-6. Research goal
In this doctoral dissertation research, I developed and evaluated an imaging substrate using metal nanoparticle sheet, which acquire images of the nanointerface with high speed and high resolution. It is expected that higher resolution can be obtained in the axial direction
22
compared with other microscopes including the TIRF microscope by exciting and enhancing only the fluorescence at nanointerface owing to the LSPR field on the metal nanoparticle sheet. Oleylamine-coated gold nanoparticles (AuOA), which exhibits less cytotoxicity compared with AgMy, were used in this study. This new technique enables the imaging of living cells, especially immature focal adhesion that could not be observed with a regular microscope.
As future prospect of this research, we plan to combine it with image analysis using deep learning. For example, the prediction of stem cell differentiation using deep learning has already been reported [21], where the deep learning was used to learn the dynamic morphology of the stem cells from a series of images that differentiate into various type of cells. The accuracy of deep learning is improved by repeating process that predicts differentiated cells from the cell dynamics of before differentiation and learns the results. By this technique, a differentiated cell can be predicted from a precursor cell before the differentiation marker is expressed. By combining the images obtained by high-speed and high-resolution LSPR-mediated observation technique and the image analysis using deep learning, cell differentiation research and disease diagnosis are expected to be greatly advanced.
23
Figure 2-9. Prediction of hematopoietic stem cell differentiation by deep learning. (a) Differentiation into granulocyte monocyte lineage is determined by expression of CD16 / 32 antibody, and differentiation into megakaryocyte / erythrocyte lineage is determined by expression of GATA1. Deep learning system learning is performed from cell image group (b) that differentiates into granulocyte monocyte lineage and cell image group (c) of megakaryocyte / erythrocyte lineage. (d) The image is abstracted by repeatedly extracting local features in the convolution layer and collecting the local features in the pooling layer.
(e) While incorporating the features of each image extracted by CNN, the time-varying collection of cell images is input to RNN. (f) Schematic diagram of round robin training. (g) Evaluation by area under the curve (AUC). AUC from images of Latent cells (h) and annotated cells (i). From Annotated cells, AUC = 75% is reached at the beginning 25% of the cell cycle. [21]
24
References
[1] Super-Resolution Microscopy Tutorial
https://advanced-microscopy.utah.edu/education/super-res/
[2] Schermelleh, L., et al. (2010). "A guide to super-resolution fluorescence microscopy."
Journal of Cell Biology 190(2): 165-175.
[3] Vicidomini, G., et al. (2014). "Gated CW-STED microscopy: A versatile tool for biological nanometer scale investigation." Methods 66(2): 124-130.
[4] Gould, T. J., et al. (2012). "Adaptive optics enables 3D STED microscopy in aberrating specimens." Optics Express 20(19): 20998-21009.
[5] Punge, A., et al. (2008). "3D reconstruction of high-resolution STED microscope images." Microscopy Research and Technique 71(9): 644-650.
[6] Errico, C., et al. (2015). "Ultrafast ultrasound localization microscopy for deep super- resolution vascular imaging." Nature 527(7579): 499-+.
[7] Han, R. C., et al. (2013). "Recent Advances in Super-Resolution Fluorescence Imaging and Its Applications in Biology." Journal of Genetics and Genomics 40(12): 583-595.
[8] Betzig, E., et al. (2006). "Imaging intracellular fluorescent proteins at nanometer resolution." Science 313(5793): 1642-1645.
[9] Lu, C. H., et al. (2019). "Lightsheet localization microscopy enables fast, large-scale, and three-dimensional super-resolution imaging." Communications Biology 2: 10.
[10] Mattheyses, A. L., et al. (2010). "Imaging with total internal reflection fluorescence microscopy for the cell biologist." Journal of Cell Science 123(21): 3621-3628.
[11] Martin-Fernandez, M. L., et al. (2013). "A 'pocket guide' to total internal reflection fluorescence." Journal of Microscopy 252(1): 16-22.
[12] Tokunaga, M., et al. (2008). "Highly inclined thin illumination enables clear single- molecule imaging in cells." Nature Methods 5(2): 159-161.
25
[13] Hammond, J. L., et al. (2014). "Localized Surface Plasmon Resonance as a Biosensing Platform for Developing Countries." Biosensors 4(2): 172-188.
[14] Amendola, V., et al. (2017). "Surface plasmon resonance in gold nanoparticles: a review." Journal of Physics-Condensed Matter 29(20): 48.
[15] Toma, M., et al. (2011). "Collective plasmon modes excited on a silver nanoparticle 2D crystalline sheet." Physical Chemistry Chemical Physics 13(16): 7459-7466.
[16] Saito, N., et al. (2018). "Durability improvements of two-dimensional metal nanoparticle sheets by molecular cross-linked structures between nanoparticles." Japanese Journal of Applied Physics 57(3): 5.
[17] Geiger, B., et al. (2001). "Transmembrane extracellular matrix-cytoskeleton crosstalk."
Nature Reviews Molecular Cell Biology 2(11): 793-805.
[18] Kanchanawong, P., et al. (2010). "Nanoscale architecture of integrin-based cell adhesions." Nature 468(7323): 580-U262.
[19] Nobusue, H., et al. (2014). "Regulation of MKL1 via actin cytoskeleton dynamics drives adipocyte differentiation." Nature Communications 5: 12.
[20] Kidoaki, S., (2010). “Mechanics in Cell Adhesion and Motility on the Elastic Substrates.” Journal of Biomechanical Science and Engineering 5: 3.
[21] Buggenthin, F., et al. (2017). "Prospective identification of hematopoietic lineage choice by deep learning." Nature Methods 14(4): 403-+.
26
Chapter 3. Biocompatibility of metal nanoparticle sheet
3-1. Introduction
The purpose of this study is to develop a high-resolution imaging substrate composed of metal nanoparticle sheet, which can be used to observe biological samples such as cells.
In this chapter, the cytotoxicity of the metal nanoparticles, oleylamine-capped gold nanoparticle (AuOA) and myristic acid capped silver nanoparticle (AgMy), were examined by using these mixed films.
3-1-1. Biocompatibility of plasmonic materials
Metal nanoparticles have been used for several applications such as surface- enhanced Raman spectroscopy (SERS), metal enhanced fluorescence (MEF), biomedical diagnosis, drug delivery. Although silver is a material having excellent plasmon characteristics, there is concern about cytotoxicity when it is used as biomaterials.
Cytotoxicity of silver nanoparticles have been reported concerning growth inhibition, DNA synthesis inhibition, macrophage morphological changes and viability reduction [1,2].
Therefore, research on surface modification methods for biomaterials to protect biomolecules from toxicity has been conducted. Gold is inferior to silver in terms of plasmon characteristics, however, it is superior concerning biocompatibility. Gold nanoparticles and gold nanorods are expected to be applied to medical and biological research such as photothermal therapy (PT) (Figure 3-1) [3] or SERS (Figure 3-2) [4].
27
Figure 3-1. Photothermal therapy using collagen hydrogel containing gold fine particles. Mice in group I received the laser treatment (635 nm, 169.85 mW cm−2, 10 min) at 12 hours after the gold particles collagen gel injection. Group II mice received the same irradiation at 12 and 24 hours. Group III tumors received a total of 4 cycles of treatment after 12, 24, 48 and 96 hours. Group IV received a total of 5 laser irradiations of 12, 24, 48, 96 and 120 hours.
(a) Tumor volume of mice after treatment. (b) Photograph of tumor weight after treatment and the excised tumor of each group obtained 23 days after treatment. (c) Histological images of different groups of tumor slices (with Hematoxylin-Eosin staining). (d) Mouse weight after treatment. [3]
28
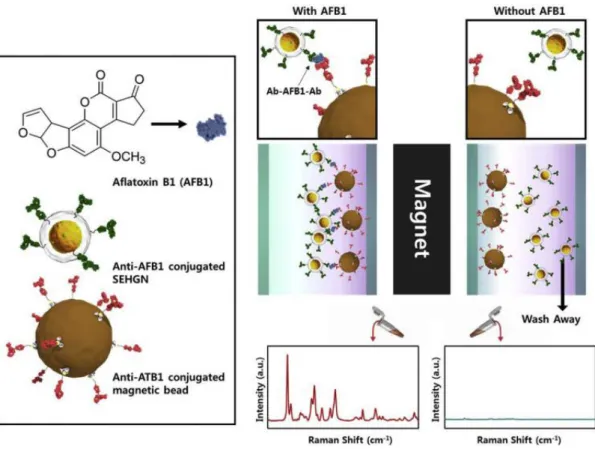
Figure 3-2. Schematic illustration of surface-enhanced Raman scattering (SERS) based immunoassay for detecting aflatoxin B1 (AFB1) using silica-encapsulated hollow gold nanoparticles (SEHGN) and magnetic beads. [4]
3-2. Experiment
3-2-1. Synthesis and purification of myristic acid-capped silver nanoparticles
AgMy is synthesized through thermal decomposition method by mixing silver acetate and myristic acid and pyrolyzing at 250 °C in a nitrogen atmosphere [5]. In this synthesis method, myristic acid melts at 80 °C and become a reaction solvent and also capping molecules. At the temperature over 200 °C, silver atoms form nuclei and spontaneously myristic acid adsorbs on the surface of the silver nanoparticles and stop the growth reaction.
29
After the synthesis, 20 mg of AgMy dried sample is transfered into a screw tube with 10 ml toluene and ultrasonicated to obtain the dispersion. Then, 5 ml of AgMy dispersion solution is put into two centrifuge tubes and purified by the following procedures of A and B, in the order of A, A, B, A, A. The excess myristic acid and larger or smaller sized nanoparticles are removed from the reaction solution by this purification process and uniformly sized AgMy can be obtained.
Procedure A
15 ml of ethanol is added into 5 ml of AgMy solution in the centrifuge tube and disperse using an ultrasonication. The solution is centrifuged at 15 ° C, 6000 rpm for 10 minutes, and the supernatant solution containing excess myristic acid and smaller sized silver particles is removed. 5 ml of toluene is added into the precipitated AgMy and the particles are re- dispersed by ultrasonic
ation.
Procedure B
5 ml of AgMy solution is dispensed into four 1.5 ml centrifuge tubes and centrifuged at 15 ° C, 5000 rpm for 10 minutes to precipitate larger sized silver particles. The supernatant solution containing silver particles are collected into single centrifuge tube (total 5 ml).
3-2-2. Synthesis and purification of oleylamine-capped gold nanoparticles
The synthesis of AuOA was conducted by referring to the technique of Hiramatsu et al.
[6,7]. 1 mmol of chloroauric acid (III) tetrahydrate and 6 ml of oleylamine was added to the screw tube and dispersed by ultrasonication. In this reaction, oleylamine play a role of reducing agent and capping molecule. Here, 4 ml of toluene as a reaction solvent was added
30
into the screw tube to completely dissolve chloroauric acid (III) tetrahydrate. Next, 46 ml of toluene was poured into a 100 ml three-necked flask and stirred at 600 rpm under the atmosphere of nitrogen gas. When the toluene in three-necked flask was heated to 110 ° C, chloroauric acid (III) tetrahydrate and oleylamine solution in the screw tube was added. After 1 hour reaction at 110 ° C, the temperature was lowered to 90 ° C and kept for 3 hours (Figure 3-3) [8]. After completion of the reaction, the synthesized solution was cooled down with stirring until it reached room temperature.
In order to remove excess oleylamine, the reactant was purified by repeating the procedure A described below for three times.
Procedure A
10 ml of methanol is added into 5 ml AuOA synthesized solution in the centrifuge tube and ultrasonicated. This solution is centrifuged at 15 ° C, 2000 rpm for 10 minutes, and the supernatant solution containing excess oleylamine and small gold nanoparticle is removed.
5 ml of toluene is added into the precipitated AuOA and re-dispersed with ultrasonication.
31
Figure 3-3. Schematic illustration of the synthesis route for AuOA. An amount of 411 mg (1.0 mmol) of gold (III) chloride acid 4-hydrate and 5 mL (15.2 mmol) of oleylamine were dissolved in 50 mL of toluene and heated to 110 °C for 1 hour. The reaction solution was held at 90 °C for another 3 hours. When the solution was cooled to room temperature, the AuOA were extracted by ultracentrifuge and purified several times to remove excess oleylamine. The purified AuOA were redispersed in toluene [8].
3-2-3. Fabrication of self-assembled monolayers
The AuOA self-assembled monolayer was fabricated at the air-water interface in an LB trough (KSV NIMA, Sweden), as described in our previous study [7]. The AuOA dispersion in toluene was spread on water. After toluene evaporated, solid-like domains were formed on the water surface by self-assembly of AuOA. The solid-like domains were gathered using a Teflon bar and compressed until the surface pressure reached 15 mN/m. The sheet was transferred onto a cover slip hydrophobized by hexamethyldisilazane (HMDS) via the Langmuir-Schaefer (LS) method (Figure 3-4). AgMy sheet was also produced by the same method as AuOA sheet.
32
Figure 3-4. Fabrication procedure for self-assembled monolayers composed of AuOA. The AuOA dispersion in toluene was spread at the air-water interface in an LB trough. After evaporation of toluene, solid-like domains were formed on water surface by self-assembly of AuOA NPs. The solid-like domains were gathered using a Teflon bar and compressed until the surface pressure reached 15 mN/m. The sheet was transferred onto a cover slip hydrophobized by hexamethyldisilazane (HMDS) via the Langmuir-Schaefer (LS) method [8].
3-2-4. The silver nanoparticle and gold nanoparticle mixed sheet
Two-dimensional nanoparticle sheets composed of silver and gold mixed nanoparticles is fabricated from a dispersion containing both nanoparticles [9]. In order to prepare the AuOA and AgMy mixed sheet, firstly the occupied area of AuOA and AgMy in the single component sheet was calculated. Then AuOA and AgMy mixed solutions with different mixing ratios were prepared by mixing two kinds of nanoparticle solution as to be AuOA:
AgMy = 7: 3, 5: 5, 3: 7. From these solutions, mixed nanoparticle sheets were fabricated in the same manner as single component AuOA and AgMy.
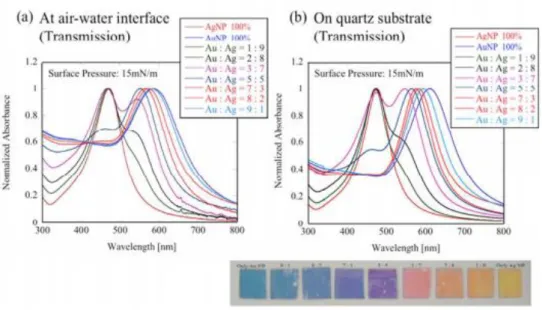
As reported in previous study, AuOA and AgMy mixed nanoparticle sheet exhibited two independent peaks both at air-water interface and on quartz substrate (Figure 3-5) [9]. The
33
intensity and peak position change stepwise with the mixing ratio. The peak derived from AuOA shifts for long wavelength as the AuOA ratio increases. This phenomenon is interpreted by the island domain size change of AuOA in AgMy matrix phase as presented in the SEM images (Figure 3-6). When particle size of Ag and Au nanoparticles are the same, the mixed nanoparticle sheet showed no clear phase-segregated domain structures because of similar van der Waals interactions between Ag and Au particles (Figure 3-7) [10]. By using these mixed nanoparticle sheet, the LSPR wavelength can be precisely adjusted, which is quite useful to achieve wavelength overlap with excitation / emission of a wide variety of fluorescence dyes for imaging.
Figure 3-5. Absorption spectrum of mixed 2D sheet composed of 10 nm AuOA and 5 nm AgMy at air-water interface (a) and on glass substrate(b). The color of the AuOA and AgMy mixed sheet is shown in the photograph. [9]
34
Figure 3-6. SEM images of mixed 2D sheet composed of 10 nm AuOA and 5 nm AgMy. [9]
Figure 3-7. SEM images of mixed 2D sheet composed of 5 nm AuNP and 5 nm AgNP mixed monolayer. (left) Au:Ag=7:3, (middle) Au:Ag=5:5, (right) Au:Ag=3:7. [9]
35
3-2-5. Preparation of biological samples
Rat basophilic leukemia (RBL-2H3) cells were cultured in Roswell Park Memorial Institute (RPMI) 1640 medium supplemented with 10% fetal calf serum (FCS), 100 U/mL penicillin, and 100 μg/mL streptomycin [8,11]. RBL-2H3 cells were harvested using trypsin.
A flexiPERM® chamber conA (ϕ12 mm, Greiner Bio One) was placed on the glass slip half- covered with the metal NP sheet to make a ‘well’ to retain the cell solution. The substrates were sterilized by UV irradiation for 30 min prior to use. RBL-2H3 cells in culture medium were placed into the well and cultured for overnight in a CO2 incubator (Figure 3-8).
Figure 3-8. Cell adhesion to glass and half-covered with metal nanoparticle sheet. (a) Schematic diagram of a container made on substrate using FlexiPERM® chamber conA. (b) Illustration of cells adhered to glass and half-covered with metal nanoparticle sheet.
36
3-3. Results and Discussion
3-3-1. Characteristics of metal NP solution and metal NP sheet
Figure 3-9 shows surface pressure (π) - area per particle (A) curve of AuOA nanosheeet (monolayer). The occupied area of single particles was about 120 nm2. Figure 3-10 shows absorption spectra of AuOA dispersion and self-assembled monolayer sheet.
The large red-shift of the LSPR band by the sheet formation originates from the long-range interaction of LSPR in the sheet, as described in our previous studies [7,12].
In a similar manner to AuOA sheet, π-A curve and absorption spectra of AgMy toluene dispersion and the two-dimensional sheet are shown in Figure 3-11 and Figure 3-12, respectively. The occupied area of single AgMy was about 60 nm2. Figure 3-13 and Figure 3-14 show the absorption spectra of the mixed solution and monolayer of AuOA : AgMy = 3:
7, 5:5, 7:3. In good agreement with the previous report, only AuOA peaks derived from AuOA was shift depending on the mixing ratio in the mixed monolayer shown in Figure 3-14.
Figure 3-9. Surface pressure (π) – Area (A) curve of AuOA sheet.
37
Figure 3-10. LSPR absorption spectra of AuOA dispersion (Black line) and AuOA sheet (red line).
Figure 3-11. Surface pressure (π) – Area (A) curve of AgMy sheet.
38
Figure 3-12. LSPR absorption spectra of AgMy dispersion (Black line) and AgMy sheet (red line).
Figure 3-13. LSPR absorption spectra of AuOA : AgMy mixed dispersion.
39
Figure 3-14. LSPR absorption spectra of AuOA : AgMy sheet.
3-3-2. Optical microscope image of cells on metal NP sheet
The cells could not adhere on AuOA sheet, AgMy sheet, and AuOA: AgMy mixed sheet by 30 minutes as shown in Figure 3-15. Figure 3-16 shows phase contrast images of cells cultured on metal nanoparticle sheets in a CO2 incubator overnight. Here the cells exhibited elongated morphology on the AuOA sheet as well as on the AuOA: AgMy = 7: 3 mixed sheet.
On the other hand, cell adhesion was suppressed as the AgMy ratio increased, i.e., most cells are not adhered on the AuOA: AgMy = 3: 7 mixed sheet and AgMy sheet. Furthermore, bubble-like structures are obsrved in the cells when adhered on the AgMy sheet. These are the sign of apoptosis. The result revealed that AgMy is cytotoxic and not suitable to use as the imaging substrate as it is.
Figure 3-17 shows the cell attachment on glass half-covered with AuOA sheet. The cells adhered to the both glass and AuOA sheet in an elongated morphology, suggesting the biocompatibility of AuOA sheet.
40
Figure 3-15. Phase contrast microscope images of cells cultured for 30 minutes on the metal nanoparticle sheets.
Figure 3-16. Phase contrast microscope images of cells cultured overnight on the metal nanoparticle sheets.
41
Figure 3-17. Optical microscope images of cells attached on glass and the AuOA sheet. (a) RBL-2H3 cells attached on glass slip and (b) on the AuOA sheet. These cells were cultured independently in isolated chambers overnight. (c) RBL-2H3 cells cultured on a glass slip half covered with AuOA sheet in the same chamber.
3-4. Summary
In this chapter, the cytotoxicity of the cells adhered on the metal nanoparticle sheets were examined. AgMy is found to be highly toxic to cells, i.e., even AuOA: AgMy mixed nanoparticle sheets are not suitable for direct use as the imaging substrate. Although the LSPR characteristics of AuOA sheet are inferior to the AgMy sheet, AuOA sheet is less
42
cytotoxic and usable as the imaging substrate for the fluorescence microscopy unlike AgMy sheet.
43
References
[1] Hidalgo, E. and C. Dominguez (1998). "Study of cytotoxicity mechanisms of silver nitrate in human dermal fibroblasts." Toxicology Letters 98(3): 169-179.
[2] Rungby, J., et al. (1987). "SILVER AFFECTS VIABILITY AND STRUCTURE OF CULTURED MOUSE PERITONEAL-MACROPHAGES AND PEROXIDATIVE CAPACITY OF WHOLE MOUSE-LIVER." Archives of Toxicology 59(6): 408-412.
[3] Xing, R. T., et al. (2016). "An Injectable Self-Assembling Collagen-Gold Hybrid Hydrogel for Combinatorial Antitumor Photothermal/Photodynamic Therapy." Advanced Materials 28(19): 3669-3676.
[4] Ko, J., et al. (2015). "Highly sensitive SERS-based immunoassay of aflatoxin B1 using silica-encapsulated hollow gold nanoparticles." Journal of Hazardous Materials 285: 11-17.
[5] Keum, C. D., et al. (2008). "A gram scale synthesis of monodispersed silver
nanoparticles capped by carboxylates and their ligand exchange." Journal of Nonlinear Optical Physics & Materials 17(2): 131-142.
[6] Hiramatsu, H. and F. E. Osterloh (2004). "A simple large-scale synthesis of nearly monodisperse gold and silver nanoparticles with adjustable sizes and with exchangeable surfactants." Chemistry of Materials 16(13): 2509-2511.
[7] Yoshida, A., et al. (2012). "Spectroscopic Properties of Multi layered Gold Nanoparticle 2D Sheets." Langmuir 28(49): 17153-17158.
[8] Masuda, S., et al. (2017). "High-resolution imaging of a cellattached nanointerface using a gold-nanoparticle two-dimensional sheet." Scientific Reports 7: 10.
[9] Tanaka, D., et al. (2015). "Characteristics of localized surface plasmons excited on mixed monolayers composed of self-assembled Ag and Au nanoparticles." Nanoscale 7(37): 15310-15320.
44
[10] Masuda, M., et al. (2018). “Nonlinear Viscoelasticity of Highly Ordered, Two- Dimensional Assemblies of Metal Nanoparticles Confined at the Air/Water Interface.”
Langmuir 34(43): 13025-13034.
[11] Yanase, Y., et al. (2011). "A critical role of conventional protein kinase C in
morphological changes of rodent mast cells." Immunology and Cell Biology 89(1): 149-159.
[12] Toma, M., et al. (2011). "Collective plasmon modes excited on a silver nanoparticle 2D crystalline sheet." Physical Chemistry Chemical Physics 13(16): 7459-7466.
45
Chapter 4. Theoretical Simulation of enhanced optical field by LSPR using the Finite Difference Time Domain (FDTD) method
In this chapter, the intensity of electric field excited on the surface of oleylamine-capped gold nanoparticle (AuOA) sheet is simulated using the finite difference time domain (FDTD) method. Furthermore, the intensity of “effective” electric field is estimated in consideration of energy transfer from fluorescent dye to gold nanoparticles.
4-1. Introduction
4-1-1. Finite-Difference Time-Domain (FDTD) method
The FDTD is a numerical analytical method for electromagnetic field proposed by K. S.
Yee in 1966. In the FDTD method, Faraday's law and Ampere's law described by the following equations (4-1) and (4-2) are used [1,2].
𝛻 × 𝐸 = −𝜇𝜕𝐻𝜕𝑡 (4-1)
𝛻 × 𝐻 = 𝜎𝐸 + 𝜀𝜕𝐸𝜕𝑡 (4-2)
𝐸𝑛 = 1−
𝜎𝛥𝑡 2𝜀
1+ 𝜎𝛥𝑡2𝜀 𝐸𝑛−1+
𝛥𝑡 𝜀
1+ 𝜎𝛥𝑡2𝜀 𝛻 × 𝐻𝑛 − 12 (4-3) 𝐻𝑛+ 12= 𝐻𝑛 − 12− 𝛥𝑡𝜇𝛻 × 𝐸𝑛 (4-4) 𝐸 is the electric field, 𝐻 is the magnetic field, 𝜇 and 𝜀 are the magnetic permeability and the dielectric constant of substance. In the FDTD method, the space is divided into meshes with rectangular or cubic microelements called Yee lattices, and the electromagnetic field of each cell is updated sequentially at each time according to the differential equations (4-3)
46
and (4-4) (Figure 4-1) [3]. This is a method in which Maxwell's equations in the time domain are directly differentiated, and it is not necessary to solve simultaneous linear equations and can be easily calculated.
Figure 4-1. Schematic diagram of Yee lattice, in which the spatial elements of electric field 𝐸 and magnetic field 𝐻 are presented. [3]
47
4-1-2. LSPR enhancement on silver nanoparticle sheet
FDTD simulation of electric field distribution of LSPR excited by myristic acid-capped silver nanoparticle (AgMy) sheet has already been performed [4]. The simulation is performed by using commercially available software Poynting for Optics (Fujitsu, Japan). A hexagonally structured 5 nm of AgMy two-dimensional sheet with an interparticle distance of 2 nm is used as a simulation model. In the simulation, a plane light pulse composed of a differential Gaussian function centered at 1.5 fs with a width of 0.5 fs, an intensity of 1 µV / mm and a bandwidth of 600 THz (wavelength 500 nm), is irradiated perpendicular to the AgMy sheet [4]. The result is shown in Figure 4-2, where a strong electric field excited between the nanoparticles are clearly presented.
Figure 4-2. FDTD calculation result of AgMy sheet. In AgMy sheet, nanoparticles form a hexagonally close-packed structure (Ag core diameter: 5 nm, interparticle distance: 2 nm) [4].
48
4-1-3. Energy transfer
Fluorescence placed near the metal substrate surface is quenched by energy transfer.
A part of the energy absorbed by the fluorescent dye is transferred to the metal and is emitted as heat faster than the light emission, which results in fluorescence quenching.
Fluorescence quenching due to energy transfer between donor and acceptor molecules is known as Förster resonance energy transfer (FRET). The efficiency of FRET depends on the distance between the donor and the acceptor [5]. The rate of energy transfer in FRET is given by the following equation:
𝒌𝑭𝑹𝑬𝑻= 𝟏
𝝉𝑫(𝒓𝟎
𝒓)𝟔 (4-5) where 𝝉𝑫 is the lifetime of the donor in the absence of the acceptor, r is the distance between the donor and the acceptor, and r0 is known as the FRET distance, i.e., the distance at which the nonradiative energy transfer rate equals the radiative decay rate of the donor in the absence of the acceptor [5-8]. Energy transfer from a molecular dipole to metal is known to follow another theory, the so-called surface energy transfer (SET), which demonstrates a d−4 dependence and is described as an analog of FRET:
𝒌𝑺𝑬𝑻= 𝟏
𝝉𝑫(𝒅𝟎
𝒅)𝟒 (4-6) where d is the distance between the excited dipole and the metal surface, and d0 is the SET distance [5, 9-11]. The Förster distance represented by 𝒓𝟎 corresponds to 𝒅𝟎 in SET, which refers to the distance at which the effect of FRET or SET reduced to 50%. The SET theory predicts the energy transfer independently of the spectral overlap between the dyes and LSPR of the metal NPs, which instead depends on the dielectric constant of the bulk metal [5,10]. However, as we reported in our previous study, the efficiency of energy transfer between fluorescent dyes and metal NPs certainly depends on the spectrum overlap [12,13].
Therefore, plasmon-induced resonance energy transfer (PIRET) should be a more accurate
49
explanation of this quenching phenomenon according to the most recent publications [14,15].
Nevertheless, we considered that the energy transfer between dyes and metal NPs follows the d−4 dependence given by eq. 4-6 in this study. As the example, the energy transfer efficiency by FRET and SET from the fluorescent dye FAM (Fluorescein) to metal nanoparticles are as shown in Figure 4-3 [6]. It is shown that SET has a longer energy transfer distance than FRET.
The intensity of effective electric field of AgMy sheet in consideration of energy transfer has been calculated and reported in the previous study [16] (Figure 4-4). As shown in Figure 4-4 (a), the nanoparticles are surrounded by a 2 nm thick model surfactant layer (refractive index n = 1.5), and the AgMy sheet is placed at the glass-water interface. Here FRET process is considered. The simulation result revealed that the maximum intensity of the effective electric field of AgMy sheet appeared at the position of several nm from the AgMy sheet (Figure 4-4 (b, c)).
50
Figure 4-3. (a,b)Schematic diagram of donor dye and metal nanoparticle acceptor separated by dsDNA. (c) Energy transfer efficiency plotted against separation distance between FAM and gold nanoparticles. Black circles represent 15 base pair (bp), 20 bp, 30 bp, and 60 bp long DNA. The dashed line represents the theoretical FRET efficiency, and the solid line is the theoretical SET efficiency. [6]
51
Figure 4-4. (a) The model of FDTD calculation of AgMy sheet and the spatial distribution of the enhanced electric field calculated from that model. (b) Intensity of electric field when using incident light at 488 nm and 591 nm. The broken line represents the LSPR intensity obtained by FDTD calculation, and the dotted line represents the FRET efficiency. [16]
4-2. Results and Discussion
4-2-1. TEM image of AuOA sheet
To determine the simulation model structure (particle size, and interparticle distance), TEM images of the AuOA sheet were obtained. of the AuOA sheet were determined (Figure 4-5). The electron microscopy (TEM) images of AuOA sheets were captured using a JEM- ARM200F instrument (JEOL, Tokyo, Japan). The AuOA sheet was prepared on the pristine
52
surface of a TEM grid (U1015: EM Japan) by the LS technique and observed with an acceleration voltage of 200 kV. The diameter of the gold core was ca. 12.6 nm, and the gap distance was ca. 2.6 nm on average. These values were in agreement with interdigitated alkyl chains of the oleylamine capping molecules. The self-assembled structure was formed via hydrophobic interactions when the AuOA were spread on the air-water interface [4]. The AuOA in the sheet exhibit a close-packed structure with some defects and domain boundaries on the surface at the nanoscale (smaller than one pixel size).
Figure 4-5. TEM images of the AuOA NP sheet. The diameter of the gold core was ca. 12.6 nm and the gap distance was ca. 2.6 nm on average.
53
4-2-2. FDTD simulation of AuOA sheet
The intensity of the optical field excited on the AuOA sheet was calculated in the same way as that for AgMy sheet using the commercial software Poynting for Optics (FUJITSU, Japan) [6]. The dielectric function of Au was approximated by the Drude formula based on the literature values reported by Johnson and Christy [16,17]. A periodic boundary condition was set up in the X and Y directions with a basic unit composed of 3 × 10 particles. A perfectly matched layer-absorbing boundary condition was set in the Z direction. A pulsed light composed of a differential Gaussian function with a pulse width of 0.5 fs was used as an excitation source. A non-uniform mesh was used with a grid size of 0.3 nm to 5 nm.
The AuOA sheet was modeled as shown in Figure 4-6. The model is made by hexagonally close-packed spherical particles with the diameter of 12 nm and the interparticle distance of 3 nm. The LSPR field was calculated by assuming a 561 nm laser irradiation perpendicular to the AuOA sheet from a water medium with a refractive index of 1.33. The optical field calculation was performed on line D, to the perpendicular direction from the center position of the adjacent particles (D = 0).
54
Figure 4-6. Model of the AuOA sheet for the calculation. The data in (b) were obtained on line D, where the center position of the adjacent particles was set to D = 0. The attenuation factor by SET at each D position was calculated based on the distance to the closest particle surface (e.g., at the position of D = y, the ‘SET’ value was calculated based on the distance of d = x).
The result is shown in Figure 4-7. The LSPR field intensity, which was 50 times stronger than incident light at the maximum point (D = 1 nm), decayed drastically along the distance of D and became less than the original light intensity at D = 13 nm. This result indicated that the fluorescence enhancement via LSPR could occur only in the region of D < 13 nm in the calculation. The calculated values for the penetration depths of LSPR should be slightly shorter than the actual values in the 2D nanosheet [6]. The enhanced electrical field of the
55
LSPR in the 2D sheet is localized around each nanoparticle, but it can also be transferred to the neighbor particles through plasmon coupling [18]. Thus, the 2D sheet bears the characteristics of enlarged metal structures, and the penetration depth of the 2D sheet must be slightly deeper than that determined by the particle radius. The current calculation with a single pulse excitation does not include the time integral effect, which is necessary to incorporate the effect of the LSPR transfer. Moreover, the periodic boundary model with 3 × 10 particles as the basic unit is too small to see the influence of the LSPR transfer. Based on these reasons, the penetration depth was underestimated in the current FDTD data; however, these calculations are still useful for predicting the nanointerfacial phenomena on the 2D sheet.
The evanescent field excited under the TIR condition at the glass/water interface was calculated by Fresnel simulation and plotted in the inset of Figure 4-7 (light blue solid line) [19]. The optical intensity changed depending on the distance z as described by equation (2- 4). The decay length of the evanescent wave is significantly longer compared with LSPR, e.g., d = 125 nm at λ = 561 nm, θ = 65°.
56
Figure 4-7. Intensity of the optical field excited by LSPR and evanescent waves. The LSPR field intensity excited on the AuOA sheet was calculated using the finite-difference time- domain (FDTD) method based on the model presented in Figure 4-6. The inset shows the evanescent field excited at the glass/water interface under the TIR condition calculated by Fresnel simulation. The penetration depth of LSPR is much shorter (~13 nm) than that of the evanescent wave (~150 nm).
57
4-2-3. The energy transfer to AuOA sheet
The energy transfer from the dye to the AuOA sheet was considered for both FRET (equation 4-5) and SET (equation 4-6). Here we conducted more precise calculation rather than the previous study [16]. When a fluorescent molecule is at a position y, the shortest distance to the gold nanoparticle will be x as described in Figure 4-6. Figure 4-8 is the efficiency of energy transfer calculated based on this model. Since the FRET distance (r0) and the SET distance (d0) varied due to the laser wavelength, the quantum yield of the dye, etc., we have calculated the efficiency of energy transfer by changing d0 and r0 values from 2.5 to 5.
Figure 4-8. (a) FRET and (b) SET profiles calculated via (eq 4-5) and (eq 4-6). The colored dashed lines present the fluorescence attenuation factor due to FRET and SET with various FRET (= 𝑟0) and SET (= 𝑑0) distances. The profiles of FRET and SET are slightly different;
the FRET curve is steeper than the SET curve due to the 𝑟−6 dependence instead of 𝑑−4 dependence.
58
4-2-4. Estimation of effective optical field excited on AuOA sheet
The intensity of ‘effective’ electric field excited on AuOA sheet was calculated by multiplying the intensity of electric field and efficiency of energy transfer [16]. The result is shown in Figure 4-9. The ‘LSPR × FRET (SET)’ value (expected fluorescence enhancement factor) was primarily influenced by the FRET (SET) distance (𝑑0), although the penetration depth from the interface is not changed by them but is determined by the LSPR profile. In Figure 4-9, 0 nm is the center position of the adjacent particles, and 6 nm is the top surface of the AuOA sheet (Figure 4-9 (b)). Regardless of the FRET (SET) distance, when the incident light intensity is 1, the intensity of effective electric field had a maximum at the inside of the AuOA sheet, and the enhancement factor was ~10. These values are summarized in Table 4-1.
59
Figure 4-9. Intensity of the optical field obtained by (a)LSPR X FRET and (b)LSPR X SET.
The black line corresponds to the LSPR field intensity excited on the AuOA sheet calculated by FDTD simulation. The colored dashed lines present the fluorescence attenuation factor due to FRET/SET with various FRET/SET distances. The colored solid lines marked as
‘LSPR × FRET(SET)’ are the LSPR field intensity obtained as LSPR X FRET/SET.
60
Table 4-1. The intensity of effective electric field and the distance from D=0 wavelength for AuOA sheet when it showed maximum with different FRET and SET distance (d0 and r0).
4-2-5. The comparison of the LSPR field and evanescent field
The penetration depth of effective electric field on the AuOA sheet (LSPR × SET) and that of the evanescent light was compared in Figure 4-10. The evanescent light gradually attenuates as the distance from the interface increases. The effective LSPR field intensity on the AuOA sheet decays at the shorter distance than the evanescent light. According to the FDTD simulation, the effective LSPR field intensity on the AuOA sheet exceeds the intensity of the evanescent light at 13 nm position from the interface. In other words, by using AuOA sheet, high contrast imaging of nanointerface (~10 nm region) can be conducted by enhanced fluorescence from the nanointerface with the low background light. From these results, AuOA sheet is expected to show higher signal/noise ratio nanointerfacial image and also higher axial resolution compared with the TIFR microscope.
61
Figure 4-10. The colored solid lines marked as ‘LSPR × SET’ are the LSPR field intensity obtained as the products of LSPR and SET. The light blue line corresponds to the evanescent field excited under the TIR condition at the glass/water interface (incident angle: 65°) calculated by Fresnel simulation.
62
4-3. Summary
In this chapter, the intensity of electric field excited on the AuOA sheet is simulated using FDTD method. LSPR generates an electric field about 50 times stronger than the incident light at the center position of the adjacent particles. The fluorescence quenching due to the energy transfer to the AuOA was also calculated. The effective electric field strength of the AuOA sheet is calculated by multiplying the intensity of LSPR field and the efficiency of energy transfer (FRET and SET). The calculation result revealed a strong electric field generated only in the range of about 10 nm from the AuOA top surface, i.e., a potential of AuOA sheet as the nanointerfacial imaging substrate for fluorescence microscope was suggested.
63
References
[1] 光ナノテクノロジーの基礎 福井萬壽夫・大津元一 (2009) オーム社 [2] プラズモニクス-基礎と応用- 岡本隆之・梶川浩太郎 (2010) 講談社
[3] Oleg, G, R., et al. (2009). “Finite-Difference Time-Domain Simulation of Light
Propagation in 2D Scattering Media.” Nonlinear Phenomena in Complex Systems 12(3):
267-274.
[4] Toma, M., et al. (2011). "Collective plasmon modes excited on a silver nanoparticle 2D crystalline sheet." Physical Chemistry Chemical Physics 13(16): 7459-7466.
[5] Zhang, X., et al. (2012). "Wavelength, Concentration, and Distance Dependence of Nonradiative Energy Transfer to a Plane of Gold Nanoparticles." Acs Nano 6(10): 9283- 9290.
[6] Sen, T. and A. Patra (2012). "Recent Advances in Energy Transfer Processes in Gold- Nanoparticle-Based Assemblies." Journal of Physical Chemistry C 116(33): 17307-17317.
[7] Sen, T., et al. (2008). "Au Nanoparticle-Based Surface Energy Transfer Probe for Conformational Changes of BSA Protein." Journal of Physical Chemistry C 112(46): 17945- 17951.
[8] Reil, F., et al. (2008). "Forster-Type Resonant Energy Transfer Influenced by Metal Nanoparticles." Nano Letters 8(12): 4128-4133.
[9] Sen, T. and A. Patra (2008). "Resonance energy transfer from rhodamine 6G to gold nanoparticles by steady-state and time-resolved spectroscopy." Journal of Physical Chemistry C 112(9): 3216-3222.
[10] Bhowmick, S., et al. (2006). "Resonance energy transfer from a fluorescent dye to a metal nanoparticle." Journal of Chemical Physics 125(18): 6.
[11] Yun, C. S., et al. (2005). "Nanometal surface energy transfer in optical rulers, breaking the FRET barrier." Journal of the American Chemical Society 127(9): 3115-3119.


![Figure 3-6. SEM images of mixed 2D sheet composed of 10 nm AuOA and 5 nm AgMy. [9]](https://thumb-ap.123doks.com/thumbv2/123deta/9794596.1877114/36.892.166.682.209.637/figure-sem-images-mixed-sheet-composed-auoa-agmy.webp)

