論文
バナジウムの水素吸収速度に及ぼす酸素および硫黄の影響
早川 亮1),西野 雅奈子2),波多野 雄治1),Vasily Alimov 3), Alexander I. Livshits 3), 池野 進2),中村 幸男4),大藪 修義4),渡辺 国昭1)
1) 富山大学水素同位体科学研究センター
〒930-8555 富山市五福 3190
2) 富山大学工学部物質生命システム工学科
〒930-8555 富山市五福 3190
3) Bonch-Bruyevich University of Telecommunications 61 Moika, St. Petersberg 191186, Russia
4) 核融合科学研究所
〒509-5292 岐阜県土岐市下石町322-6
Influence of Oxygen and Sulfur on Hydrogen Absorption by Vanadium Ryo Hayakawa 1), Kanako Nishino 2), Yuji Hatano 1), Vasily Alimov 3), Alexander Livshits 3),
Susumu Ikeno 2), Yukio Nakamura 4), Nobuyoshi Ohyabu 4) and Kuniaki Watanabe 1)
1) Hydrogen Isotope Research Center, Toyama University Gofuku 3190, Toyama 930-8555, Japan
2) Department of Material Systems Engineering and Life Science, Faculty of Engineering, Toyama University, Toyama 930-8555, Japan
3) Bonch-Bruyevich University of Telecommunications 61 Moika, St. Petersberg 191186, Russia
4) National Institute for Fusion Science Oroshi-cho, Toki 509-5292, Japan
(Received March 25, 2005; accepted November, 28, 2005)
Abstract
Sticking coefficient of H2, α, on a vanadium surface was measured after heat treatments in vacuum at 673, 873, 973 and 1273 K. The values of α were comparable after heat treatments at 673, 873 and 973 K, while significant reduction was observed after heat
treatment at 1273 K. Arrhenius plots of α showed that the pre-exponential factor, α 0, was far smaller than unity for all heat treatment conditions. This observation indicated that only minor portions of surface sites were active for hydrogen ingress. Change in chemical surface state of V by heat treatments in vacuum at 673, 873, 1073 and 1273 K was also investigated by means of X-ray photoelectron spectroscopy. The specimen surface was mainly covered by VO at 673 K and by an oxygen adlayer at 873 K. Sulfur appeared at 1073 K and completely substituted for oxygen at 1273 K. Namely, sulfur became the dominant surface impurity in the temperature region where α showed significant reduction. It was therefore concluded that the barrier effect of oxygen, including formation of a VO layer, was much weaker than that of sulfur under the present conditions.
1. Introduction
Because of its high hydrogen diffusivity and solubility, vanadium has been recognized as a potential candidate of membrane material for hydrogen separation [1-4]. In addition, the radioactivity induced in vanadium by neutron irradiation is low in comparison with other metals such as niobium. Therefore, vanadium is one of the most suitable materials of superpermeable membrane for particle control and tritium recovery in fusion devices [5,6].
On the other hand, mechanical properties of vanadium at high temperatures are favorable, and hence various vanadium alloys have been developed as candidates of structural materials of fusion blankets [7]. Understanding of ad/absorption and desorption of hydrogen isotopes is important for all of these applications to evaluate the permeation rate and fuel recycling.
Ad/absorption and desorption of hydrogen by vanadium have been studied by numerous researchers [5,6,8-19]. The majority of these studies were carried out not for clean surfaces but for surfaces covered by non-metallic impurities such as oxygen, carbon and sulfur in forms of oxide films and adlayers. This is because vanadium is very reactive to these non-metallic elements, and a clean surface is available only after a number of cycles of
sputtering and heating in an ultra-high vacuum [20]. In other words, properties of vanadium surfaces covered by non-metallic impurities are much more important than those of clean surfaces from the viewpoints of practical applications.
In the previous study, the permeation of hydrogen through a vanadium membrane was examined in a temperature range from 423 to 873 K, and significant increase in permeation rate was observed at around 673 K [10]. The surface analysis by means of X-ray photoelectron spectroscopy (XPS) carried out in a separate apparatus showed that V2O3
(and/or VO2) initially formed on the specimen surface was transformed into VO around this temperature by dissolution of oxygen into the bulk of vanadium. These observations indicated that VO layer is permeable for hydrogen and V2O3 (and/or VO2) layer is not. Conclusion was, however, not derived, because the permeation experiments took much longer time than the duration of heat treatment carried out prior to surface analysis. Hence, one of the purposes of the present study is to examine the property of VO layer formed on vanadium.
Not only oxide films but also adlayers of non-metallic impurities impede surface reaction of hydrogen by producing potential barriers. Characteristics of such potential barriers on vanadium were extensively investigated by various techniques such as angular and energy distribution measurements of desorbing molecules [13,14,17-19]. It is, however, still common to determine the height of potential barrier by a rather simple method. Namely, sticking coefficient of hydrogen molecules, α, is measured at a particular temperature (for example, at room temperature), and the height of potential barrier EC is evaluated from the equation, α = α0·exp (-EC / kTg), by assuming the pre-exponential factor, α0, is unity [12,13]. Here, k is the Boltzmann constant and Tg the gas temperature. Validity of such evaluation, however, has not been confirmed.
The present authors have measured α of H2 on an oxygen-covered niobium surface in a wide temperature range and reported that the potential barrier on the surface was not uniform [21]. Namely, hydrogen absorption took place through the active centers occupying a
small portion of surface sites where the potential barrier was quite low (0.1 eV), while majority of surface sites was completely blocked. It appeared that oxygen-free surface sites (oxygen vacancies on the surface) played a role of such active centers. The above-mentioned simple approach is clearly inappropriate to determine EC for such system. Chemical property of vanadium is similar to that of niobium, and hence it is necessary to examine the uniformity of impurity-induced potential barrier on vanadium surface.
In the present study, specimens of polycrystalline vanadium with different surface states were prepared by heat treatments in vacuum at 673, 873, 973 and 1273 K, and hydrogen absorption was examined in a temperature range from 523 to 1023 K. The surface analysis was carried out in a separate ultra-high vacuum apparatus by means of XPS.
Arrhenius plots of obtained sticking coefficient α showed that the values of α0 were far smaller than unity for all surface states; the surface potential barriers were not uniform. The results of surface analysis indicated that the surface was covered by a layer of VO, an oxygen adlayer, and a sulfur adlayer after heat treatments at 673, 873/973 K and 1273 K, respectively.
The difference in the properties of these layers was discussed.
2. Experimental
2.1. Absorption experiments
Specimens used were cut from a sheet of polycrystalline vanadium in size of 12 × 23.5 × 0.1 mm3. After polishing the surface with abrasive papers, the specimens were cleaned by acetone and installed in a high vacuum apparatus described elsewhere [22].
The specimens were first heated at temperatures from 673, 873, 973 or 1273 K for 7.2 ks to obtain different surface states. Then absorption of H2 was examined in the temperature range from 523 to 1023 K. The temperature for initial heat treatment is denoted as THT and that for absorption experiments as TAB.
Procedures of absorption experiments were as follows. After adjusting the specimen
temperature to a given TAB, a reaction chamber was isolated from a pumping system by closing valves. The main residual gas under this condition was water vapor (H2O) at a pressure of 3×10⁻⁵ Pa. Hydrogen gas was then introduced into the reaction chamber by opening a valve between the reaction chamber and a reservoir. The pressure of H2 in the reservoir dropped to 13.3 Pa instantaneously after opening the valve, and then decreased due to the absorption by the specimen. The rate of H2 absorption was determined from the pressure reduction. The gas temperature Tg was always the same as the specimen temperature TS and equal to TAB in these experiments.
2.2 Surface analysis by X-ray photoelectron spectroscopy
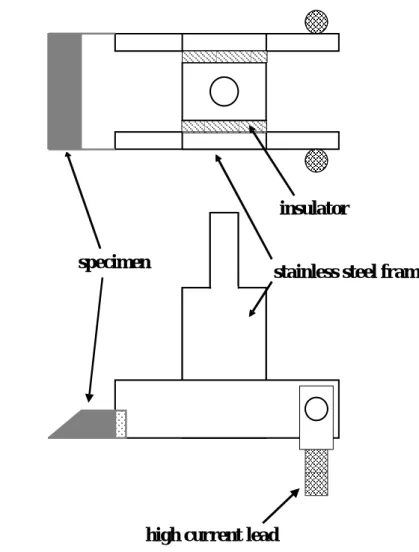
A specimen used for surface analysis was 80 × 7.7 × 0.1 mm3 in size and obtained from the same sheet as that for hydrogen absorption experiments. The surface of the specimen was polished with abrasive papers and cleaned with acetone. After folding into three parts, the edges of the specimen were spot-welded to a stainless steel specimen holder as shown in Fig. 1.
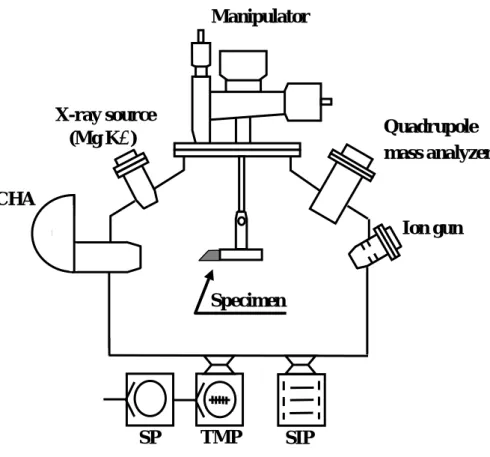
The specimen holder was installed in an ultra-high vacuum apparatus (Fig. 2) evacuated by a turbo-molecular pump (TMP), scroll pump (SP), and sputter-ion pump (SIP).
The pressure of residual gas was 2×10⁻⁷ Pa, and the main component was H2. The electric leads were attached to the holder to heat the specimen ohmically. The temperature of the specimen was evaluated from the applied voltage and electric current by assuming that input power was balanced by energy loss by radiation at a given temperature. An optical pyrometer was also used in a temperature region higher than 1000 K. The values obtained by these two methods agreed fairly well. Non-monochromatized Mg Kα radiation (1253.6 eV) was used for the photoelectron excitation. The energy distribution of photoelectrons was measured by a concentric hemispherical analyzer (CHA).
insulator
high current lead
stainless steel frame specimen
top view
side view
Fig. 1 Schematic description of specimen holder for surface analysis by X-ray photoelectron spectroscopy.
After installation, the chemical surface state of the specimen was first analyzed at room temperature. Then the specimen was heated to 673, 873, 1073 and 1273 K for 1.8-16.8 ks, and change in surface state was examined at room temperature. In order to investigate the influence of cooling to room temperature, the measurements at 673, 873 and 1073 K were also carried out. Photoelectron peaks were slightly broadened by a magnetic field produced by electric current through the specimen, but no significant influence was observed in positions and intensity rations of photoelectron peaks.
X-ray source (Mg Kα)
TMP SIP SP
CHA
Ion gun Quadrupole mass analyzer Manipulator
Specimen
Fig. 2 Schematic description of ultra-high vacuum apparatus for surface analysis by X-ray photoelectron spectroscopy.
3. Results
3.1 Influence of heat treatments on H2 absorption
Typical examples of absorption curves obtained after heat treatments at 673, 973 and 1273 K are shown in Fig. 3. The results after the heat treatment at 873 K are not shown because no significant dependence on THT was observed in a range of THT from 673 to 973 K.
In these cases, the pressure of H2 dropped rapidly and reached constant values by attainment of equilibrium (Fig. 3 (a) and (b)). On the other hand, after the heat treatment at 1273 K, the absorption rate of H2 decreased significantly (Fig. 3 (c)). The sticking coefficient α was
evaluated from the slopes of the absorption curves in the initial stages where the reemission of H2 from the specimen was negligibly small. Under such conditions, the absorption rate is
0 50 100 150 200 250 300
0 2 4 6 8 10 12 14
H2 pressure, P / Pa
Time / sec.
0 50 100 150 200 250 300
0 2 4 6 8 10 12 14
H2 pressure, P / Pa
Time / sec.
0 50 100 150 200 250 300
0 2 4 6 8 10 12 14
H2 pressure, P / Pa
Time / sec.
(a)
TAB = 773 K
523 K
(b) 973 K 773 K 623 K 523 K
1023 K 773 K 523 K
(c)
Fig. 3 Typical examples of H2 absorption curves of vanadium; (a) THT = 673 K, (b) THT = 973 K, and (c) THT = 1273 K.
0.8 1.0 1.2 1.4 1.6 1.8 2.0 2.2 10-8
10-7 10-6 10-5 10-4 10-3 10-2 10-1
Absorption coeffcient, α
TAB-1 / 10 -3 K -1
1100 900 700 500
TAB / K
THT = 1273 K THT = 973 K THT = 673 K
THT = 873 K
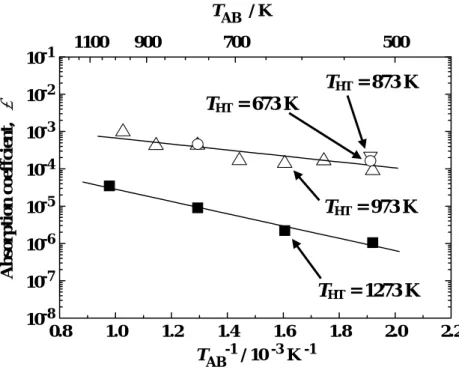
Fig. 4 Temperature dependence of absorption coefficient α of H2.
described by:
AB 0 2 2π H2
kT m A P dt
dN
t
α
=
=
, (1)
where N is the number of H atoms absorbed, t is time, A is the surface area of the specimen, P is the pressure of H2 and mH2 is the mass of a H2 molecule. Here, α corresponds to the probability of ad/absorption of impinging H2 molecule by a single collision to the specimen surface. The values of α thus obtained are shown in Fig. 4. No significant dependence on THT
was observed at THT = 673-973 K as mentioned above. On the other hand, the heat treatment at 1273 K led to the significant reduction in α. The values of α were expressed as:
at THT = 673-973 K, α = 6 ± 4×10⁻³·exp(-0.18 ± 0.03 eV / kTAB) ; (2) at THT = 1273 K, α= 1.3 ± 0.6×10⁻³·exp(-0.33 ± 0.03 eV / kTAB) . (3)
It is apparent that the values of pre-exponential factor are far smaller than unity. These
observations indicate that only small portions of the surfaces were active for H2 absorption under the present conditions. The pre-exponential factor decreased by the heat treatment at 1273 K, whereas the activation energy increased.
3.2 Change in chemical surface state by heat treatments
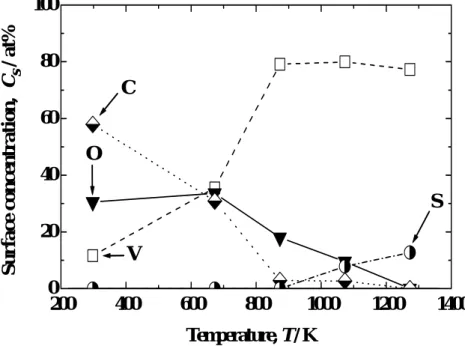
The change in photoelectron spectrum by heat treatments is shown in Fig. 5. Before heating, large peaks of oxygen and carbon were observed along with those of vanadium. The heat treatment at 673 K led to a significant reduction in the intensity of carbon peak, while that of oxygen was still rather strong. Carbon almost disappeared at 873 K. The intensity of oxygen peak was also reduced significantly, while that of vanadium peaks increased. Sulfur appeared at 1073 K and the intensity of its peak increased with temperature. The chemical composition at each temperature was evaluated using the following equation:
= ∑
j j
i i i
s, /
/ S I
S
C I , (4)
where Cs,i is the surface concentration of element i, Ii is the peak area of the corresponding element, and Si is the relative sensitivity factor recommended by Briggs and Seah [23]. The value of Si was assumed to be independent of the chemical state of the corresponding element.
The result is shown in Fig. 6. The main impurity and its concentration were O (34 at%) and C (31 at%) at 673 K, O (18 at%) at 873 K, O (10 at%) and S (8 at%) at 1073 K, and S (13 at%) at 1273 K. The real values of surface concentrations of oxygen, carbon and sulfur may be higher than these values because the surface concentration of vanadium was overestimated due to the contribution of photoelectrons from the bulk layers beneath the surface.
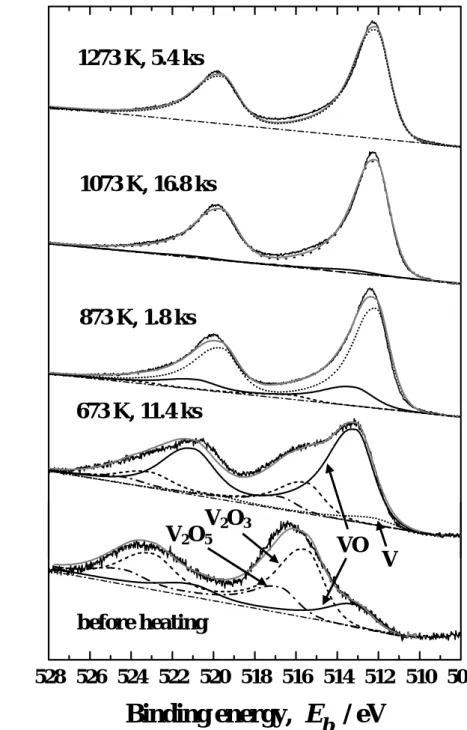
The detailed V 2p photoelectron spectra are shown in Fig. 7. The V 2p3/2 peak appeared at 516.3 eV before the heat treatments. It is known that vanadium forms various oxides in the composition region from V2O3 and V2O5, and this peak energy falls in the range of binding energy Eb between V2O3 (Eb = 515.5 eV) and V2O5 (Eb = 516.8 eV) [24].
800 700 600 500 400 300 200 100 0
Photoelectron intensity (arb. unit)
Binding energy, Eb / eV
1273 K, 5.4 ks
before heating O 1s
V 2p S 2p
1073 K, 16.8 ks
873 K, 1.8 ks
673 K, 11.4 ks C 1s
Fig. 5 Change in photoelectron spectrum of vanadium by heat treatments in vacuum.
Separation of these oxide phases was difficult, and hence only V2O3 and V2O5 were taken into account along with VO (Eb = 513.1 eV) [24] in a deconvolution analysis shown in this figure.
The oxides in the composition region from V2O3 to V2O5 are hereafter denoted as V2O3-V2O5. The heat treatment at 673 K led to the shift of V 2p2/3 peak to 513.1 eV corresponding to the binding energy in VO. At 873 K, the V 2p2/3 peak shifted to 512.2 eV corresponding to
200 400 600 800 1000 1200 1400 0
20 40 60 80 100
S C
O
V
Surface concentration, Cs / at%
Temperature, T / K
Fig. 6 Temperature dependence of surface chemical composition.
metallic V. The oxygen concentration, however, was still high at this temperature as shown in Fig. 6. Therefore, it is appropriate to consider that the surface was covered by an oxygen adlayer. The surface concentration of oxygen decreased as temperature increased from 1073 to1273 K, while that of sulfur increased as described above; oxygen was almost completely substituted by sulfur at 1273 K. No significant change, however, was observed in V 2p photoelectron spectrum. Such surface segregation of sulfur on vanadium surface was observed also by other researchers [8, 13, 14, 17, 25]. The change in oxidation state of V evaluated by the deconvolution analysis is summarized in Fig. 8.
4. Discussion
Figs. 5-8 clearly indicate that VO was present on the surface even after heating at 673 K for 11.4 ks. This duration of heating was longer than that of the heat treatment carried out prior to the H2 absorption experiments, 7.2 ks. In addition, the vacuum condition in the apparatus used for the absorption experiments was poorer than that in the apparatus for
528 526 524 522 520 518 516 514 512 510 508
Photoelectron intensity (arb. unit)
Binding energy, Eb / eV
1073 K, 16.8 ks
V V2O3
V2O5 VO 1273 K, 5.4 ks
873 K, 1.8 ks
673 K, 11.4 ks
before heating
Fig. 7 Change in V 2p photoelectron spectrum by heating in vacuum.
surface analysis. Hence, the values of α obtained after the heat treatment at 673 K corresponds to that on the surface covered by VO. Although the decomposition of VO and formation of the oxygen adlayer were observed by XPS analysis at 873 and 1073 K, no significant change in α was observed up to THT = 973 K. This observation was ascribed to that (i) the sticking coefficients on the surfaces covered by VO layer and oxygen adlayer were
200 400 600 800 1000 1200 1400 0.0
0.2 0.4 0.6 0.8 1.0
Temperature, T / K
Fraction of oxidation states
V VO
V2O3 - V2O5
Fig. 8 Change in fraction of chemical states of vanadium with temperature.
comparable to each other, or (ii) VO was retained at higher temperature in the absorption experiments due to poorer vacuum condition.
The sticking coefficient α on VO-covered surface was radically smaller than that on a clean surface; Beutl et al. [11] reported that α on a clean V (111) surface was 0.15-0.52 at TS = 223 K depending on the translational energy of molecules. It was, however, significantly larger than α on the surface covered by V2O3 –V2O5 as observed in the previous study [10].
The sticking of H2 on the surface covered by the V2O3-V2O5 layer under the present experimental conditions was also examined by absorption experiments at 523 K without prior heat treatment. No significant H2 absorption was observed as expected.
Interestingly, the values of α on VO layer were close to those on a niobium surface covered by an adlayer of oxygen obtained by the experiments in an ultra-high vacuum chamber at the bulk oxygen concentration of 0.1 at% [21]. It appears that the property of the VO layer is close to that of oxygen adlayer from the viewpoints of hydrogen ad/absorption, while it seems to be quite different from the properties of layers of other vanadium oxides.
Krenn et al. [12] measured α on V(100) surface covered by oxygen and carbon and obtained
the value of 5×10⁻⁴ atTS = 90 K and Tg = room temperature, in which the surface covered by oxygen and carbon was prepared by surface segregation during annealing at 1270 K. Their value is higher than that calculated with Eq. (2) for room temperature (6 ± 4 ×10⁻⁶). Direct comparison of the values of α is, however, difficult without information on bulk impurity concentration, because α on the surface covered by segregated impurity can be dependent on bulk impurity concentration as described below.
Müller et al. [15] have examined the hydrogen absorption of vanadium under hydrogen pressure of 2.2×10⁻⁴ Pa at TS = Tg = room temperature and reported that no hydrogen absorption was observed when the specimen surface was covered by an oxide layer.
Their results, however, do not contradict to the present observation for VO-covered surface.
By taking account of the results of the present study and Krenn et al. [12], the value of α at TS = Tg = room temperature appears to be in order of 10-6 to 10-4. At these values of α, the amount of hydrogen absorbed under the experimental conditions of Müller et al. [15] is calculated to be in order of 10-8 to 10-11 mol. Measurements of such small amounts of hydrogen are rather difficult.
The significant drop of α by the heat treatment at 1273 K was ascribed to the poisoning effect of sulfur adlayer. Namely, the poisoning effect of sulfur adlayer appears to be much stronger than that of oxygen adlayer and VO layer. Eibl and Winkler [13] measured the sticking coefficient for D2 molecules on sulfur-covered V(111) surface at Tg = room temperature and obtained the value of 2×10⁻⁴, in which sulfur-covered surface was prepared by annealing at 1300 K. Although the annealing temperature is close, their value is significantly larger than the presently obtained value. One of the reasons for this disagreement may be the difference in bulk concentration of sulfur. According to Langmuir-McLean model [26], the surface concentration of segregated element can be expressed as:
⎟⎟⎠
⎜⎜ ⎞
⎝
= ⎛
− S
seg 0
i b, i
i exp
1 RT
K H
C ∆
θ
θ , (5)
where θ i is the surface coverage of non-metallic impurity, C b,i is the bulk concentration, K0 is a constant and ∆Hseg is the heat of segregation. Namely, sulfur coverage should increase with bulk concentration. The bulk sulfur concentration in the present specimen has not been measured, and that in the specimen of Eibl and Winkler [13] was not described. The impurity content in single crystal specimen, however, is generally lower than that in polycrystalline specimen. Hence, the sulfur coverage on the surface of their specimen could be lower than the present case, resulting in higher α. Such dependence of surface reaction rates of hydrogen on bulk impurity concentration has been demonstrated by the present authors for Nb-O system [27].
Eibl and Winkler [13] evaluated the height of potential barrier for sulfur-covered V(111) surface to be 0.22 eV from the above-mentioned value of sticking coefficient, 2×10⁻⁴, by using relation α = α 0·exp(-EC / RT) by assuming α 0 = 1. Krenn et al. [12] obtained EC for V(100) surface covered by oxygen and carbon to be 0.2 eV by the same technique from the above-mentioned value of α, 5×10⁻⁴. The present results, however, clearly indicate that α 0 is far less than unity for both V-O and V-S systems (Eqs. (2) and (3)). These small values of α 0
indicate that the potential barriers on the surfaces were not uniform, and only small portions of surface sites were active for the surface reactions of hydrogen. Such feature was observed for Nb-O system, and the active centers were assigned to oxygen-free surface sites (oxygen-vacancies) [21]. The values of α 0 far less than unity were also observed for Pd-S system [28]. The physical significance of the values of EC evaluated by Eibl and Winkler [13]
and Krenn et al. [12] are therefore vague. On the other hand, it may be also inappropriate to consider that apparent activation energies obtained from Fig. 4 correspond to the heights of potential barriers. This is because the surface impurity coverage, θ i, itself can be dependent on TS as indicated by Eq. (5). Namely, the number of active centers, 1-θ i, can change with TS, and it is hardly possible to separate the temperature dependence of 1-θ i from that of probability of overcoming the potential barrier (= exp(-EC /RTAB)) only by the experiments at
constant Cb,i. The measurement of θ i by surface analysis appears to be ineffective to solve this problem. If H2 absorption takes place through double impurity free surface sites, the pre-exponential factor α 0 corresponds to (1-θ i)2. When α 0 = 1×10⁻² and 1×10⁻³, for examples, θ i could be evaluated to be 0.90 and 0.97. Such small change in θ i can be hardly detected by conventional surface analysis techniques such as XPS and Auger electron spectroscopy.
The temperature dependence of 1-θ i can be separated from that of probability of overcoming the potential barrier (= exp(-EC /RTAB)) by comparing temperature dependence of α at different bulk impurity concentrations because the latter is not dependent on the bulk impurity concentration. The systematic measurements of α by changing TAB and Cb,i are required to understand the true height of the potential barrier. In the later study, Eibl and Winkler [17] measured the distribution of translational energy of D2 desorbing from sulfur- and oxygen-covered V(111) surfaces and reported that the desorption flux contained both thermal and hyperthermal (8.3 kTS and 5.8 kTS) contributions. These authors ascribed this observation to corrugated potential barrier on the surface. Namely, there are areas in the surface unit cell with negligible activation barrier and those with an activation barrier in the order of 0.3-0.4 eV. In contrast to the present authors, Eibl and Winkler [17] did not take account of the impurity-free surface sites as the active centers. Their technique, however, appears to be appropriate to understand the characteristics of the potential barrier. Namely, important information could be obtained by the measurements of translational energy distributions of desorbing hydrogen molecules for the specimens with different bulk impurity concentrations.
5. Conclusions
Sticking coefficient of H2, α, on vanadium surface was measured after heat treatments in vacuum at 673, 873, 973 and 1273 K. The chemical surface state was analyzed by means of X-ray photoelectron spectroscopy. The following conclusions were derived.
(1) The value of α was comparable after the heat treatments at 673, 873 and 973 K, and significantly reduced by the heat treatment at 1273 K.
(2) The specimen surface was covered by VO and carbon at 673 K, whereas V 2p photoelectron spectra showed the feature of metallic vanadium above 873 K.
(3) Significant surface segregation of sulfur was observed at 1273 K.
(4) The barrier effect of VO layer against hydrogen ingress was much weaker than that of adlayer of sulfur.
(5) The pre-exponential factors of α on VO- and S-covered surfaces were smaller than unity, indicating that only minor portions of surface sites were active against dissociative ingress of H2.
Acknowledgements
This work has been supported in part by a Grant-in-Aid for Young Scientists (A) (No.
14702068) and that for Scientific Research (B) (No. 14380218) from the Ministry of Education, Culture, Sports, Science and Technology of Japan, and the NIFS LHD Project Research Collaboration.
References
[1] C. Nishimura, M. Komaki and M. Amano, Mater. Trans. JIM, 32(5) (1991) 501.
[2] R. Buxbaum and T. L. Marker, J. Membrane Sci., 85 (1993) 29.
[3] C. Nishimura, M. Komaki and M. Amano, Trans. Mat. Res. Soc. Jpn., 18B (1994) 1273.
[4] R. Buxbaum and A. B. Kinney, Ind. Eng. Chem. Res., 35 (1996) 530.
[5] A. I. Livshits, F. Sube, M. N. Solovyev, M. E. Notkin, and M. Bacal, J. Appl. Phys., 84 (1998) 2558.
[6] A. I. Livshits, Y. Hatano, K. Watanabe, Fusion Sci. Technol., 41 (2002) 882.
[7] R. J. Kurtz, K. Abe, V. M. Chernov, D. T. Hoelzer, H. Matsui, T. Muroga and G. R.
Odette: J. Nucl. Mater., 329-333 (2004) 47.
[8] M. Yamawaki, T. Namba, T. Kiyoshi, T. Yoneoka and M. Kanno, J. Nucl. Mater., 133&134 (1989) 292.
[9] M. Yamawaki, K. Yamaguchi, S. Tanaka, T. Namba, T. Kiyoshi and Y. Takahashi, J. Nucl. Mater., 162-164 (1989) 1071.
[10] R. Hayakawa, Y. Hatano and K. Watanabe, Ann. Rep. Hydrogen Isotope Res. Ctr., Toyama Univ., 19 (1999) 57. (in Japanese)
[11] M. Beutl, J. Lesnik, E. Lundgren, C. Konvicka, P. Verga and K. D. Rendulic, Surf. Sci., 447 (2000) 245.
[12] G. Krenn, C. Eibl, W. Mauritsch, E. L. D. Hebenstreit, P. Varga and A. Winkler, Surf.
Sci., 445 (2000) 343.
[13] C. Eibl and A. Winkler, Surf. Sci., 482-485 (2001) 201.
[14] H. Schiechl, D. Gleispach and A. Winkler, J. Phys. Chem. B, 105 (2001) 3849.
[15] K. –H. Müller, H. Paulus and G. Kiss, Appl. Surf. Sci., 179 (2001) 292.
[16] H. Schiechl and A. Winkler, Fresenius J. Anal. Chem., 371 (2001) 342.
[17] C. Eibl and A. Winkler, J. Chem. Phys., 117 (2002) 834.
[18] D. Gleispach, P. Kailbauer and A. Winkler, Vacuum, 71 (2003) 95.
[19] D. Gleispach and A. Winkler, Surf. Sci., 537 (2003) L435.
[20] T. Valla, P. Pervan and M. Milun, Surf. Sci., 307-309 (1994) 843.
[21] Y. Hatano, A. Livshits, A. Busnyuk, M. Nomura, K. Hashizume, M. Sugisaki, Y. Nakamura, N. Ohyabu and K. Watanabe, Phys. Scr., T108 (2004) 14.
[22] R. Hayakawa, Y. Hatano, A. Pisarev and K. Watanabe, Phys. Scr., T108 (2004) 38.
[23] D. Briggs and M. P. Seah, Practical surface analysis by Auger and X-ray Photoelectron spectroscopy (Japanese edition), Agne, Tokyo, 1990, p. 267.
[24] R. Hayakawa, Thesis, Toyama University, 2003, p. 20. (in Japanese)
[25] R. Koller, W. Bergermayer, G. Kresse, E. L. D. Hebenstreit, C. Konvicka, M. Schmid, R.
Podloucky and P. Varga, Surf. Sci., 480 (2001) 11.
[26] D. McLean, Grain Boundaries in Metals, Clarendon Press, Oxford, 1957, p. 116.
[27] R. Hayakawa, A. Busnyuk, Y. Hatano, A. Livshits and K. Watanabe, Phys. Scr., T103 (2003) 113.
[28] B. Dean, A. A. Haasz and P. C. Stangeby, J. Vac. Sci. Technol., A5 (1987) 2332.